Introduction to statistics for social sciences canadian 1st edition colwell test bank
Bạn đang xem bản rút gọn của tài liệu. Xem và tải ngay bản đầy đủ của tài liệu tại đây (536.73 KB, 19 trang )
02
Student: _______________________________________________________________________________________
1. Which of the following is a FALSE statement?
A. The bottom entry in the cumulative percentage frequency is always 1.0 (100%).
B. A frequency distribution is the summary of the values of a variable based on the number of times with which they occur.
C. Frequency distributions are only valid for nominal data.
D. Relative frequency is the frequency of a specific response over the total number of responses.
2. You have the following data from a survey question where the responses were coded as 1, 2, 3, 4, or 5. What are the
missing values for response 3?
A. Frequency is 261, Relative Frequency is 0.224, and Cumulative Percentage Frequency is 0.733.
B. Frequency is 593, Relative Frequency is 0.509 and Cumulative Percentage Frequency is 0.733.
C. Frequency is 593, Relative Frequency is 0.509 and Cumulative Percentage Frequency is 1.02.
D. Frequency is 261, Relative Frequency is 0.733, and Cumulative Percentage Frequency is 0.224.
3. If 96 respondents to a survey are male and the relative frequency of males is 0.24, how many people, both male and
female, responded?
A. 96
B. 120
C. 304
D. 400
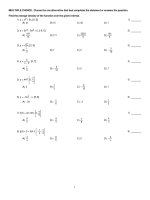
4. Given the following data, what would be the width of each class interval to give 5 classes?
A. 17
B. 18
C. 19
D. 20
5. Given the data in Question 4 what would the first class interval, class limits, class boundaries, and midpoints be?
A. Class Interval 522, Class limits 5, 22, class boundaries 4.522.5, and midpoint is 13.5
B. Class Interval 524, Class limits 5, 24, class boundaries 4.524.5, and midpoint is 14.5.
C. Class Interval 523, Class limits 5, 23, class boundaries 4.523.5, and midpoint is 14.
D. Class Interval 018, Class limits 0, 18, class boundaries 0.518.5, and midpoint is 9.
An amusement park is interested in the age and gender of the guests attending a special exhibit. The data are
summarized below:
6. What is the total number of people attending the special exhibit?
A. 747
B. 1,167
C. 1,914
D. 2,000
7. What percent of the attendees were female?
A. 26%
B. 39%
C. 50%
D. 61%
8. What age group accounted for 37.51% of those attending the special exhibit?
A. 17 and under
B. 18 to 25
C. 25 to 34
D. 35 and over
9. A social service organization is interested in the number of people who have accessed their services over the past
number of years. In 2008 there were 732, and in 2009, 984 people accessed the services. What is the percentage change
over the two years?
A. 14.69%
B. 25.61%
C. 34.43%
D. 57.34%
10. When comparing two values of variable based on the frequency this is called a
A. frequency distribution.
B. percentage change.
C. rate.
D. ratio.
11. Dr. Boyle was investigating the effect of invasive species of birds to an ecosystem and found that there was a ratio of
3.51 nonnative birds to native bird. What does this ratio represent? That
A. for every 1 native bird there are 3.51 nonnative birds in area of study.
B. for every 1 nonnative bird there are 3.51 native birds in the area of study.
C. is the same as saying the ratio is 1:3.51 nonnative birds to native birds
D. is impossible you can't have 0.51 birds.
12. A local animal shelter was interested in pet ownership of people living in urban and rural communities. They found that
in an urban population of 253,250 that 94,968 owned a pet and in the rural population of 40,025 that 16,811 owned a
pet.
The rate of pet ownership per 100 people is
A. 0.375 for the urban area and 0.420 for the rural area.
B. 32.38 for the urban area and 5.73 for the rural area.
C. 37.50 for the urban area and 42.00 for the rural area.
D. 84.96 for the urban area and 15.04 for the rural area.
13. A manager of a coffee shop was interested in the number of customers who ordered the different sizes of coffee they
served. The manager took a tally of the number of cups used from each size during the week and produced the following
frequency table:
Which of the following pie charts best describes the data?
A.
B.
C.
D.
Note: Data used to create Distracter graphs
14. Given the following bar graph on highest education level achieved in a given population:
Approximately how many people have completed "postsecondary or trade school" as their highest level of education?
A. 5
B. 10
C. 12
D. 27
Note: Data used to create the bar chart for this question is:
15. Which of the following statements is FALSE?
A. Frequency polygons and cumulative percentage frequency have similar shapes.
B. Frequency polygons are useful in understanding the shape of a frequency distribution.
C. Histograms are useful for graphically displaying interval and ratio data.
D. Pie and bar charts are best suited for nominal and ordinal data, but can also be used for interval and ratio.
16. A researcher working for Canadian Blood Services is interested in categorizing the phenotype of the blood donors. The
blood types are recorded in one of eight categories (A+, A, B+, B, AB+, AB, O+, and O). Which of the following
graph types would be the most appropriate to graph the data?
A. Bar graph
B. Cumulative percentage frequency polygon
C. Frequency polygon
D. Histogram
Below is a histogram of a statistical exam from a class of 144 students. The exam was out of 25 marks.
17. What was the most frequently occurring grade in the class?
A. 14
B. 18
C. 19
D. 25
18. About how many students scored 80% or more in this class?
A. 33
B. 44
C. 47
D. 50
19. The percent of students who failed the exam (scored 50% or below) is
A. under 6%.
B. about 8%.
C. about 10%.
D. about 12%.
20. A line graph with class intervals on the xaxis and the frequencies on the yaxis displaying a polygon of interval or ratio
data is a
A. Bar graph.
B. Cumulative frequency polygon
C. Frequency polygon
D. Histogram
A stats professor is interested in drinking prevalence in university students. He asks 50 students the number of drinks
they have had in the past week. The data are presented in the following graph.
21. What type of graph is this?
A. Bar graph
B. Cumulative frequency polygon
C. Frequency polygon
D. Histogram
22. What percent of the students had 4 or fewer drinks in the past week?
A. Less than 40%.
B. About 50%.
C. About 60%
D. About 70%
23. Create a frequency table for the following data, include frequency, percentage frequency, cumulative percentage
frequency, and indicate the class limits, boundaries and midpoint for each class interval.
24. Define 3 of the following terms, frequency, frequency distribution, relative frequency, or cumulative percent frequency.
25. Discuss why we display numerical data using graphs in statistics? In your answer compare the different graphing types
mentioned in class and indicate the type of data each is suited for. Use examples.
02 KEY
1. (p. 39Which of the following is a FALSE statement?
42)
A. The bottom entry in the cumulative percentage frequency is always 1.0 (100%).
B. A frequency distribution is the summary of the values of a variable based on the number of times with which they occur.
C. Frequency distributions are only valid for nominal data.
D. Relative frequency is the frequency of a specific response over the total number of responses.
Colwell Chapter 02 #1
Learning Objective: 0201 Define and describe the terms frequency and frequency distribution.
Learning Objective: 0202 Define and describe the terms relative frequency; percentage frequency; and cumulative percentage frequency.
Learning Objective: 0203 Construct frequency tables for nominal and ordinal data.
2. (p. 42You have the following data from a survey question where the responses were coded as 1, 2, 3, 4, or 5. What are the
43)
missing values for response 3?
A. Frequency is 261, Relative Frequency is 0.224, and Cumulative Percentage Frequency is 0.733.
B. Frequency is 593, Relative Frequency is 0.509 and Cumulative Percentage Frequency is 0.733.
C. Frequency is 593, Relative Frequency is 0.509 and Cumulative Percentage Frequency is 1.02.
D. Frequency is 261, Relative Frequency is 0.733, and Cumulative Percentage Frequency is 0.224.
Colwell Chapter 02 #2
Learning Objective: 0203 Construct frequency tables for nominal and ordinal data.
3. (p. 41If 96 respondents to a survey are male and the relative frequency of males is 0.24, how many people, both male and
43)
female, responded?
A. 96
B. 120
C. 304
D. 400
Colwell Chapter 02 #3
Learning Objective: 0203 Construct frequency tables for nominal and ordinal data.
4. (p. 46) Given the following data, what would be the width of each class interval to give 5 classes?
A. 17
B. 18
C. 19
D. 20
Colwell Chapter 02 #4
Learning Objective: 0204 Construct class intervals for interval and ratio data.
5. (p. 45Given the data in Question 4 what would the first class interval, class limits, class boundaries, and midpoints be?
47)
A. Class Interval 522, Class limits 5, 22, class boundaries 4.522.5, and midpoint is 13.5
B. Class Interval 524, Class limits 5, 24, class boundaries 4.524.5, and midpoint is 14.5.
C. Class Interval 523, Class limits 5, 23, class boundaries 4.523.5, and midpoint is 14.
D. Class Interval 018, Class limits 0, 18, class boundaries 0.518.5, and midpoint is 9.
Colwell Chapter 02 #5
Learning Objective: 0204 Construct class intervals for interval and ratio data.
An amusement park is interested in the age and gender of the guests attending a special exhibit. The data are
summarized below:
6. (p. 49What is the total number of people attending the special exhibit?
Colwell Chapter 02
51)
A. 747
B. 1,167
C. 1,914
D. 2,000
Colwell Chapter 02 #6
Learning Objective: 0206 Create cross tabulations.
7. (p. 49What percent of the attendees were female?
51)
A. 26%
B. 39%
C. 50%
D. 61%
8. (p. 49What age group accounted for 37.51% of those attending the special exhibit?
Colwell Chapter 02 #7
Learning Objective: 0206 Create cross tabulations.
51)
A. 17 and under
B. 18 to 25
C. 25 to 34
D. 35 and over
Colwell Chapter 02 #8
Learning Objective: 0206 Create cross tabulations.
9. (p. 51A social service organization is interested in the number of people who have accessed their services over the past
52)
number of years. In 2008 there were 732, and in 2009, 984 people accessed the services. What is the percentage
change over the two years?
A. 14.69%
B. 25.61%
C. 34.43%
D. 57.34%
Colwell Chapter 02 #9
Learning Objective: 0207 Calculate percentage change; ratios; and rates.
10. (p. 52When comparing two values of variable based on the frequency this is called a
53)
A. frequency distribution.
B. percentage change.
C. rate.
D. ratio.
Colwell Chapter 02 #10
Learning Objective: 0207 Calculate percentage change; ratios; and rates.
11. (p. 52Dr. Boyle was investigating the effect of invasive species of birds to an ecosystem and found that there was a ratio
53)
of 3.51 nonnative birds to native bird. What does this ratio represent? That
A. for every 1 native bird there are 3.51 nonnative birds in area of study.
B. for every 1 nonnative bird there are 3.51 native birds in the area of study.
C. is the same as saying the ratio is 1:3.51 nonnative birds to native birds
D. is impossible you can't have 0.51 birds.
Colwell Chapter 02 #11
Learning Objective: 0207 Calculate percentage change; ratios; and rates.
12. (p. 54A local animal shelter was interested in pet ownership of people living in urban and rural communities. They found
57)
that in an urban population of 253,250 that 94,968 owned a pet and in the rural population of 40,025 that 16,811
owned a pet.
The rate of pet ownership per 100 people is
A. 0.375 for the urban area and 0.420 for the rural area.
B. 32.38 for the urban area and 5.73 for the rural area.
C. 37.50 for the urban area and 42.00 for the rural area.
D. 84.96 for the urban area and 15.04 for the rural area.
Colwell Chapter 02 #12
Learning Objective: 0207 Calculate percentage change; ratios; and rates.
13. (p. 57A manager of a coffee shop was interested in the number of customers who ordered the different sizes of coffee
58)
they served. The manager took a tally of the number of cups used from each size during the week and produced the
following frequency table:
Which of the following pie charts best describes the data?
A.
B.
C.
D.
Colwell Chapter 02 #13
Learning Objective: 0208 Create and interpret pie and bar charts.
Note: Data used to create Distracter graphs
Colwell Chapter 02
14. (p. 57Given the following bar graph on highest education level achieved in a given population:
58)
Approximately how many people have completed "postsecondary or trade school" as their highest level of
education?
A. 5
B. 10
C. 12
D. 27
Note: Data used to create the bar chart for this question is:
Colwell Chapter 02 #14
Learning Objective: 0208 Create and interpret pie and bar charts.
15. (p. 57Which of the following statements is FALSE?
Colwell Chapter 02
65)
A. Frequency polygons and cumulative percentage frequency have similar shapes.
B. Frequency polygons are useful in understanding the shape of a frequency distribution.
C. Histograms are useful for graphically displaying interval and ratio data.
D. Pie and bar charts are best suited for nominal and ordinal data, but can also be used for interval and ratio.
Colwell Chapter 02 #15
Learning Objective: 0208 Create and interpret pie and bar charts.
Learning Objective: 0209 Create and interpret frequency polygons and cumulative percentage frequency polygons.
Learning Objective: 0210 Create and interpret histograms; stemandleaf plots; and boxplots.
16. (p. 57A researcher working for Canadian Blood Services is interested in categorizing the phenotype of the blood donors.
65)
The blood types are recorded in one of eight categories (A+, A, B+, B, AB+, AB, O+, and O). Which of the
following graph types would be the most appropriate to graph the data?
A. Bar graph
B. Cumulative percentage frequency polygon
C. Frequency polygon
D. Histogram
Colwell Chapter 02 #16
Learning Objective: 0208 Create and interpret pie and bar charts.
Learning Objective: 0209 Create and interpret frequency polygons and cumulative percentage frequency polygons.
Learning Objective: 0210 Create and interpret histograms; stemandleaf plots; and boxplots.
Below is a histogram of a statistical exam from a class of 144 students. The exam was out of 25 marks.
17. (p. 62What was the most frequently occurring grade in the class?
Colwell Chapter 02
64)
A. 14
B. 18
C. 19
D. 25
Colwell Chapter 02 #17
Learning Objective: 0210 Create and interpret histograms; stemandleaf plots; and boxplots.
18. (p. 62About how many students scored 80% or more in this class?
64)
A. 33
B. 44
C. 47
D. 50
Colwell Chapter 02 #18
Learning Objective: 0210 Create and interpret histograms; stemandleaf plots; and boxplots.
19. (p. 62The percent of students who failed the exam (scored 50% or below) is
63)
A. under 6%.
B. about 8%.
C. about 10%.
D. about 12%.
Colwell Chapter 02 #19
Learning Objective: 0210 Create and interpret histograms; stemandleaf plots; and boxplots.
20. (p. 59A line graph with class intervals on the xaxis and the frequencies on the yaxis displaying a polygon of interval or
61)
ratio data is a
A. Bar graph.
B. Cumulative frequency polygon
C. Frequency polygon
D. Histogram
Colwell Chapter 02 #20
Learning Objective: 0209 Create and interpret frequency polygons and cumulative percentage frequency polygons.
A stats professor is interested in drinking prevalence in university students. He asks 50 students the number of drinks
they have had in the past week. The data are presented in the following graph.
21. (p. 59What type of graph is this?
Colwell Chapter 02
61)
A. Bar graph
B. Cumulative frequency polygon
C. Frequency polygon
D. Histogram
Colwell Chapter 02 #21
Learning Objective: 0209 Create and interpret frequency polygons and cumulative percentage frequency polygons.
22. (p. 59What percent of the students had 4 or fewer drinks in the past week?
61)
A. Less than 40%.
B. About 50%.
C. About 60%
D. About 70%
Colwell Chapter 02 #22
Learning Objective: 0209 Create and interpret frequency polygons and cumulative percentage frequency polygons.
23. (p. 45Create a frequency table for the following data, include frequency, percentage frequency, cumulative percentage
47)
frequency, and indicate the class limits, boundaries and midpoint for each class interval.
Variable: depends on number of classes.
Colwell Chapter 02 #23
Learning Objective: 0205 Construct frequency tables for interval and ratio data.
24. (p. 39Define 3 of the following terms, frequency, frequency distribution, relative frequency, or cumulative percent
41)
frequency.
Variable
Colwell Chapter 02 #24
Learning Objective: 0201 Define and describe the terms frequency and frequency distribution.
Learning Objective: 0202 Define and describe the terms relative frequency; percentage frequency; and cumulative percentage frequency.
25. (p. 57Discuss why we display numerical data using graphs in statistics? In your answer compare the different graphing
65)
types mentioned in class and indicate the type of data each is suited for. Use examples.
Variable
Colwell Chapter 02 #25
Learning Objective: 0208 Create and interpret pie and bar charts.
Learning Objective: 0209 Create and interpret frequency polygons and cumulative percentage frequency polygons.
Learning Objective: 0210 Create and interpret histograms; stemandleaf plots; and boxplots.
02 Summary
Category
# of Questions
Colwell Chapter 02
Learning Objective: 0201 Define and describe the terms frequency and frequency distribution.
Learning Objective: 02
02 Define and describe the terms relative frequency; percentage frequency; and cumulative percentage frequency.
Learning Objective: 0203 Construct frequency tables for nominal and ordinal data.
Learning Objective: 0204 Construct class intervals for interval and ratio data.
Learning Objective: 0205 Construct frequency tables for interval and ratio data.
Learning Objective: 0206 Create cross tabulations.
Learning Objective: 0207 Calculate percentage change; ratios; and rates.
Learning Objective: 0208 Create and interpret pie and bar charts.
Learning Objective: 02
09 Create and interpret frequency polygons and cumulative percentage frequency polygons.
Learning Objective: 0210 Create and interpret histograms; stemandleaf plots; and boxplots.
30
2
2
3
2
1
3
4
5
6
6