Determinant of customer satisfaction at bank BNI ATM services
Bạn đang xem bản rút gọn của tài liệu. Xem và tải ngay bản đầy đủ của tài liệu tại đây (615.48 KB, 16 trang )
www.ijbcnet.com
International Journal of Business and Commerce
(ISSN: 2225-2436)
Vol. 5, No.07: [35-50]
DETERMINANT OF CUSTOMER SATISFACTION AT BANK BNI ATM
SERVICES IN MEDAN
Andriasan Sudarso & Lili Suryati
Lecturers of Sekolah Tinggi Ilmu Ekonomi IBBI Medan,
Indonesia
ABSTRACT
The purpose of this research was to determine and to analyze the influence of physical
evidence and process partially or simultaneously on customer satisfaction. The
population in this research was the customers of Bank BNI ATM in Medan. The research
used a descriptive and explanatory methods. The sample were 270 respondents, and the
data were analyzed by using SEM (Structural Equation Modeling) and Lisrel. Findings in
this research were that physical evidence had positive and significant influence on
customer satisfaction. Process had positive and significant influence on customer
satisfaction. Physical evidence and process simultaneously had positive and significant
influence on customer satisfaction with the contribution of 69% while the remaining 31%
were influenced by the other factors. Physical evidence was the most dominant influence
on customer satisfaction.
Keywords: Physical Evidence, Process, Customer Satisfaction
Published by Asian Society of Business and Commerce Research
35
www.ijbcnet.com
International Journal of Business and Commerce
(ISSN: 2225-2436)
Vol. 5, No.07: [35-50]
1. INTRODUCTION
One of the facilities of banking services that are currently provided to facilitate transactions for
customers is through an ATM (Automated Teller Machine). Some clients range obtained by the ATM is a
24-hour customer service for a wide range of banking transactions, among others include cash
withdrawals, savings account balance inquiry, funds transfer, cash deposit (via machine CDM) and
perform various types of bill payments without having to come directly to the office of a bank.
ATM usage has grown rapidly, as consumers increasingly accept the use of the tool. Field
research conducted in several countries showed that the bank’s customer actually prefer the use of a
transaction with an ATM rather than using the cash register. Teller machine has been accepted by the
society and the number of installations increases, the cost of which use the transaction continues to
decline, for example, research in the United States shows that transactions using the machines require a
lower cost because of the tendency of the price of the machine costs decrease and the volume of
transactions increased, while transactions via teller increased costs due to rising labor costs (Setyo
Soedradjat in Khuzaini, 2012)
PT. Bank Negara Indonesia (Persero) Tbk. is one of the bank categorized State-Owned
Enterprises (SOEs) in Indonesia. Established since 1946, earlier known as Bank Negara Indonesia, is the
first bank established by the Government of Indonesia. The term 'Bank BNI' is shortened to 'BNI', while
the establishment of '46' is used in the company's logo to reinforce the pride as the first national bank was
born in the era of the Republic of Indonesia (NKRI). Departing from the spirit of the struggle that is
rooted in its history, Bank BNI is determined to provide the best service for the country, and continue to
be the pride of the country in accordance with the vision of Bank BNI Bank national pride is Becoming a
Winning, Leading and Service Leadership and Performance.
Services and performance of Bank BNI become the focus of management in improving the
company's services to its customers. One product that is used as a gauge of Bank BNI in the success of
the vision is an ATM (Automatic Teller Machine). Bank BNI ATMs managed by internal and external
parties. What is meant by the management of ATM BNI internal Party that is where ATM BNI managed
by BNI Bank employee who is in each team consisting of a team of ATM Regional Center (ATMRC)
amounting to 23 teams and a team of 48 branch team. While management by external parties, namely
where the ATM BNI managed by both parties, amounting to 29 teams, which is a service company that is
willing to provide services Cash Replenishment and First Line Maintenance ATM. Cash Replenishment
is a work delivery and charging of cash into the ATM machine so ATM can be used for cash withdrawal
transactions performed by the second party with the number of charging and denominations as specified
by the First Party and the First Line Maintenance is the first corrective actions for any problems that arise
in ATMs under management of the Second Party as well as other work undertaken by Both parties as
stipulated in the Cooperation Agreement. One task of the team is to maintain Service Level (performance)
above the average ATM stipulated in the SLA (Service Level Agreement).
Bank BNI Medan City belonging to the territory South Sumatera Office, based on data from
ATM Performance in 2013 has had a number of 262 ATM locations with the distribution of ATM
locations located in multiple locations that are expected to provide convenience to all customers of Bank
BNI in service and access to Bank BNI. Locations that have been mentioned are in the service centers and
the interests of society, namely Pharmacies, Government Agencies, Shopping, Minimarket, Gas Station,
Hospital and at the Branch Offices of Bank BNI (Source: ATMRC Medan City, processed, 2014).
Published by Asian Society of Business and Commerce Research
36
www.ijbcnet.com
International Journal of Business and Commerce
(ISSN: 2225-2436)
Vol. 5, No.07: [35-50]
The recapitulation of the average percentage of monthly ATM transactions Medan City are
scattered in 262 mununjukkan ATM transaction levels are still relatively high, but the average rate of the
transaction at the ATM Medan City is still below the maximum transaction rate (100%) were determined,
namely the number of transactions at ATMs between 11,000 transactions up to 14,000 transactions per
month (Bank Indonesia Regulation Number 11/11 / PBI / 2009). In 2013, during the month of January
from 262 percent the average ATM transactions reached 99.674%, in February decreased to 99.630%, the
average percentage bulanMaret transactions reached 99.668%, in April the average percentage of
transactions reached 99.652%, month May the average percentage of transactions reached 99.696%, in
June the average percentage of transactions reached 99.659%, in July the average percentage of
transactions reached 99.690%, in August the average percentage of transactions reached 99.691%, in
September the average percentage of the transaction reached 99.675%, in October the average percentage
of transactions reached 99.681%, in November the average percentage of transactions reached 99.709%,
while in December the average percentage of transactions reached 99.658%. Overall, the average
percentage of transactions in 2013 was 99.674%. (Source: ATMRC Medan City, processed, 2014)
Based on these data it appears that recapitulation average percentage every month Medan City
BNI ATM transactions spread over 262 ATMs still show the transaction levels are still quite high, which
is still above 99%, but in the growth of transactions every month fluctuations are quite high. Where the
reduction in transaction occurred in February (-0.044%), April (-0.016%), June (-0.037%), September (0.016) and December (-0.051) with the sharpest drop in transactions was in December that reached 0.051
% from the Previous Month. While the increase of transactions occurred in March (0.038%), in May
(0.044%), July (0.031%), August (0.001%), October (0.006%) and November (0.028) with the highest
increase in transactions was in May reached 0.044%. Then fluctuations in the period of 2013 decreased 5
months of transactions in the transaction while the increase in transactions reached 7 months of the
transaction. Furthermore, the most striking is the decline in transactions that take place in December (the
highest decrease), which should be expected transactions in December increased compared to the
previous month (November), but in fact decreased transactions reached 0.001%. A decrease in the level of
transactions each month at ATM BNI Medan City though still below 1% but still will provide a big
enough impact on the profitability of the business of Bank BNI and the impact on the competitiveness of
Bank BNI.
A decrease in the percentage of transactions at ATM BNI Medan City above can be caused by
several factors, such as customer prefers to use, and take advantage of other ATMs outside Medan City
scattered in multiple locations or using other bank ATMs for many and frequent ATM that does not work,
which reached 17.18% or 45 ATM area. In addition to non-functioning of ATM customers choose other
ATMs outside Medan City also caused by several things such as physical discomfort ATM space, limited
vehicle parking facilities, complete service facilities that should be contained in any ATM machine such
as air conditioners, trash, as well as with circumstances surrounding ATM partially visible seedy and
uncomfortable so that customers be willing to come and use it.
Afshar Asghar et. all (2011) based on the results of the research states "that there are high
positive correlation between the constructs of customer service and product with customer satisfaction
and loyalty." That there positive correlation tall one between construction service customer and product
quality with satisfaction customer and loyalty. So based on the statement of transactions at ATM BNI
decline Medan City caused by the dissatisfaction of customers / consumers against some of the factors
contained in the ATM. This is indicated by the high customer complaints than 262 ATMs in the territory
Published by Asian Society of Business and Commerce Research
37
www.ijbcnet.com
International Journal of Business and Commerce
(ISSN: 2225-2436)
Vol. 5, No.07: [35-50]
Medan City who make complaints users through Customer Service and recap ATMRC system Medan
City during 2013 there has been a complaint through the complaint system was recorded in January 2013
as many as 15 customer complaints (7.61% ), February 21 complaints (10.66%), March 16 complaints
(8.12%), April 24 complaints (12.18%), May 23 complaints (11.68%), June 14 complaints (7.11% ), July
15 complaints (7.61%), August 10 complaints (5.08%), September 14 complaints (7.11%), October 9
complaints (4.57%), November 17 complaints (8.63% ), and in December were 19 complaints (9.64%).
So within waktui 1 year (2013) reached an average of 8.33% per month or 17 Customer complaints. Then
follow up of Bank Indonesia Regulation Number 11/11 / PBI / 2009 on Organization Card Payment
Instrument. The management of Bank Negara Indonesia in the implementation has set a target in
Performance ATM with SLA targets transactions reached 100% or zero complaints.
Then Lovelock (2002: 69), states that the services element can be responded by the customer in
the delivery of services is the marketing mix, product, price, place, promotion, physical support, Process,
and contact personnel. Thus, Customer Satisfaction in the banking sector depends also on the marketing
mix, product, price, place, promotion, physical support, Process, and contact personnel. While Riyaz
Ahmad Rainayee, Rouf Ahmad Mir, Arfat Ahmad (2013: 371) through his research on the Customer
Banking, stated "that people, and physical evidence have a significant impact on Customer Satisfaction in
the retail banking sector". That the people and physical evidence have a significant impact on
Satisfaction Customer in banking sector.
Based on the above statement, alleged that the low level of customer satisfaction on the use of
ATM BNI Bank BNI Medan City allegedly by low levels of physical infrastructure (physical evidence)
and process. It is based on the results of direct observation of researchers (2013) to the facility of ATM
Medan City. From the observation showed that the presence of some poor infrastructure services, such as
air-conditioning in the room regarding the ATM is not functioning properly, poor cleanliness of the room,
ATM machine malfunction, lack of availability of adequate parking space, room service ATM relatively
narrow, location ATM position less secure. While the lack of good service processes in ATM BNI Medan
City indicated based on initial observations of researchers (2013) is generally the customer who uses
relatively slow complained ATM cash machine transaction process, lack of clarity of features besides
making transactions, the slow process of handling the ATM error, slowness funds at ATMs charging
process, frequent errors at the time of the transaction process.
In the book A Passion For Excellence, argued that there are only two ways to compete, namely:
Giving more attention to customers by way of providing superior service quality and continuous
innovation. In other words, be oriented to customers (Sunny Goh TH & Khoo Kheng-Hor, 2008:.5).
The use of ATM services are unsatisfactory to the customer's needs to be known by Bank BNI
Medan City in order to improve quality of service. Wong (2011: 58) states "customer swithched Because
they found a better product, another found a cheaper product, and left because of poor or little attention
from the firm". Based on the statement means, displacement customers save their money in a bank may
occur due to product quality is not good, high interest rates, lack of attention on the part of bank
management and the level of convenience provided by the bank in carrying out transactions which
include the provision of ATM with distribution Maximum location, functioning well and has a wide range
of service features that make it easily for customers to carry out banking transactions. So that customers
do not switch to a competitor bank, then the perceived quality of service that is provided to be more
superior than competitors.
Published by Asian Society of Business and Commerce Research
38
www.ijbcnet.com
International Journal of Business and Commerce
(ISSN: 2225-2436)
Vol. 5, No.07: [35-50]
Zeithaml research in Wiguno (2011: 77) suggests there are two levels of consumers' expectations
for service quality: the level of desired service and the level of service is adequate service. Desired service
is an expectation level that consumers expect to be accepted. Expectation in question is a combination of
what is believed to consumers may (can be) and should be delivered, while adequate service is the level
of service that will be accepted by consumers. Level of service is a minimum service that can be given a
company and still be expected to meet the basic needs of consumers.
Based on the problems and some of the statements above, if these conditions continue it would
result in even worse on customer confidence in the Bank BNI Medan City as well as to the loyalty of the
consumers remain willing to use the facility provided by the Bank, so that in the end in the worst
condition can occurs possibility that there will be displacement of Medan City BNI Bank customers to
another bank. So the authors are interested in doing research by taking the title of "Influence of Physical
evidence and Process Customer Satisfaction In Medan City BNI ATM Services".
2. FORMULATION OF THE PROBLEMS
Based on the background research and the identification of problems that have been described, it
can be formulated that problems in this study as follows:
Whether there is any influence Physical evidence against the Customer Satisfaction Level at Bank
BNI ATM Medan.
Whether there is any influence Process Customer Satisfaction towards the ATM BNI Medan City
Whether there is any influence of Physical evidence and Process together on the level Customer
Satisfaction at ATM BNI Medan
Research Purposes
In accordance with the formulation of the problem posed, the purpose of this research is:
To find out and to analyze the effect of Physical evidence on the level Customer satisfaction at
Bank BNI ATM Medan
To find out and to analyze the effect of Process to customer satisfaction at Bank BNI ATM
Medan.
To find out and to analyze the effect of Physical evidence and Process jointly to customer
satisfaction at Bank BNI ATM Medan.
Benefits Of Research
After the research objectives identified and obtained, the results can be used as follows:
1. Usefulness for Academic: serve as advice application of science and marketing management add
insight and knowledge, particularly in the case of Physical evidence and Process on customer
satisfaction
2. Usefulness for practitioners: provide input to Bank BNI Medan City in order to improve banking
services related to the use and utilization of ATM facilities and as consideration and contribute ideas
to the organizers of banking and other institutions which have same problems
Published by Asian Society of Business and Commerce Research
39
www.ijbcnet.com
International Journal of Business and Commerce
(ISSN: 2225-2436)
Vol. 5, No.07: [35-50]
3. LITERATURE REVIEW
Physical evidence
According to Zeithaml and Bitner (2006: 63) definition of physical evidence (physical
infrastructure) is a matter that also influence the consumer's decision to purchase and use the product and
services on offer. The elements included in the infrastructure include the physical environment, in this
case the physical buildings, equipment, supplies, logo, colors and other items held together with a service
that is given as a ticket, cover, label, and so forth. According Sucipto (2011: 70) physical evidence is the
physical environment in which services are delivered and where companies and consumers interact, and
each component of tangible facilitate the appearance or communication services. These elements are
indispensable in advancing the company, as this may affect the assessment of the customer's banking
services.
The elements that can affect the physical evidence are: a condition, completeness of facilities, and
convenience facilities.
Process
Process according to Zeithaml and Berry (2006: 18) "The actual procedures, mechanisms, and
flow of activities by the which the service is delivered -the service delivery and operating systems."
According Sucipto (2011: 71) This process reflects all elements of the marketing mix coordinated
services to ensure the quality and consistency of services provided to consumers. Thus, marketing must
be included when the design process is made as marketing services also often involved and responsible
for the supervision of the quality of services. Martutik (2010: 51) defines the process is very important in
a service organization, especially dalambauran services marketing, this is because a lot of customers who
often determine the decision of the election lies ease during the process, will, while or after using these
services.
The Process element is particularly in service businesses caused by the inventory can not be
stored, as submitted by Haksever, Render, Russel, and Murdick (2000: 39) states that the elements of the
Process is the activities, tasks, routins, mechanisms, schedules, and procedures.
Customer Satisfaction
Philip Kotler (2003: 70) provides a definition of customer satisfaction is the perceived level of a
state that is a result of comparing the appearance or the out come of products perceived in relation to one's
expectations. According Simamora (2003: 18), customer satisfaction is the result of the experience of the
product. It is a customer feeling after comparing the expectations (prepurchase expectation) with actual
performance.
According Dharmmesta and Irawan (2008: 37) factors that drive customer satisfaction is divided
into five parts, namely:
1. Product Quality
Consumers will feel satisfied after purchasing or using the product he had purchased turned out to be
an excellent product quality. For example, consumers will be satisfied with the meal were purchased
when the taste of the food tastes good, and no taste unpalatable, so customers will be very satisfied if
the quality of service ATM BNI Bank used its very satisfactory.
Published by Asian Society of Business and Commerce Research
40
www.ijbcnet.com
International Journal of Business and Commerce
(ISSN: 2225-2436)
Vol. 5, No.07: [35-50]
2. Price
For consumers who are sensitive, usually the low price is an important source of satisfaction because
they will get value for money is high, the price component is relatively unimportant for those who are
not price sensitive. Against the use of ATM services Bank BNI, some of the features in this ATM
usage costs.
3. Service Quality
Quality of care is defined in terms of the use of Bank BNI ATM service here is meeting the needs of
customers rate the level of convenience that can be provided by the ATM facilities.
4. Emotional Factors
This factor is relatively important because customer satisfaction arise at the time he was using this
service facility if the customer's emotional state to be very good or vice versa while after its use.
5. Easiness
Consumers will be more satisfied for a convenient and comfortable as well.
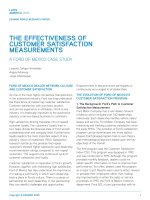
Framework
Physical Evidence
H1
Customer Satisfaction
H2
Process
H3
Figure 1. Conceptual Framework
Research Hypothesis
Based on the above framework, the hypothesis can be formulated as follows:
There is the influence of Physical evidence for Customer Satisfaction at Bank BNI ATM Medan.
There is the influence of Process for Customer Satisfaction at Bank BNI ATM Medan.
There is the influence of Physical evidence and Process jointly against Customer Satisfaction at
Bank BNI ATM Medan.
Published by Asian Society of Business and Commerce Research
41
www.ijbcnet.com
International Journal of Business and Commerce
(ISSN: 2225-2436)
Vol. 5, No.07: [35-50]
4. RESEARCH DESIGN
The method used in this research was descriptive survey method that built on descriptive and
explanatory survey method that built on research verification. Referring to the research objectives, the
nature of this research was descriptive and verification with the assumption that the method was most
relevant to analyze events that occurred by measuring indicators of research variables through statistical
parameters and measurement techniques, the research method used descriptive and explanatory survey
method.
Type of investigation was causality, because it will be tested causal relationship between
independent variables and the dependent variable. The unit of analysis in this study was the Customer
savings and deposito Bank BNI Medan in South Sumatera. Judging from the data collection time period
of this study was cross-sectional data retrieval directly, meaning that information from most of the
population from which the sample of this study were taken directly at any one time.
Subject matter under study was the perception of the phyical Evidence (ξ 1) and Process (ξ
independent variables, as well as Customer Satisfaction (η 1) as the dependent variable.
2)
as
The population in this study are all customers of Bank BNI ATM users Medan City, then there is
no exact number of the population. So in this study in which there are 3 variables would require a
minimum sample size of 200 respondents. Taking into account the presence of data outliers (Hair, 2006:
603) and the principle of the greater the sample size the better. So by using a ratio of 1:10, and by having
27 parameters then obtained a minimum sample size of:
n = number of parameters x 10
= 27 x 10 = 270 respondents
Based on the above calculation, obtained a minimum sample size in this study was 270 respondents.
To determine the 270 samples was done by simple random sampling technique. As described
above, the population of Bank BNI ATM user customers spread over 262 ATMs of Bank BNI Medan
City. To determine the minimum sample, do the following steps:
1. Bank BNI ATM determine the sample of a population of 262 ATM by using Slovin formula, as
follows (Sevilla, 1998; 49), namely: n = N / 1 + N (e) ², Di Where: N = population size, n = Sample
Units, e = Error are tolerated (10%), so that n = 262 / (1 + 262 (0:01) = 72, 37 or 73 ATM.
2. Specify a minimum sample of respondents at 73 ATM customers in this case the user at any ATM of
Bank BNI.
Published by Asian Society of Business and Commerce Research
42
www.ijbcnet.com
International Journal of Business and Commerce
(ISSN: 2225-2436)
Vol. 5, No.07: [35-50]
5. DISCUSSION
Table 1. Size of Conformity Model
Goodness of Fit
Statistics (GOF)
Expected size
Estimated results
Conclusion
Absolute Size Fit
GFI
RMSEA
GFI> 0.90
0, 93
Good Fit
RMSEA <0.08
0.07 5
Good Fit
Incremental Size Fit
NNFI
NNFI> 0.90
0.9 5
Good Fit
NFI> 0.90
0.9 5
Good Fit
AGFI> 0.90
0, 90
Good Fit
RFI
RFI> 0.90
0, 93
Good Fit
IFI
IFI> 0.90
0.9 7
Good Fit
CFI
CFI> 0.90
0, 97
Good Fit
NFI
AGFI
Note: Marginal Fit is the condition of the suitability of the measurement model under the criteria of
absolute size fit, as well as incremental fit, but still can be passed on further analysis, because it is close to
the criteria of good size fit (Hair, Andersen, Tatham, and Black, 2006: 623),
Source: Results of Treatment with LISREL 8.70
Based on Table 1 above, the overall size of suitability obtained has a suitability index model (good
fit) Thus, the analysis datadapat resumed at a later stage.
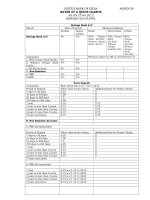
Figure 2. SEM Model (Standardized Model)
Published by Asian Society of Business and Commerce Research
43
www.ijbcnet.com
International Journal of Business and Commerce
(ISSN: 2225-2436)
Vol. 5, No.07: [35-50]
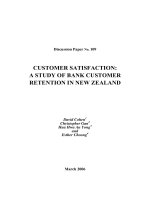
Figure 3. SEM Model (t-value model)
Based on Figure 2 and Figure 3 above, the calculation will be presented on the next test parameter
λ (loading factor / coefficient manifest) measurements on exogenous and endogenous models, where it
appears that all the manifest has Standardized Loading Factor (SLF) ≥ 0.5 and the value │t│≥1.96 (at α =
0.05) (Wijanto, 2008). Relating to the SLF, those that provide different criteria, namely Igbaria et al.
(1997), which suggests that the SLF with a value ≥ 0.50 can still be used, it can be said of all the manifest
forming latent variables (exogenous and endogenous) is significant, in other words it can be said that the
manifest-manifest meaningful and significant in shaping the latent variable, So that all manifest in this
study can be analyzed further, because it can form latent variables.
Table 2. Structural Equation Model
SATISFIE = 0.42*PHYSICAL + 0.31*PROCESS, Errorvar.= 0.31, R² = 0.69......(1)
(0.080)
(0.078)
(0.085)
5.17
3.94
7.19
(0.005)
85.35
Source: Results of processing LISREL 8.70
Published by Asian Society of Business and Commerce Research
44
www.ijbcnet.com
International Journal of Business and Commerce
(ISSN: 2225-2436)
Vol. 5, No.07: [35-50]
Table 3. Compliance Test Variables Structural Model
Structural equation
Endogenous Exogenous latent
latent
variables /
variables
Endogenous
Path coefficient
Standard t-Value Test results
(Standarized) /
Error (SE) t / F value (t> 1.96)
R2
Physical evidence
Customer Process
satisfaction
Physical evidence and
Process
0.42
0075
5. 17
Significant
0. 31
0087
3.94
Significant
0. 69
0.004 6
85.35
Significant
Source: Results of processing LISREL 8.70
Based on the above tables, it can be seen that the influence of Physical evidence to the satisfaction
of our customers has a value of t = 5.17 is greater than 1.96 (5.17> 1.96) so it can be said to be significant.
It can be concluded that the effect of exogenous latent variables Physical evidence against endogenous
latent variables Customer satisfaction is significant. Then the influence of the Process to the satisfaction
of the customer has a value of t = 3.94 is greater than 1.96 (3.94> 1.96) adalahsignifikan, so it can be
concluded that the effect of exogenous latent variables Process against endogenous latent variables
Customer satisfaction is exhibited significantly.
As for the influence of Physical evidence and Process jointly towards customer satisfaction, can
be seen in the structural equation 1 below, it has a value of F count = 85.35 is greater than 3.84 (85.35>
3.84) were significant. It can be concluded that the influence of Physical evidence and Process jointly to
the satisfaction of customers is significant.
The following will be discussing hypotheses one by one based on the details contained in Table 4
below.
Table 4. Effect of Physical evidence and Process Variables on customer satisfaction
Hypothesis
H1
Variables
Physical evidence customer satisfaction
H2
Process customer satisfaction
H3
Physical evidence and Process Employee
customer satisfaction
Standardize
Coeficient / R
0.4 2
0. 31
0. 69
2
t-value /
F-value
Conclusion
Statistics
5. 17
H 0 is
rejected; H a
accepted
3.94
H 0 is
rejected; H a
accepted
85.35
H 0 is
rejected; H a
accepted
Source: Results of Treatment with LISREL 8.70
Published by Asian Society of Business and Commerce Research
45
www.ijbcnet.com
International Journal of Business and Commerce
(ISSN: 2225-2436)
Vol. 5, No.07: [35-50]
Hypothesis 1 (H1):
Based on Table 4 and structural equation 1 above, Physical evidence shows that the effect on
customer satisfaction with the contribution of (0.42 x 0:42 x 100%), or 17.64% and the value of t (5:17>
1.96), then the unity hypothesis (H1) is accepted / proven, Physical evidence thus partially proved
significant effect on customer satisfaction. This indicates that the physical evidence, especially in the
completeness of the element means (X2) that had been prepared well then can directly increase customer
satisfaction, especially in terms of Price (Y2).
Hypothesis 2 (H2):
Based on Table 4 and structural equation 1 above, it appears that the influence of Process on
customer satisfaction with the contribution of (0.31 x 0:31 x 100%) or 9.61% and the value of t (3.94>
1.96), then the second hypothesis (H2) accepted / proven, Thus Process partially proved significant effect
on customer satisfaction. This shows that customer satisfaction especially on the elements Price (Y2) will
increase if the College of implementing Process management particularly on the operational schedule
(X5) and the mechanism (X6).
Hypothesis 3 (H3):
Based on structural equation 4and Table 1 above, it appears that the Physical evidence and
Process jointly have a determinant coefficient of 0.69 and the calculated F value of 85.35 is greater than 3.84
(85.35> 3.84), the third hypothesis (H3) received / proven. So Physical evidence and Process together
proven significant effect on customer satisfaction with the contribution of 69% while the remaining 31%
is the influence of other factors. This shows that customer satisfaction especially on the elements Price
(Y2) will increase if the Bank BNI Medan City able to increase Physical evidence mainly on the
completeness element means (X2) and is able to improve the process, especially at the operational
schedule (X5) and the mechanism (X6).However partially Physical evidence is the most dominant factor
in the effect on customer satisfaction.
Based on the description above hypothesis testing results, the findings of this study is that
satisfaction nasabahakan meningkatterutama the price element (Y2) when Bank BNI Medan City able to
improve the physical evidence, especially in terms of completeness means (X2) and is able to improve the
process, especially on the elements of the operational schedule (X5) and the mechanism (X6).
6. CONCLUSION
Physical evidence has significant positive effect on customer satisfaction with influences of 0.42
or with a direct contribution amounting to 17.64%, h al have demonstrated that an increase in
physical evidence, especially in terms of completeness means it can directly increase customer
satisfactions like.
Process has positive and significant impact on customer satisfaction with the effect of 0.31 or
with a direct contribution of 9.61 %, these shows that the increase in process especially in
operational schedules and mechanisms of processes in ATM BNI Medan will be able to increase
customer satisfactions.
Physical evidence and Process jointly positive and significant impact on customer satisfaction
with a contribution of 69 %, while the remaining 31 % are influenced by other factors beyond the
Published by Asian Society of Business and Commerce Research
46
www.ijbcnet.com
International Journal of Business and Commerce
(ISSN: 2225-2436)
Vol. 5, No.07: [35-50]
variables physical evidence and process. This shows that the customer satisfaction primarily on
price will increase if management Medan BNI is able to increase the physical evidence mainly on
the completeness of the elements of ATM facilities and process, especially in terms of operational
schedules and mechanisms of the process. Physical evidence is partially the most dominant
variable in giving effect to the customer satisfaction at ATM BNI Medan City with effect of 0.42.
Empirical Implications
Based on the research results described in the previous chapter, the empirical implication is that
customer satisfaction at the ATM Medan City will rise / high, especially on the elements of price (Y2)
when the ATM BNI Medan City able to improve the physical evidence, especially in terms of
completeness means (X2 ) and process the ATM Medan City especially on the elements of the operational
schedule (X5) and the mechanism (X6).
Managerial Implications
ATM BNI Medan City generally perceived respondents have had physical evidence has been
relatively good, so as to provide good service to its customers. However there are still some
elements of physical evidence that must be considered and enhanced by management of Bank
BNI Medan City as the indicator of parking facilities ATM BNI Medan recommended that a
more adequate / widely, ATM equipment Medan BNI should advisable to use sophisticated and
modern equipment, as well as indoor ATM BNI Medan suggested must always clean and
fragrant.
Process at ATM BNI Medan generally perceived respondents already relatively good, so as to
provide comfort for the customers of Bank BNI ATM Medan in the transaction. However there
are still some elements process that must be considered and enhanced by management of Bank
BNI Medan as the indicator level of use of ATM BNI Medan suggested it should be easier, ATM
operational time Medan BNI Bank suggested should better meet the appropriate needs of
customers, and the level service procedures in conducting a transaction at ATM BNI Medan
according to customers' requirements.
Customer satisfaction at ATM BNI Medan respondents generally perceived to have had
relatively high of satisfaction, so it is able to support its customers to always use ATM facilities
Bank Medan BNI. However there are still some elements customer satisfaction that must be
considered and enhanced by management of Bank BNI Medan City as the indicators of quality of
service ATM Medan to be further improved, customer satisfaction recommends using Medan
City BNI ATM, ATM BNI Medan should be an option The first in the transaction, and
satisfaction with the routine costs incurred for transactions conducted at the ATM.
More suggestions for Researchers
There are many other factors that affect customer satisfaction at ATM BNI Medan such as
promotions, customers relationship, ATM brand image, so as to further research if the variable
input will likely produce different findings.
Variables used in this study only uses two independent variables (physical evidence and process)
direct influence on customer satisfaction at Bank BNI ATM Medan, then to study further
recommended to include intervening variables such as customer confidence that the results will
likely be different.
Published by Asian Society of Business and Commerce Research
47
www.ijbcnet.com
International Journal of Business and Commerce
(ISSN: 2225-2436)
Vol. 5, No.07: [35-50]
This research only limited conducted on customers of Bank BNI ATM Medan, but not involve
yet the customer in the other branch office than the office of BNI in Medan.
In this study the variables studied are physical evidence, process, and satisfaction from the of
Bank BNI customers perpective. But not yet enter perspective from another bank customer who
uses the ATM Link Bank BNI Medan so that research results will likely be different
The results could also be applied to Bank ATM other, both government-owned banks and private
and also can expanded on a certain region.
Published by Asian Society of Business and Commerce Research
48
www.ijbcnet.com
International Journal of Business and Commerce
(ISSN: 2225-2436)
Vol. 5, No.07: [35-50]
REFERENCES
[1]. Afshar Asghar et. al. 2011. Study the Effects of Customer Service and Product Quality on
Customer Satisfaction and Loyalty, International Journal of Humanities and Social Science Vol.
1 No. 7.
[2]. Alan Fyall, Brian Garrod. 2005. Tourism Marketing A Collaborative Approach. Aspects of
Tourism: 18. Printed and bound in Great Britain by the Cromwell Press.
[3]. Alma, Buchari. 2008. Pemasaran Stratejik Jasa Pendidikan. Bandung : CV. Alfabeta
[4]. Arens, W.F., Weigold, M.F., & Arens, C. 2009. Contemporary Advertising. Singapore : Mc Graw
Hill.
[5]. Arikunto, Suharsimi. 2002. Prosedur Penelitian Suatu Pendekatan Praktik. Jakarta: PT. Rineka
Cipta.
[6]. Aritonang, R. L. 2005. Pemasaran Jasa dan Kualitas Pelayanan, Bayumedia Publishing,
Malang.
[7]. Assauri, Sofyan. 2007. Manajemen Pemasaran: Dasar, Konsep dan Strategi, Jakarta Utara: CV.
Rajawali.
[8]. Booms BH., and Bitner MJ, 2001. Marketing Strategies and Organization Structure for Service
Firms. In Donnelly JH, George WR. (Eds), Marketing of Services, Conference Proceedings:
American Marke
[9]. Dharmmesta, B.S dan Irawan. 2008. Manajemen Pemasaran Modern, Yogyakarta, Penerbit
Liberty.
[10]. Gandhi, S. & Kang L. S. 2012 ‘Customer Satisfaction, its Antecedents and Linkage between
Employee Satisfaction and Customer satisfaction’. A Study: Asian Journal of Business &
Management Sciences 1 (1) 129-137
[11]. Hair, Joseph F., Jr,. Rolph E. Andersen, Ronald L. Tatham, dan William C. Black. 2006.
Multivariate Data Analysis, Englewood Clift, NJ : Prentice Hall
[12]. Haksever, Render, Russel, dan Mudrick. 2000. Market Driven Strategies Process for Creating
Values, New York: The Free Press.
[13]. Kerlinger, Fred and Howard Lee, 2000.
International Thomson Publishing.
Foundations of Behavioral Research New York:
[14]. Khuzaini. 2012. The Effect Analysis Of Saving And Service Quality Toward Customer
Satisfaction And Loyalty At Bank Jatim. International Conference On Management (2nd ICM
2012) Proceeding
[15]. Kotler, Philip. 2003. Marketing management. 11th Edition/International Edition.New Jersey.
Prentice Hall.
[16]. Kotler, Philip. Amstrong. 2004. Principle of Marketing. Prentice Hall International Inc. A
Division of Simon & Scuster, Englewood Cliffs, Nj07632.
[17]. Kotler, Philip. Keller, Kevin Lane. 2009. Manajemen Pemasaran Edisi 13 Jilid 1. Jakarta :
Penerbit Erlangga
[18]. Lovelock, C. 2002. Marketing Management. Engelwood Cliffs. New Jersey. Prentice-Hall, Inc
[19]. Lupiyoadi, R. & Hamdani, A. 2006. Manajemen Pemasaran Jasa. Jakarta. Salemba Empat
[20]. Martutik, Tri Anik 2010. Pengaruh Bauran Pemasaran Terhadap Keputusan Konsumen Pengguna
Jasa Catering pada PT. Sonokembang Wahana Jaya.
Published by Asian Society of Business and Commerce Research
49
www.ijbcnet.com
International Journal of Business and Commerce
(ISSN: 2225-2436)
Vol. 5, No.07: [35-50]
[21]. Mittal, Vikas and Wagner A. Kamakura. 2001. Satisfaction, Repurchase Intent, and Repurchase
Behavior: Investigating the Moderating Effect of Customer Characteristics, Journal of Marketing
Research, 38, 131-142.
[22]. Mohammad, Anber Abraheem Shlash and Alhamadani Shireen Yaseen Mohammad Yaseen
Mohammad Alhamadani. 2011. Service quality perspectives and customer satisfaction in
commercial banks working in Jordan”, Middle Eastern Finance and Economics, Issue 14,PP: 6072.
[23]. Musanto, Trisno. 2004. Faktor-faktor Kepuasan Pelanggan dan Loyalitas Pelanggan:Studi Kasus
pada CV. Media Advertising Surabaya. Jurnal Manajemen dan Kewirausahaan, Vol. 6. pp. 123136.
[24]. Parasuraman, Zeithaml, And Berry. 2006. Cunsomer Behavior, and Marketing Strategy. New
York: The Free Press A Division of Macmillan Inc.
[25]. Riyaz Ahmad Rainayee, Rouf Ahmad Mir, and Arfat Ahmad. 2013. 3P’s influencing Customer
Satisfaction in Retail Banking: An empirical study. International Journal Of Scientific Research,
Volume : 2, Issue : 5, ISSN No 2277 - 8179
[26]. Sentana, A. 2006. Excellent Service & Customer Satisfaction. Edisi Terjemahan. Jakarta: Elex
Media Komputindo.
[27]. Simamora, Bilson. 2003. Memenangkan Pasar dengan Pemasaran Efektif dan Profitabel. Jakarta:
Gramedia Pustaka Utama.
[28]. Sucipto,A. 2011. Studi Kelayakan Bisnis.Malang: UINMALIKIPRES.
[29]. Sugiyono. 2010. Statistika untuk Penelitian, Bandung : Alfabeta.
[30]. Sunny Goh T.H & Khoo Kheng-Hor. 2008. Marketing Wise. Jakarta: PT Bhuana Ilmu Populer.
[31]. Suyanto, M. 2007. Marketing Strategy Top Brand Indonesia. Yogyakarta: Andi Offset.
[32]. Tjiptono, Fandy. 2004. Manajemen Pemasaran Jasa. Bayumedia, Malang.
[33]. Wiguno, Clara K. 2011. Service Delivery Strategy for Internal IT Service. 3rd International
Conference on Information and Financial Engineering, IPEDR vol. 12. Singapore.
[34]. Wijanto. 2008. Sructural Equation Modeling dengan Lisrel 8.8. Jakarta, Pasca Sarjana Ilmu
Manajemen Fakultas Ekonomi UI.
[35]. Wong, A. 2011. Service quality and customer loyalty perspectives on two levels of retail
relationships. Journal of Services Marketing, 17(5), 495 - 513.
[36]. Yazid. 2003. Pemasaran Jasa Konsep dan Implementasi, Edisi Kedua, Yogyakarta: Ekonesia.
[37]. Zeithaml,A.,Valarie,A.,Mary Joe Bitner. 2006. Service Marketing: Integrating Customer Focus
The Firm. USA. Mc-Graw-Hill.
Published by Asian Society of Business and Commerce Research
50