Data collection algorithms in wireless sensor networks employing compressive sensing
Bạn đang xem bản rút gọn của tài liệu. Xem và tải ngay bản đầy đủ của tài liệu tại đây (4.19 MB, 192 trang )
DATA COLLECTION ALGORITHMS IN WIRELESS SENSOR
NETWORKS EMPLOYING COMPRESSIVE SENSING
By
MINH TUAN NGUYEN
Bachelor of Electrical Engineering
University of Transport and Communications
Hanoi, Vietnam
2001
Master of Electrical Engineering
Military Technical Academy
Hanoi, Vietnam
2007
Submitted to the Faculty of the
Graduate College of
Oklahoma State University
in partial fulfillment of
the requirements for
the Degree of
DOCTOR OF PHILOSOPHY
December, 2015
c
COPYRIGHT ⃝
By
MINH TUAN NGUYEN
December, 2015
DATA COLLECTION ALGORITHMS IN WIRELESS SENSOR
NETWORKS EMPLOYING COMPRESSIVE SENSING
Dissertation Approved:
Dr. Keith A. Teague
Dissertation Advisor
Committee Member: Dr. George Scheets
Committee Member: Dr. Qi Cheng
Committee Member: Dr. Johnson Thomas
Dr. Sheryl Tucker
Dean of the Graduate College
iii
ACKNOWLEDGMENTS
Firstly, I would like to express my sincere gratitude to my advisor Prof. Keith
A. Teague for the continuous support of my Ph.D study and related research, for
his patience, motivation, and immense knowledge. His guidance helped me in all the
time of research and writing of this thesis. I could not have imagined having a better
advisor and mentor for my Ph.D study. I also would like to thank his wife, Mrs.
Sherry Teague for everything she did for my family and myself. Thank you both very
much for helping our colleagues from TNUT to visit OSU.
Besides my advisor, I would like to thank the rest of my thesis committee: Prof.
George Scheets, Prof. Qi Cheng from School of Electrical and Computer Engineering
and Prof. Johnson Thomas from Computer Science department for their insightful
comments and encouragement, but also for the hard question which incented me to
widen my research from various perspectives.
I also would like to thank some professors from Electrical and Computer engineering (ECE), Dr. Martin Hagan, Dr. James West, Dr. Guoliang Fan and Dr. Weihua
Sheng for their classes and their knowledge they shared with me. I really appreciate
that.
Being far away from my home country and my institute has been given me a big
gap of culture. I would like to thank the department staffs, Hellen Daggs, Brian
Ritthaler, especially Lory Ferguson for being supportive all the time.
I thank my fellow labmates, Ali Talari, Behzad Shahrasbi, Sheng Wang from CWN
lab for the stimulating discussions, for the tough time we were working together, and
for all the fun we have had in the last few years.
iv
My sincere thanks to all my Vietnamese families and friends here in Stillwater,
Oklahoma. ”chu Xuong”, ”chu Loi”, ”chu Nho”, ”em Dinh”, ”em Loan”, Ha Do, Son
Bui, Hung La, Hoa Nguyen, etc. You all have made us the second family here in the
US. I am grateful to the Vietnamese Student Association (VSA) with useful activities
that brought us, our Vietnamese students at OSU close together.
Last but not the least, I would like to thank my little family, Ally Nguyen, Hang
Nguyen and Thuong Nguyen for being with me, going together through tough time
and enjoying happiness together. Without you, I would not have done this far with
effort and succeed. I am very grateful to my big family, my parents, my brother, my
nephew and niece for supporting me spiritually throughout writing this dissertation
and my life in general. I would like to thank the big family in Ha Noi, especially
grandpa Khien Trong Nguyen, for being supportive me while I was preparing to
study abroad.
Thank you all very much!!! Thanks the others I did not list their names here.
Five years generally may not be considered as a long time, but for me, we do not
have many this five years in our lives. So, it is precious. Thanks Stillwater, the very
peaceful land and suitable for studying. I may not see You again but I appreciate
every moment here in Oklahoma, USA. Thank You!
v
TABLE OF CONTENTS
Chapter
Page
1 INTRODUCTION
1
2 BACKGROUND AND LITERATURE REVIEW
3
2.1
2.2
2.3
Wireless Sensor Network Overview . . . . . . . . . . . . . . . . . . .
3
2.1.1
Introduction . . . . . . . . . . . . . . . . . . . . . . . . . . . .
3
2.1.2
Challenges for Data Collection Method Design in WSNs . . .
4
2.1.3
Data Collection Method Protocols in WSNs . . . . . . . . . .
7
Introduction to Compressive Sensing . . . . . . . . . . . . . . . . . .
31
2.2.1
Introduction . . . . . . . . . . . . . . . . . . . . . . . . . . . .
31
2.2.2
Vector Spaces . . . . . . . . . . . . . . . . . . . . . . . . . . .
32
2.2.3
Sensing Matrices . . . . . . . . . . . . . . . . . . . . . . . . .
35
2.2.4
Signal Recovery . . . . . . . . . . . . . . . . . . . . . . . . . .
41
Literature Review . . . . . . . . . . . . . . . . . . . . . . . . . . . . .
45
2.3.1
CS Based Data Collection Algorithm in WSNs . . . . . . . . .
46
2.3.2
Minimizing the Number of CS Measurements
51
. . . . . . . . .
3 RANDOM WALK BASED DATA GATHERING IN WIRELESS
SENSOR NETWORKS
53
3.1
Introduction . . . . . . . . . . . . . . . . . . . . . . . . . . . . . . . .
53
3.1.1
Motivation . . . . . . . . . . . . . . . . . . . . . . . . . . . . .
53
3.1.2
Related Work . . . . . . . . . . . . . . . . . . . . . . . . . . .
55
Background and Problem Formulation . . . . . . . . . . . . . . . . .
57
3.2
vi
3.3
3.2.1
Random Walk . . . . . . . . . . . . . . . . . . . . . . . . . . .
57
3.2.2
Problem Formulation . . . . . . . . . . . . . . . . . . . . . . .
58
Compressive Sensing Based Random Walk Data Collection Algorithm
(CSR) . . . . . . . . . . . . . . . . . . . . . . . . . . . . . . . . . . .
60
3.3.1
System Model . . . . . . . . . . . . . . . . . . . . . . . . . . .
60
3.3.2
The CSR Algorithm . . . . . . . . . . . . . . . . . . . . . . .
60
3.3.3
Analysis of the Measurement Matrix: CS Recovery Performance and Network Coverage . . . . . . . . . . . . . . . . . .
3.3.4
Analysis of the Trade-off between the Transmission Range and
the Random Walk Length . . . . . . . . . . . . . . . . . . . .
3.4
3.5
3.6
62
63
Directly Forwarding the CS Measurements to the Base-station (D-CSR) 63
3.4.1
Network Model . . . . . . . . . . . . . . . . . . . . . . . . . .
63
3.4.2
D-CSR Power Consumption Analysis . . . . . . . . . . . . . .
64
3.4.3
D-CSR Simulation Results . . . . . . . . . . . . . . . . . . . .
68
Multi-hop Relaying Data from Random Walks to the Base-station (MCSR) . . . . . . . . . . . . . . . . . . . . . . . . . . . . . . . . . . . .
73
3.5.1
Network Model . . . . . . . . . . . . . . . . . . . . . . . . . .
73
3.5.2
Multi-hop Relaying Data Algorithm . . . . . . . . . . . . . . .
73
3.5.3
M-CSR Power Consumption Analysis . . . . . . . . . . . . . .
75
3.5.4
M-CSR Simulation Results . . . . . . . . . . . . . . . . . . . .
77
Conclusion and Future Work . . . . . . . . . . . . . . . . . . . . . . .
79
4 CLUSTER BASED DATA COLLECTION IN WIRELESS SENSOR
NETWORKS
81
4.1
Introduction . . . . . . . . . . . . . . . . . . . . . . . . . . . . . . . .
81
4.1.1
Motivation . . . . . . . . . . . . . . . . . . . . . . . . . . . . .
81
4.1.2
Related work . . . . . . . . . . . . . . . . . . . . . . . . . . .
83
Problem Formulation . . . . . . . . . . . . . . . . . . . . . . . . . . .
86
4.2
vii
4.2.1
System Model . . . . . . . . . . . . . . . . . . . . . . . . . . .
86
4.2.2
Block Diagonal Matrices . . . . . . . . . . . . . . . . . . . . .
87
4.2.3
Problem Formulation . . . . . . . . . . . . . . . . . . . . . . .
88
4.3
CCS: Cluster-Based Compressive Sensing for Data Collection in WSNs 88
4.4
Directly Send CS Measurements to the BS (DCCS) . . . . . . . . . .
92
4.4.1
Network Model . . . . . . . . . . . . . . . . . . . . . . . . . .
92
4.4.2
Power Consumption Analysis for DCCS
. . . . . . . . . . . .
92
4.4.3
Simulation Results for DCCS . . . . . . . . . . . . . . . . . .
95
4.5
4.6
4.7
Inter-cluster Multi-hop Routing in CCS (ICCS) . . . . . . . . . . . . 104
4.5.1
Network Model . . . . . . . . . . . . . . . . . . . . . . . . . . 106
4.5.2
ICCS Power Consumption Analysis . . . . . . . . . . . . . . . 108
4.5.3
ICCS Simulation Results . . . . . . . . . . . . . . . . . . . . . 110
DCT Compression Transmitting only k Large Coefficients . . . . . . . 112
4.6.1
Network Model . . . . . . . . . . . . . . . . . . . . . . . . . . 114
4.6.2
Communication Power Consumption . . . . . . . . . . . . . . 114
4.6.3
Simulation Results . . . . . . . . . . . . . . . . . . . . . . . . 115
Conclusion . . . . . . . . . . . . . . . . . . . . . . . . . . . . . . . . . 120
5 TREE-BASED DATA GATHERING IN WIRELESS SENSOR NETWORKS
5.1
5.2
5.3
122
Introduction . . . . . . . . . . . . . . . . . . . . . . . . . . . . . . . . 122
5.1.1
Motivation . . . . . . . . . . . . . . . . . . . . . . . . . . . . . 122
5.1.2
Related Work . . . . . . . . . . . . . . . . . . . . . . . . . . . 124
Problem Formulation . . . . . . . . . . . . . . . . . . . . . . . . . . . 127
5.2.1
Network Model . . . . . . . . . . . . . . . . . . . . . . . . . . 127
5.2.2
Tree-base Energy-Efficient Data Gathering (TCS) . . . . . . . 127
5.2.3
Power Consumption Analysis . . . . . . . . . . . . . . . . . . 129
Simulation Results . . . . . . . . . . . . . . . . . . . . . . . . . . . . 131
viii
5.4
5.3.1
Lattice Network . . . . . . . . . . . . . . . . . . . . . . . . . . 131
5.3.2
Arbitrary Network . . . . . . . . . . . . . . . . . . . . . . . . 131
Conclusions and Future Work . . . . . . . . . . . . . . . . . . . . . . 137
6 NEIGHBORHOOD BASED DATA COLLECTION IN WIRELESS
SENSOR NETWORKS
138
6.1
Introduction . . . . . . . . . . . . . . . . . . . . . . . . . . . . . . . . 138
6.2
Problem Formulation . . . . . . . . . . . . . . . . . . . . . . . . . . . 138
6.2.1
Network Model . . . . . . . . . . . . . . . . . . . . . . . . . . 138
6.2.2
Neighborhood Based Data Collection Algorithm (NeiCS) . . . 139
6.2.3
Power Consumption Analysis . . . . . . . . . . . . . . . . . . 141
6.3
Simulation Results . . . . . . . . . . . . . . . . . . . . . . . . . . . . 146
6.4
Conclusion and Future Work . . . . . . . . . . . . . . . . . . . . . . . 151
7 CONCLUSIONS
152
BIBLIOGRAPHY
154
A RANDOM WALK BASED DATA GATHERING IN WIRELESS
SENSOR NETWORKS
174
A.1 Additional Analysis for D-CSR to calculate EdtoBS in order to compare
with M-CSR . . . . . . . . . . . . . . . . . . . . . . . . . . . . . . . . 174
ix
LIST OF TABLES
Table
4.1
Page
Comparison between the existing data collection methods and CCS .
x
85
LIST OF FIGURES
Figure
Page
2.1
K-means clustering algorithm with k = 10 clusters . . . . . . . . . . .
9
2.2
EEHC algorithm with single level of clustering . . . . . . . . . . . . .
12
2.3
FLOC program consists of 6 actions . . . . . . . . . . . . . . . . . . .
13
2.4
Unequal size clusters in EEUC clustering algorithm . . . . . . . . . .
15
2.5
Packet transmission and global transmission schedule on location-aware
in PEACH . . . . . . . . . . . . . . . . . . . . . . . . . . . . . . . . .
16
2.6
Cluster structure of a network with MRPUC . . . . . . . . . . . . . .
17
2.7
S-Web clustering algorithm . . . . . . . . . . . . . . . . . . . . . . . .
18
2.8
HEECH divides WSN into six tracks with the same width . . . . . .
19
2.9
An illustration of Directed Diffusion in WSN . . . . . . . . . . . . . .
22
2.10 State transitions in GAF . . . . . . . . . . . . . . . . . . . . . . . . .
28
2.11 Some common normed vectors . . . . . . . . . . . . . . . . . . . . . .
34
2.12 Random projection matrix . . . . . . . . . . . . . . . . . . . . . . . .
36
2.13 Restricted Isometric Constant Function . . . . . . . . . . . . . . . . .
39
2.14 Sparsifying signals in a proper domain with ψ matrix . . . . . . . . .
40
2.15 Compare four Compressive Sensing reconstruction schemes . . . . . .
46
3.1
Illustration of a simple RW routing in a WSN with 8 nodes and the
projection matrix created from each RW. . . . . . . . . . . . . . . . .
59
3.2
Sensor neighborhoods defined by the sensor transmission range R . .
64
3.3
An illustration of RWs collecting data when BS at the center . . . . .
66
3.4
RWs collecting data when the BS is outside the sensing area at (Li , L2 ). 67
xi
3.5
The average number of neighbors of each sensor when changing the
sensor transmission range R . . . . . . . . . . . . . . . . . . . . . . .
68
3.6
The mixing time reduces as the sensor transmission range R increases
69
3.7
Sampling coverage the network with different number of random walks
length 48 (τ = 48) . . . . . . . . . . . . . . . . . . . . . . . . . . . .
3.8
The average square distance (E[d2toBS ]) between RWs and the BS at
different positions Li ≥ 0.5L up to Li = 5L . . . . . . . . . . . . . . .
3.9
70
70
Total power consumption of the network versus sensor transmission
ranges when BS at the center of the sensing area
. . . . . . . . . . .
71
3.10 Comparison between the full dense Gaussian and the sparse binary
matrix collected different number of RWs: random walk length τ = 48
with different number of measurements . . . . . . . . . . . . . . . . .
72
3.11 Total power consumption through all data collection processes with
M = 90 measurements, transmission range R* = 14 in different RW’s
lengths when the BS at the center of the sensing area . . . . . . . . .
72
3.12 Tree-based relaying measurements after each RW to the base-station
formed with 500 nodes and transmission range R = 14. . . . . . . . .
75
3.13 Total number of hops from all sensor nodes to the BS as we increase
the transmission range R . . . . . . . . . . . . . . . . . . . . . . . . .
77
3.14 The total power consumption applied M-CSR versus different transmission ranges R when BS at the center; R* = 12 . . . . . . . . . . .
78
3.15 Compare the total power consumption in two random walk routing
method when BS at the center and R = 14. . . . . . . . . . . . . . .
4.1
79
Average reconstruction error versus the fraction of the measurements
collected from the first cluster (T = M1 /M ). The error is minimize
when T is equal to the fraction of the nodes in the first cluster (N1 /N =
0.7). . . . . . . . . . . . . . . . . . . . . . . . . . . . . . . . . . . . .
xii
91
4.2
A clustered WSN with BS outside the sensing area (Li > L). . . . . .
4.3
Histogram of number of sensors in each cluster for K-means and LEACH. 96
4.4
Number of measurements required to satisfy target error = 0.1 for a
100-sparse signal (sparse in canonical basis). . . . . . . . . . . . . . .
4.5
94
97
Total power consumption when BS at the center of the sensing area.
Here, Nc∗ = 14. . . . . . . . . . . . . . . . . . . . . . . . . . . . . . .
98
4.6
Total power consumption when BS at 1L (Li = L). Here, Nc∗ = 9. . .
99
4.7
Total power consumption when BS at 2L (Li = 2L). Here, Nc∗ = 4. .
99
4.8
Total power consumption when BS at 3L (Li = 3L). Here, Nc∗ = 2. . 100
4.9
Number of measurements required when Wavelet is considered as the
sparsifying basis. . . . . . . . . . . . . . . . . . . . . . . . . . . . . . 101
4.10 Total power consumption when the BS is at the center of the sensing
area. Here, Nc∗ = 18. . . . . . . . . . . . . . . . . . . . . . . . . . . . 101
4.11 Total power consumption when Li = L. Here, Nc∗ = 12. . . . . . . . . 102
4.12 Total power consumption when Li = 3L. Here, Nc∗ = 2 or 3 (depending on the clustering scheme). . . . . . . . . . . . . . . . . . . . . . . 102
4.13 Total power consumption when Li = 5 × L. Here, Nc∗ = 2. . . . . . . 103
4.14 Number of measurements required when DCT is considered as the
sparsifying basis. . . . . . . . . . . . . . . . . . . . . . . . . . . . . . 103
4.15 Total power consumption when the BS at the center of the sensing area.104
4.16 Total power consumption when the BS outside the sensing area at
Li = 3L. . . . . . . . . . . . . . . . . . . . . . . . . . . . . . . . . . . 105
4.17 All transmissions in the clustered network with inter-cluster multi-hop
routing when the BS at the center. . . . . . . . . . . . . . . . . . . . 105
4.18 Total number of hops routing when changing the broadcasting radius R 110
4.19 The total power consumption when change the broadcast radius R
xiii
. 111
4.20 Intra-cluster power consumption when BS at the center in a circle
sensing area . . . . . . . . . . . . . . . . . . . . . . . . . . . . . . . . 112
4.21 Inter-cluster power consumption when BS at the center in a circular
sensing area . . . . . . . . . . . . . . . . . . . . . . . . . . . . . . . . 113
4.22 Total power consumption for ICCS and DCCS in a circular area network with R0 = 50 . . . . . . . . . . . . . . . . . . . . . . . . . . . . 113
4.23 Unsorted sensory readings from 2000 sensors and the DCT transformed
coefficients . . . . . . . . . . . . . . . . . . . . . . . . . . . . . . . . . 116
4.24 Descending sorted readings from 2000 sensors and the DCT transformed coefficients . . . . . . . . . . . . . . . . . . . . . . . . . . . . 117
4.25 Reconstruction error versus number of measurements with different of
clusters
. . . . . . . . . . . . . . . . . . . . . . . . . . . . . . . . . . 118
4.26 Reconstruction error versus number of clusters with different of measurements . . . . . . . . . . . . . . . . . . . . . . . . . . . . . . . . . 118
4.27 CS reconstruction error versus measurements with noise . . . . . . . . 119
4.28 DCT compression reconstruction error versus measurements with noise
and noiseless . . . . . . . . . . . . . . . . . . . . . . . . . . . . . . . . 119
5.1
An example of a tree formed by MTT algorithm with 1000 nodes deployed in a arbitrary network when BS at the center
. . . . . . . . . 123
5.2
A simple example illustrates TCS algorithm with 8 sensors . . . . . . 127
5.3
Compare total numbers of transmissions between three algorithms in
different lattice topology networks
5.4
Total energy consumption in arbitrary networks with different numbers
of nodes with M = 500, p = 1/3
5.5
. . . . . . . . . . . . . . . . . . . 132
. . . . . . . . . . . . . . . . . . . . 133
The reduction ratio of power consumption of TCS over MTT in arbitrary networks versus the various number of sensors(M = 500, p =
1/3) . . . . . . . . . . . . . . . . . . . . . . . . . . . . . . . . . . . . 134
xiv
5.6
Total number of transmission hops in various transmission range (N =
2000; M = 500; p = 1/3) . . . . . . . . . . . . . . . . . . . . . . . . . 134
5.7
Power consumption affected by increasing transmission range (N =
2000; M = 500; p = 1/3) . . . . . . . . . . . . . . . . . . . . . . . . . 135
5.8
Power consumption reduced with sparser projection matrices in both
MTT and TCS in arbitrary networks (N = 2000; M = 500) . . . . . . 136
5.9
CS reconstruction error when reducing the probability of non-zero elements in sparse measurement matrices . . . . . . . . . . . . . . . . . 136
6.1
M random neighborhoods are sampled in an arbitrary network with
500 sensors; transmission range R = 9 defines N neighborhoods in the
graph G(V, E). . . . . . . . . . . . . . . . . . . . . . . . . . . . . . . 140
6.2
Tree formed by the greedy algorithm with 500 nodes and transmission
range R = 14 to relay measurements from random sensors to the BS.
6.3
144
Comparison between full Gaussian measurement matrix and the one
created by NeiCS . . . . . . . . . . . . . . . . . . . . . . . . . . . . . 147
6.4
Total power consumption within difference number of neighborhoods;
N = 500, R0 = 50 and R = 9. . . . . . . . . . . . . . . . . . . . . . . 147
6.5
Total consumption transmits M measurements directly to the BS; N =
500, R0 = 50 and R = 9.
6.6
. . . . . . . . . . . . . . . . . . . . . . . . 148
Total power consumption when NeiCS transmits measurements directly to the BS; N = 500, R0 = 50 and R = 9. . . . . . . . . . . . . 149
6.7
Total power consumption to relay multi-hop M measurements through
intermediate nodes to the BS; N = 500, R0 = 50 and R = 9. . . . . . 149
6.8
Total power consumption to relay multi-hop M = 100 measurements
through intermediate nodes to the BS with different transmission ranges;
N = 500, R0 = 50. . . . . . . . . . . . . . . . . . . . . . . . . . . . . 150
xv
6.9
Total consumption with NeiCS when multi-hop relaying M measurements through intermediate nodes to the BS, compared to one-hop
NeiCS; N = 500, R0 = 50 and R = 9.
. . . . . . . . . . . . . . . . . 150
A.1 Real distances from any random node to the BS in a circle shape area
arbitrary network . . . . . . . . . . . . . . . . . . . . . . . . . . . . . 174
xvi
CHAPTER 1
INTRODUCTION
Wireless sensor networks (WSN) facilitate many application areas in the real world [1,
2]. The networks consist of small inexpensive sensors deployed randomly in geographical areas to monitor (e.g., temperature, humidity, acoustic, vibration) or detect events
(e.g., intruders, chemical leak, vehicle passing, fire or flood detection). The sensors
typically operate on battery power and they communicate wirelessly within a communication range, and have some level of computational capability. In monitoring
applications, sensors send their readings to the sink or base-station (BS) for data
analysis or mapping. Since the sensors operate on low power and may not be easily
accessible by people, the network lifetime depends on sensor connections in the entire
area.
There have been many data collection methods exploring different network topologies to minimize the total consumed power for such networks [3, 4]. These methods
focus on balancing energy between sensors and spending less power on transmitting
data. But, those methods still have to ensure delivery of all the sensory readings from
sensors to the BS which could result in an energy imbalance, especially on the sensors
close to the BS which play a role of relaying data.
Compressive sensing (CS) [5, 6, 7, 8] is a mathematical technique in signal processing focused on representing and reconstructing a signal through undersampling
and optimization. CS allows for sampling and recovering a signal at a sampling rate
lower than allowed by the Nyquist-Shannon sampling theorem based on knowledge
about a signals sparsity. Since the sensory readings in WSNs are often highly cor-
1
related, CS can be considered as a potential framework for data collection in such
networks [9, 10, 11]. With CS the BS only needs a small number of CS measurements
collected from the networks compared to the total number of sensors to reconstruct
all data from the sensing area. CS based data collection methods in WSNs have been
shown to be energy efficient.
In this dissertation, four new CS based data collection methods are propose
called CS based random walk (CSR) [12, 13, 14], Cluster-based CS data collection
(CCS) [15, 16, 17, 18], Tree-based data gathering (TCS) [19] and Neighborhood-based
data collection (NeiCS) [20], respectively. The methods exploit the existing network
topologies and common connection between sensors in WSNs including random walk
and tree routing, cluster network or undirected graph, and utilize CS to reduce the
data collecting in such networks. The total power consumption for data transmission
in the networks are analyzed and formulated. In each specific case, optimal points are
suggested to minimize the total power consumption to prolong the network lifetime.
This dissertation is organized as follows. In Chapter 2, the background including
the overview of WSNs and CS and the literature review are presented. The literature
review section addresses existing work related to applying CS into WSNs and our
proposed methods. In Chapters 3, 4, 5 and 6 we propose four data collection methods.
In each method, the problem formulation, power consumption analysis and simulation
results are provided. We further suggest optimal cases for each method to consume
the least power in order to prolong the network lifetime. Conclusions and suggestions
for future work for each data collection method are presented at the end of each
chapter. Finally, Chapter 7 summarizes the dissertation and describes future work.
2
CHAPTER 2
BACKGROUND AND LITERATURE REVIEW
2.1
2.1.1
Wireless Sensor Network Overview
Introduction
Wireless sensor networks (WSNs) facilitate many application areas. The network is
the collaboration of a large number of sensor nodes which are deployed in a sensing area that needs to be observed. The sensors are typically low-cost, low-power,
multi-functional, and small devices that can calculate/measure/process sensed data
and communicate to each other or the base-station (BS) for data collection. Sensor
nodes can be considered as randomly and densely deployed in a sensing area, inside
a phenomenon, or close to it. They may be working in battlefield beyond the enemy
lines, at the bottom of an ocean, inside a tornado, attached to animals or moving
vehicles, in a biologically or chemically contaminated field, etc. They are usually
small in size, sometimes even smaller than a cubic centimeter [21]. These sensors
consume extremely low power [22] and the cost of each sensor could be less than one
dollar [23].
Composed of a large number of sensors, WSNs may consist of many different types
of sensors and may be able to accommodate different applications in diverse areas
including military applications, environmental applications, health applications, etc.
In military applications, as mentioned in [1, 24], sensors are deployed for battlefield
surveillance, monitoring force, nuclear, biological and chemical attack detection and
reconnaissance, etc. In environmental applications, a WSN can be deployed in a
3
forest to detect fire. Other applications include flood detection, animal tracking, biocomplexity mapping of the environment, and precision agriculture [25, 26, 27, 28]. In
health applications, sensors can be used to track doctors and patients in a hospital,
or to send patients’ behaviors for help if needed [22, 29, 30]. Home applications of
sensors have a lot of attention with smart or automation home. Almost the electronic
devices in the house can be under control/adjust with optimize solutions [31, 32, 33].
Sensor networks are being developed to satisfy the human needs in present and in the
future.
2.1.2
Challenges for Data Collection Method Design in WSNs
Energy saving is a critical issue for any WSN. Many routing, power management
and data dissemination protocols have been proposed to reduce power consumption
for such networks. Typically, WSNs contain hundreds or thousands of sensors. The
sensors are often densely deployed in a sensing area that needs to be observed. The
greater the number of sensors, the greater will be the accuracy of the observed information. As mentioned above, the cost for each sensor is typically very small due
to restrictions, such as limited energy supply, limited computing power, and limited
bandwidth of the wireless links connecting sensor nodes. Under the objectives of
transmitting data to a data processing center in an energy-efficient manner, saving
sensor energy consumption without losing accuracy, and preserving network lifetime,
designing WSNs involves several difficult challenges.
Sensor node deployment: Sensor nodes can be either manually placed or
randomly dropped in a sensing area to be observed. With manual deployment, data
is collected at the sink with predetermined routes. Most networks involve randomized
deployment with all sensors scattered randomly, creating an ad hoc routing infrastructure.
Balance and minimize energy consumption : In order to maintain the
4
network connections or to prolong the network lifetime, a network design should have
an energy consideration to consume the least power. Inter-sensor communication is
often over sort distances due to limited energy and bandwidth limitations. Transmitting data to the sink prefers multi-hop routing which normally consumes less energy
than direct communication. Besides, designed routes should deplete equally power
from all sensors deployed in the sensing area.
Data reporting method : Depending on the specific application and the time
criticality of sensing data, data reporting in WSNs can be categorized as time-driven,
event-driven, query-driven or a hybrid of some or all the methods. In the time-driven
method, sensors collect and send their data periodically. In event-driven and querydriven methods, sensor nodes react when an event occurs and send data to the sink
or the BS. Some networks use hybrid data delivery models to facilitate sensors.
Sensor capability : In many research studies, all the sensor nodes deployed
in a sensing area are assumed to be homogeneous. This means that they have equal
capacity in terms of pre-charged battery, communication and computation. But in
some networks, sensors can be heterogeneous due to different roles. For example,
there may be different types of data to be collected such as temperature, pressure and
humidity. Furthermore, with pre-chosen cluster-heads (CH) in clustered networks, the
CHs have higher power capacity than others since the burden of data transmission
often falls on them.
Fault tolerance : Sensors may change from active status or fully functioned
to be blocked due to lack of energy. The malfunctioned nodes are isolated but might
still be used for relaying data in the network. The fully functioned nodes may cover
the inactivated nodes and this failure would not affect the network in collecting data
at the BS. This requires more capacity for each sensor to be able to work in a faulttolerant network. Such as sensors might adjust transmitting power, signal rates, etc.
Sensor coverage : Due to the limitations of sensing range and transmission
5
range, sensors only can cover a limited region. Network coverage is highly dependent
on the number of sensors, types of sensors, and coverage algorithms in order to solve
the best coverage problem.
Network dynamics : In many applications, sensors may not be fixed all the
time. Sensors may take turns to be mobile to collect data from static sensors. In
some cases, the phenomenon may be mobile in tracking target applications. Dynamic
network structures become flexible and challenge data routing algorithms. Dynamic
networks may require additional energy, bandwidth, and so forth.
Data aggregation : Sensors may generate significant redundant data due overlapped regions covered by more than one sensors Similar packets from multiple nodes
can be aggregated to reduce the number of transmissions in the network. Data aggregation or data fusion is the combination of data from different sources with sensed
data being processed before it is sent ot the BS.
Quality of service : Beside the accuracy of data transmitting to the BS,
latency is another condition for time-constrained applications. Data reporting time
and quality of sensed data, critical in some applications, and conservation of energy,
which is closely related to network lifetime, are in competition. Balancing quality of
service to prolong network lifetime is a challenge for designing WSNs.
Other than the challenges and design issues listed above, other factors that must
be considered in network design include sensor scalability, transmission media, connectivity, etc and others. Based on these design constraints, many data collection
methods have been proposed in order to solve the issues and challenges. The methods are generally categorized as hierarchical routing, flat routing and local-based
routing as follows.
6
2.1.3
Data Collection Method Protocols in WSNs
Hierarchical Routing
Hierarchical or cluster-based routing is utilized to perform energy-efficient routing
in WSNs. In order to keep sensors in WSNs alive longer in their tasks, numerous
clustering algorithms have been developed and refined in research. Sensors are divided
into clusters regionally with an appropriate number of clusters. Each cluster chooses
one of member leader, called the cluster head (CH), which will take the role to forward
all aggregated data from the cluster to the sink or BS. The non-cluster head sensors
only send their data to their own CHs.
There are many different clustering algorithms. Some focus on balancing energy
for the networks, or distances between non-CH sensors and CHs and distances between
CHs and BS; some others optimize the number of clusters in WSNs; and others
identify energy efficient topologies for the network. The hierarchical data collection
methods have general feature as follows.
- Cluster head (CH) may be pre-determined by a network designer before being
deployed to a sensing area [34]. These CHs may have richer resources than noncluster head sensors because they have to expend more power to transmit aggregated
data from clusters to the BS while all other sensors only send their readings over a
shorter distance to the CHs. This configuration can help to make a network operate
longer but will be a challenge to deploy those CHs uniformly in the sensing area.
However, the network is not flexible as intended or may be out of order when some
CHs fail to function properly.
- Role of CHs can be exchanged (tolerant) by algorithm: in the most cases, CHs
are some of the sensors deployed to sensing areas and determined after landing and
clustering. It depends on a specific algorithm, a CH is chosen to satisfy a network’s
requirements and works until running out of power. To avoid the network becoming
7
disconnected as sensors deplete their power, especially CHs since they work for the
longest distance with all cluster gathered data, in many algorithms, the role of being
CHs will be changed frequently based on low energy notices within a cluster [35],[36],
[37].
- Multi-hop or single hop routing within a cluster could be applied: In general, CHs
often locate in the middle of clusters and minimize the total distance between nonCH and CHs smallest [38]. If clusters are large, the direct links between sensors and
CHs may consume a lot of energy. In this case, we call single hop data transmission.
To reduce energy consumption, multi-hop links enable sensors to transfer their data
through adjacent nodes and finally reach a CH. These methods are mentioned in [39,
40].
- Clustering in WSNs with multiple objectives: under the common purpose of saving
transportation cost and energy, and prolonging the network lifetime, the objectives
can be load balanced between clusters, optimal number of clusters [36], fault-tolerance
[37], increased connectivity and reduced latency. These aspects are addressed in the
next sections.
K-means clustering algorithm: K-means is a very simple but effective algorithm in WSNs [41, 38, 42]. Suppose we have a set of sensor nodes X = [x1 x2 . . . xN ],
and want them arranged into Nc clusters; each cluster has one cluster head (CH) at
the center. The algorithm has only four simple steps as follows.
1) Randomly choose Nc centroid points for Nc clusters (or we can base on some
prior knowledge); it really does not matter in choosing these positions at first. Calculate the cluster prototype matrix M = [m1 m2 . . . mNc ].
2) Assign each object in the data set to the nearest cluster Cw , i.e.
xj ∈ Cw
if || xj − mw || < || xj − mi ||
f or j = 1, . . ., N,
i ̸= w ,
and i = 1, . . ., Nc
In this step, we rearrange clusters based on distances between a CH and non-CH
8
sensors. A sensor will choose the closest CH to be with and new CHs have to be at
the center of clusters.
3) Recalculate the cluster prototype matrix based on the current partition.
4) Repeat steps 2 - 3 until there is no change for each cluster;
100
90
80
70
60
50
40
30
20
10
0
0
10
20
30
40
50
60
70
80
90
100
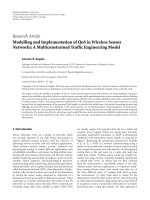
Figure 2.1: K-means clustering algorithm with k = 10 clusters
Figure 2.1 illustrates a WSN deployed in a square sensing area (100×100) with 500
sensors that are divided into 10 clusters by the K-means clustering algorithm. Besides
some advantages, K-means still has some limitations. All the centroid points vary with
different initial assignments. This means that each time we choose different centroid
positions, we will get different converged points in the same network. According
to [43], K-means cannot guarantee convergence to a global optimum. It is sensitive
to outliers and noise and the definition of means limits the application to numerical
variables. Some work on advanced K-means clustering can be found in [44] and [45].
Fuzzy C-means clustering algorithm According to [46, 47, 48], the FCM
or Fuzzy C-means clustering algorithm works better than K-means; it may converge
faster and dissipates energy less than K-means.
With FCM, one sensor can belong to more than one cluster head (CH) based on a
9