Statistics for business and economics 8th edition newbold test bank
Bạn đang xem bản rút gọn của tài liệu. Xem và tải ngay bản đầy đủ của tài liệu tại đây (1003.81 KB, 80 trang )
Statistics for Business and Economics, 8e (Newbold)
Chapter 2 Describing Data: Numerical
1) If you are interested in comparing variation in sales for small and large stores selling similar goods,
which of the following is the most appropriate measure of dispersion?
A) the range
B) the interquartile range
C) the standard deviation
D) the coefficient of variation
Answer: D
Difficulty: Easy
Topic: Measures of Variability
AACSB: Reflective Thinking Skills
Course LO: Compare and contrast methods of summarizing and describing data
2) Suppose you are told that the mean of a sample is below the median. What does this information
suggest about the distribution?
A) The distribution is symmetric.
B) The distribution is skewed to the right or positively skewed.
C) The distribution is skewed to the left or negatively skewed.
D) There is insufficient information to determine the shape of the distribution.
Answer: C
Difficulty: Easy
Topic: Measures of Central Tendency and Location
AACSB: Reflective Thinking Skills
Course LO: Compare and contrast methods of summarizing and describing data
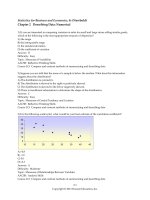
3) For the following scatter plot, what would be your best estimate of the correlation coefficient?
A) -0.8
B) -1.0
C) 0.0
D) -0.3
Answer: A
Difficulty: Moderate
Topic: Measures of Relationships Between Variables
AACSB: Analytic Skills
Course LO: Compare and contrast methods of summarizing and describing data
2-1
Copyright © 2013 Pearson Education, Inc.
4) Given a set of 25 observations, for what value of the correlation coefficient would we be able to say that
there is evidence that a relationship exists between the two variables?
A)
≥ 0.40
B)
≥ 0.35
C)
≥ 0.30
D)
≥ 0.25
Answer: A
Difficulty: Moderate
Topic: Measures of Relationships Between Variables
AACSB: Analytic Skills
Course LO: Identify and apply formulas for calculating descriptive statistics
5) Which of the following statements is true about the correlation coefficient and covariance?
A) The covariance is the preferred measure of the relationship between two variables since it is generally
larger than the correlation coefficient.
B) The correlation coefficient is a preferred measure of the relationship between two variables since its
calculation is easier than the covariance.
C) The covariance is a standardized measure of the linear relationship between two variables.
D) The covariance and corresponding correlation coefficient are represented by different signs, one is
negative while the other is positive and vice versa.
Answer: C
Difficulty: Moderate
Topic: Measures of Relationships Between Variables
AACSB: Reflective Thinking Skills
Course LO: Compare and contrast methods of summarizing and describing data
6) For the following scatter plot, what would be your best estimate of the correlation coefficient?
A) 1.0
B) 0.7
C) 0.3
D) 0.1
Answer: B
Difficulty: Moderate
Topic: Measures of Relationships Between Variables
AACSB: Analytic Skills
Course LO: Compare and contrast methods of summarizing and describing data
2-2
Copyright © 2013 Pearson Education, Inc.
7) Which of the following descriptive statistics is least affected by outliers?
A) mean
B) median
C) range
D) standard deviation
Answer: B
Difficulty: Easy
Topic: Measures of Central Tendency and Location
AACSB: Reflective Thinking Skills
Course LO: Compare and contrast methods of summarizing and describing data
8) Which of the following statements is true?
A) The correlation coefficient is always greater than the covariance.
B) The covariance is always greater than the correlation coefficient.
C) The covariance may be equal to the correlation coefficient.
D) Neither the covariance nor the correlation coefficient can be equal to zero.
Answer: C
Difficulty: Moderate
Topic: Measures of Relationships Between Variables
AACSB: Reflective Thinking Skills
Course LO: Compare and contrast methods of summarizing and describing data
9) Which measures of central location are not affected by extremely small or extremely large data values?
A) arithmetic mean and median
B) median and mode
C) mode and arithmetic mean
D) geometric mean and arithmetic mean
Answer: B
Difficulty: Moderate
Topic: Measures of Central Tendency and Location
AACSB: Reflective Thinking Skills
Course LO: Compare and contrast methods of summarizing and describing data
10) Suppose you are told that sales this year are 30% higher than they were six years ago. What has been
the average annual increase in sales over the past six years?
A) 5.0%
B) 4.5%
C) 4%
D) 3.5%
Answer: B
Difficulty: Moderate
Topic: Measures of Central Tendency and Location
AACSB: Analytic Skills
Course LO: Identify and apply formulas for calculating descriptive statistics
2-3
Copyright © 2013 Pearson Education, Inc.
11) Suppose you are told that sales this year are 20% higher than they were five years ago. What has been
the annual average increase in sales over the past five years?
A) 5.2%
B) 4.7%
C) 4.2%
D) 3.7%
Answer: D
Difficulty: Moderate
Topic: Measures of Central Tendency and Location
AACSB: Analytic Skills
Course LO: Identify and apply formulas for calculating descriptive statistics
12) Suppose you are told that over the past four years, sales have increased at rates of 10%, 8%, 6%, and
4%. What has been the average annual increase in sales over the past four years?
A) 7.0%
B) 6.7%
C) 6.4%
D) 6.5%
Answer: A
Difficulty: Moderate
Topic: Measures of Central Tendency and Location
AACSB: Analytic Skills
Course LO: Identify and apply formulas for calculating descriptive statistics
13) Suppose you are told that the average return on investment for a particular class of investments was
7.8% with a standard deviation of 2.3. Furthermore, the histogram of the distribution of returns is
approximately bell-shaped. We would expect that 95 percent of all of these investments had a return
between what two values?
A) 5.5% and 10.1%
B) 0% and 15%
C) 3.2% and 12.4%
D) 0.9% and 14.7%
Answer: C
Difficulty: Moderate
Topic: Measures of Central Tendency and Location
AACSB: Analytic Skills
Course LO: Identify and apply formulas for calculating descriptive statistics
14) What is the relationship among the mean, median, and mode in a positively skewed distribution?
A) They are all equal.
B) The mean is always the smallest value.
C) The mean is always the largest value.
D) The mode is the largest value.
Answer: B
Difficulty: Moderate
Topic: Measures of Central Tendency and Location
AACSB: Reflective Thinking Skills
Course LO: Compare and contrast methods of summarizing and describing data
2-4
Copyright © 2013 Pearson Education, Inc.
15) The manager of a local RV sales lot has collected data on the number of RVs sold per month for the
last five years. That data is summarized below:
# of Sales
# of Months
0
2
1
6
2
9
3
13
4
21
5
7
6
2
What is the weighted mean number of sales per month?
A) 3.31
B) 3.23
C) 3.54
D) 3.62
Answer: B
Difficulty: Moderate
Topic: Weighted Mean and Measures of Grouped Data
AACSB: Analytic Skills
Course LO: Identify and apply formulas for calculating descriptive statistics
16) A recent survey of Fortune 500 firms found that on average, they contribute $332.54 per month for
each salaried employee's health insurance. If you are told that almost all salaried employees at Fortune
500 firms receive a health insurance contribution between $220.61 and $444.47, and assuming a bellshaped distribution, what must the standard deviation for this data be?
A) $37.31
B) $46.65
C) $55.98
D) $74.64
Answer: C
Difficulty: Moderate
Topic: Measures of Central Tendency and Location
AACSB: Analytic Skills
Course LO: Compare and contrast methods of summarizing and describing data
17) A bored carpenter counts the actual number of nails in 10 boxes of nails and records his findings as:
230, 235, 302, 287, 312, 323, 265, 319, 342, and 298. What can we say about the shape of the distribution of
the number of nails?
A) symmetric
B) skewed to the right
C) approximately bell-shaped
D) skewed to the left
Answer: D
Difficulty: Moderate
Topic: Measures of Central Tendency and Location
AACSB: Analytic Skills
Course LO: Compare and contrast methods of summarizing and describing data
2-5
Copyright © 2013 Pearson Education, Inc.
18) Which of the following statements is not true?
A) Measures of central tendency are numbers that describe typical values in the data.
B) The coefficient of variation is the least used measure of central tendency.
C) The mean is the most widely used measure of location.
D) All of the above
Answer: B
Difficulty: Moderate
Topic: Measures of Central Tendency and Location
AACSB: Reflective Thinking Skills
Course LO: Compare and contrast methods of summarizing and describing data
19) A professor collected data on the number of absences in an introductory statistics class of 100 students
over the course of a semester. The data are summarized below.
Number of Absences
0
1
2
3
4
5
6
Number of Students
5
13
24
23
17
11
7
What is the weighted mean number of absences per semester?
A) 3.14
B) 2.0
C) 2.95
D) 3.07
Answer: C
Difficulty: Moderate
Topic: Weighted Mean and Measures of Grouped Data
AACSB: Analytic Skills
Course LO: Identify and apply formulas for calculating descriptive statistics
20) Looking at the scatter plot below, what value would be your best estimate for the correlation
coefficient?
A) -0.7
B) -0.3
C) -1.0
D) 0.0
Answer: A
Difficulty: Moderate
Topic: Measures of Relationships Between Variables
AACSB: Analytic Skills
Course LO: Identify and apply formulas for calculating descriptive statistics
2-6
Copyright © 2013 Pearson Education, Inc.
THE NEXT QUESTIONS ARE BASED ON THE FOLLOWING INFORMATION:
A recent survey asked respondents about their monthly purchases of raffle tickets. The monthly
expenditures, in dollars, of ten people who play the raffle are 23, 15, 11, 20, 28, 35, 13, 10, 20, and 24.
21) What can we say about the shape of the distribution of monthly purchases of raffle tickets?
A) Skewed to the left
B) Skewed to the right
C) Approximately bell-shaped
D) None of the above
Answer: C
Difficulty: Moderate
Topic: Measures of Central Tendency and Location
AACSB: Analytic Skills
Course LO: Compare and contrast methods of summarizing and describing data
22) Which of the following statements is not true?
A) The 75th percentile is equal to 23.5.
B) The median is equal to the mode.
C) The mean is 19.9.
D) The distribution is approximately symmetric.
Answer: A
Difficulty: Moderate
Topic: Measures of Central Tendency and Location
AACSB: Analytic Skills
Course LO: Identify and apply formulas for calculating descriptive statistics
23) Over the past 10 years, the return on Stock A has averaged 8.4% with a standard deviation of 2.1%.
The return on Stock B has averaged 3.6% with a standard deviation of 0.9%. Which of the following
statements is true?
A) Stock A has smaller relative variation than Stock B.
B) Stock B has smaller relative variation than Stock A.
C) Both stocks exhibit the same relative variation.
D) Unable to tell with the given information.
Answer: C
Difficulty: Moderate
Topic: Measures of Variability
AACSB: Analytic Skills
Course LO: Identify and apply formulas for calculating descriptive statistics
2-7
Copyright © 2013 Pearson Education, Inc.
24) The median value of the data values 12, 32, 48, 8, 22, 9, 30, and 18 equals:
A) 20
B) 22
C) 24
D) 26
Answer: A
Difficulty: Easy
Topic: Measures of Central Tendency and Location
AACSB: Analytic Skills
Course LO: Identify and apply formulas for calculating descriptive statistics
THE NEXT QUESTIONS ARE BASED ON THE FOLLOWING INFORMATION:
The police lieutenant in charge of the traffic division reviews the number of traffic citations issued by
each of the police officers in his division. He finds that the mean number of citations written by each
officer is 23.2 citations per day, with a standard deviation of 3.1. Assume that the distribution of the
number of tickets issued is approximately bell-shaped.
25) Which of the following statements is true?
A) Almost all of the officers wrote somewhere between 20.1 and 26.3 citations per day.
B) Almost all of the officers wrote more than 17 citations per day.
C) Almost all of the officers wrote less than 15 citations per day.
D) Approximately 95% of the officers wrote between 20.1 and 26.3 citations.
Answer: B
Difficulty: Moderate
Topic: Measures of Variability
AACSB: Analytic Skills
Course LO: Identify and apply formulas for calculating descriptive statistics
26) The coefficient of variation for the number of citations is:
A) 13.36%
B) 7.48%
C) 6.68
D) Cannot be determined without the sample size
Answer: A
Difficulty: Moderate
Topic: Measures of Variability
AACSB: Analytic Skills
Course LO: Identify and apply formulas for calculating descriptive statistics
2-8
Copyright © 2013 Pearson Education, Inc.
27) Suppose that you are also told that the median for these data was 19.3. Which of the following
statements is true about the shape of the distribution?
A) It is skewed to the right.
B) It is skewed to the left.
C) It is approximately symmetric.
D) Cannot be determined without more information
Answer: A
Difficulty: Moderate
Topic: Measures of Variability
AACSB: Analytic Skills
Course LO: Identify and apply formulas for calculating descriptive statistics
28) What would be a reasonable estimate for the 75th percentile?
A) Between 23.2 and 26.3
B) Between 26.3 and 29.4
C) Between 29.4 and 32.5
D) Greater than 32.5
Answer: B
Difficulty: Moderate
Topic: Measures of Variability
AACSB: Analytic Skills
Course LO: Identify and apply formulas for calculating descriptive statistics
29) What would be a reasonable estimate for the 99 th percentile?
A) Between 23.2 and 26.3
B) Between 26.3 and 29.4
C) Between 29.4 and 32.5
D) Greater than 32.5
Answer: C
Difficulty: Moderate
Topic: Measures of Variability
AACSB: Analytic Skills
Course LO: Identify and apply formulas for calculating descriptive statistics
30) What is the relationship among the mean, median, and mode in a symmetrical distribution?
A) They are all equal.
B) The mean is always the smallest value.
C) The mean is always the largest value.
D) The mode is the largest value.
Answer: A
Difficulty: Moderate
Topic: Measures of Central Tendency and Location
AACSB: Analytic Skills
Course LO: Identify and apply formulas for calculating descriptive statistics
2-9
Copyright © 2013 Pearson Education, Inc.
THE NEXT QUESTIONS ARE BASED ON THE FOLLOWING INFORMATION:
The police lieutenant in charge of the traffic division has reviewed the number of traffic citations issued
per day by each of the 10 police officers in his division. The data were: 13, 21, 12, 34, 31, 13, 22, 26, 25, and
23.
31) What is the mean number of citations issued per day?
A) 22.0
B) 22.5
C) 13.0
D) 13.5
Answer: A
Difficulty: Easy
Topic: Measures of Central Tendency and Location
AACSB: Analytic Skills
Course LO: Identify and apply formulas for calculating descriptive statistics
32) What is the median number of citations issued per day?
A) 22.0
B) 22.5
C) 13.0
D) 13.5
Answer: B
Difficulty: Easy
Topic: Measures of Central Tendency and Location
AACSB: Analytic Skills
Course LO: Identify and apply formulas for calculating descriptive statistics
33) What is the mode of the number of citations issued per day?
A) 22.0
B) 22.5
C) 13.0
D) 13.5
Answer: C
Difficulty: Easy
Topic: Measures of Central Tendency and Location
AACSB: Analytic Skills
Course LO: Identify and apply formulas for calculating descriptive statistics
34) What is the first quartile of the number of citations issued per day?
A) 22.0
B) 22.5
C) 13.0
D) 27.25
Answer: C
Difficulty: Moderate
Topic: Measures of Central Tendency and Location
AACSB: Analytic Skills
Course LO: Identify and apply formulas for calculating descriptive statistics
2-10
Copyright © 2013 Pearson Education, Inc.
35) What is the third quartile of the number of citations issued per day?
A) 22.0
B) 22.5
C) 13.0
D) 27.25
Answer: D
Difficulty: Moderate
Topic: Measures of Central Tendency and Location
AACSB: Analytic Skills
Course LO: Identify and apply formulas for calculating descriptive statistics
36) What would you conclude if a sample correlation coefficient is equal to -1.00?
A) All the data points must fall exactly on a straight line with a positive slope.
B) All the data points must fall exactly on a straight line with a negative slope.
C) Most of the data points must fall exactly on a straight line with a positive slope
D) Most of the data points must fall exactly on a horizontal straight line
Answer: B
Difficulty: Moderate
Topic: Measures of Relationships Between Variables
AACSB: Analytic Skills
Course LO: Identify and apply formulas for calculating descriptive statistics
37) Which of the following statements is true?
A) Measures of variability are numbers that describe the scatter of the data or the extent to which the data
values are spread out.
B) The range is the most useful measure of variability.
C) The weighted mean is the most useful measure of variability.
D) All of the above
Answer: A
Difficulty: Moderate
Topic: Measures of Variability
AACSB: Analytic Skills
Course LO: Identify and apply formulas for calculating descriptive statistics
38) Which of the following is not a measure of variability?
A) interquartile range
B) variance
C) weighted mean
D) range
Answer: C
Difficulty: Moderate
Topic: Measures of Variability
AACSB: Analytic Skills
Course LO: Identify and apply formulas for calculating descriptive statistics
2-11
Copyright © 2013 Pearson Education, Inc.
39) The standard deviation of the sample data 13, 14, 17, and 20 equals:
A) 2.74
B) 3.16
C) 7.98
D) 9.16
Answer: B
Difficulty: Easy
Topic: Measures of Variability
AACSB: Analytic Skills
Course LO: Identify and apply formulas for calculating descriptive statistics
40) The strength of the linear relationship between two numerical variables may be measured by the:
A) correlation coefficient.
B) coefficient of variation.
C) interquartile range.
D) third quartile.
Answer: A
Difficulty: Moderate
Topic: Measures of Variability
AACSB: Reflective Thinking Skills
Course LO: Identify and apply formulas for calculating descriptive statistics
41) For any set of grouped or ungrouped data, which measures of central location always have only one
value?
A) arithmetic mean and median
B) median and mode
C) mode and arithmetic mean
D) geometric mean and mode
Answer: A
Difficulty: Moderate
Topic: Measures of Central Tendency and Location
AACSB: Reflective Thinking Skills
Course LO: Identify and apply formulas for calculating descriptive statistics
42) Which of the following statement is true?
A) The range is found by taking the difference between the high and low values and dividing that value
by 2.
B) The interquartile range is found by taking the difference between the 1st and 3rd quartiles and
dividing that value by 2.
C) The standard deviation is expressed in terms of the original units of measurement but the variance is
not.
D) The values of the standard deviation may be either positive or negative, while the value of the
variance will always be positive.
Answer: C
Difficulty: Moderate
Topic: Measures of Variability
AACSB: Reflective Thinking Skills
Course LO: Identify and apply formulas for calculating descriptive statistics
2-12
Copyright © 2013 Pearson Education, Inc.
43) Which of the following statements is true?
A) The mean is a measure of the deviation in a data set.
B) The standard deviation is a measure of variability.
C) The range is a measure of central location.
D) The median is a measure of variability.
Answer: B
Difficulty: Easy
Topic: Measures of Variability
AACSB: Reflective Thinking Skills
Course LO: Compare and contrast methods of summarizing and describing data
44) According to the Empirical Rule, the percentage of observations in a data set (providing that the data
set has a bell-shaped and symmetric distribution) that should fall within two standard deviations of their
mean is approximately:
A) 90%
B) 95%
C) 97.5%
D) 100%
Answer: B
Difficulty: Easy
Topic: Measures of Variability
AACSB: Analytic Skills
Course LO: Identify and apply formulas for calculating descriptive statistics
45) The Empirical Rule states that the percentage of observations in a data set (providing that the data set
has a bell-shaped and symmetric distribution) that fall within one standard deviation of their mean is
approximately:
A) 68%
B) 75%
C) 95%
D) 99%
Answer: A
Difficulty: Easy
Topic: Measures of Variability
AACSB: Analytic Skills
Course LO: Identify and apply formulas for calculating descriptive statistics
46) For any distribution, the percent of observations that lie within four standard deviations of the mean
is:
A) 93.75% or more.
B) 93.75% or less.
C) 6.25% or more.
D) 6.25% or less.
Answer: A
Difficulty: Moderate
Topic: Measures of Variability
AACSB: Analytic Skills
Course LO: Identify and apply formulas for calculating descriptive statistics
2-13
Copyright © 2013 Pearson Education, Inc.
47) For a sample of size 5, if x1 -
= -5, x2 -
= 9, x3 -
= -7, and x4 -
= -2, then the sample standard
deviation is:
A) 5.639
B) 6.782
C) 6.066
D) 6.305
Answer: D
Difficulty: Moderate
Topic: Measures of Variability
AACSB: Analytic Skills
Course LO: Identify and apply formulas for calculating descriptive statistics
48) The covariance of the following sample data of four (X, Y) pairs: (1, 5), (2, 10), (4, 7), and (5, 9) equals:
A) 1.25
B) 2.50
C) 3.75
D) 3.69
Answer: A
Difficulty: Easy
Topic: Measures of Variability
AACSB: Analytic Skills
Course LO: Identify and apply formulas for calculating descriptive statistics
THE NEXT QUESTIONS ARE BASED ON THE FOLLOWING INFORMATION:
The following data represent a sample of 10 scores on a statistics quiz: 16, 16, 16, 16, 16, 18, 18, 20, 20, and
20.
49) The mean score is:
A) 17.0
B) 17.6
C) 18.0
D) 10.0
Answer: B
Difficulty: Easy
Topic: Measures of Central Tendency and Location
AACSB: Analytic Skills
Course LO: Identify and apply formulas for calculating descriptive statistics
50) The median score is:
A) 16
B) 17
C) 18
D) 19
Answer: B
Difficulty: Easy
Topic: Measures of Central Tendency and Location
AACSB: Analytic Skills
Course LO: Identify and apply formulas for calculating descriptive statistics
2-14
Copyright © 2013 Pearson Education, Inc.
51) The modal score is:
A) 16
B) 17
C) 18
D) 20
Answer: A
Difficulty: Easy
Topic: Measures of Central Tendency and Location
AACSB: Analytic Skills
Course LO: Identify and apply formulas for calculating descriptive statistics
52) The standard deviation of the scores is:
A) 0.304
B) 1.333
C) 1.744
D) 1.838
Answer: D
Difficulty: Moderate
Topic: Measures of Variability
AACSB: Analytic Skills
Course LO: Identify and apply formulas for calculating descriptive statistics
53) The range of the scores is:
A) 4
B) 6
C) 8
D) 9
Answer: A
Difficulty: Easy
Topic: Measures of Variability
AACSB: Analytic Skills
Course LO: Identify and apply formulas for calculating descriptive statistics
54) Which of the following is used as a divisor in the sample variance s2, where n is the sample size?
A) n + 1
B) n
C) n - 1
D) n - 2
Answer: C
Difficulty: Easy
Topic: Measures of Variability
AACSB: Analytic Skills
Course LO: Compare and contrast methods of summarizing and describing data
2-15
Copyright © 2013 Pearson Education, Inc.
55) Which of the following represents a disadvantage of using the sample range to measure spread or
dispersion?
A) It produces spreads that are too large.
B) The sample range is not measured in the same units as the data.
C) The largest or smallest observation (or both) may be an outlier.
D) None of the above is correct.
Answer: C
Difficulty: Moderate
Topic: Measures of Variability
AACSB: Reflective Thinking Skills
Course LO: Identify and apply formulas for calculating descriptive statistics
56) The correlation coefficient of the following sample data of four (X, Y) pairs: (1, 5), (2, 10), (4, 7), and (5,
9) equals:
A) 0.263
B) 0.412
C) 0.528
D) 0.364
Answer: B
Difficulty: Moderate
Topic: Measures of Relationships Between Variables
AACSB: Analytic Skills
Course LO: Identify and apply formulas for calculating descriptive statistics
57) The following ten scores were obtained on a 20-point quiz: 4, 5, 8, 9, 11, 13, 15, 18, 18, and 20. The
teacher computed the usual descriptive measures of center (central tendency) and variability (dispersion)
for these data, and then discovered an error was made. One of the 18s should have been a 16. Which of
the following measures, calculated on the corrected data, would change from the original computation?
A) median
B) arithmetic mean
C) range
D) geometric mean
Answer: B
Difficulty: Moderate
Topic: Measures of Central Tendency and Location
AACSB: Analytic Skills
Course LO: Compare and contrast methods of summarizing and describing data
2-16
Copyright © 2013 Pearson Education, Inc.
58) A college placement office conducted a survey of 100 engineers who had graduated from Stanford
University. For these engineers, the mean salary was computed to be $72,000 with a standard deviation of
$8,000. The percentage of these engineers who earn more than $96,000 or less than $48,000 is:
A) approximately 0%.
B) at least 5.6% (1/18 of the engineers).
C) at most 5.6% (1/18 of the engineers).
D) at most 11.1% (1/9 of the engineers).
Answer: D
Difficulty: Moderate
Topic: Measures of Variability
AACSB: Analytic Skills
Course LO: Identify and apply formulas for calculating descriptive statistics
59) For which measure of central location will the sum of the deviations of each data value from that
measure always be zero?
A) arithmetic mean
B) geometric mean
C) median
D) mode
Answer: A
Difficulty: Moderate
Topic: Measures of Central Tendency and Location
AACSB: Reflective Thinking Skills
Course LO: Identify and apply formulas for calculating descriptive statistics
60) Which one of the values below represents a lower quartile for the data set 23, 24, 21, and 20?
A) 22.0
B) 22.5
C) 20.25
D) 23.5
Answer: C
Difficulty: Moderate
Topic: Measures of Variability
AACSB: Analytic Skills
Course LO: Identify and apply formulas for calculating descriptive statistics
61) Which of the following statements is true for the following data values: 17, 15, 16, 14, 17, 18, and 22?
A) The mean, median and mode are all equal.
B) Only the mean and median are equal.
C) Only the mean and mode are equal.
D) Only the median and mode are equal.
Answer: A
Difficulty: Easy
Topic: Measures of Central Tendency and Location
AACSB: Analytic Skills
Course LO: Identify and apply formulas for calculating descriptive statistics
2-17
Copyright © 2013 Pearson Education, Inc.
62) What is the smallest measure of central tendency in a positively skewed distribution?
A) the arithmetic mean
B) the median
C) the mode
D) None of the above
Answer: C
Difficulty: Easy
Topic: Measures of Central Tendency and Location
AACSB: Reflective Thinking Skills
Course LO: Compare and contrast methods of summarizing and describing data
63) Which of the following measure of dispersion is based on deviations from the mean?
A) standard deviation
B) coefficient of variation
C) range
D) box plots
Answer: A
Difficulty: Moderate
Topic: Measures of Variability
AACSB: Reflective Thinking Skills
Course LO: Identify and apply formulas for calculating descriptive statistics
64) At a highway checkpoint, the average speed of a passing car was measured at 50 miles per hour with
a standard deviation of 5 miles per hour. According to Chebyshev's Theorem, what percentage of cars
would you expect to be traveling between 42.5 and 57.5 miles per hour?
A) at least 50%
B) at least 55.6%
C) at least 75%
D) at least 88.9%
Answer: B
Difficulty: Moderate
Topic: Measures of Variability
AACSB: Analytic Skills
Course LO: Identify and apply formulas for calculating descriptive statistics
65) Which one of the values below represents the third quartile of the data set 10, 12, 16, 7, 9, 7, 41, and
14?
A) 8.0
B) 15.5
C) 7.0
D) 24.0
Answer: B
Difficulty: Moderate
Topic: Measures of Variability
AACSB: Analytic Skills
Course LO: Identify and apply formulas for calculating descriptive statistics
2-18
Copyright © 2013 Pearson Education, Inc.
66) Expressed in percentiles, the interquartile range is the difference between the:
A) 30% and 80% values.
B) 45% and 95% values.
C) 25% and 75% values.
D) 20% and 70% values.
Answer: C
Difficulty: Moderate
Topic: Measures of Variability
AACSB: Reflective Thinking Skills
Course LO: Identify and apply formulas for calculating descriptive statistics
67) What is the median of 36, 40, 37, 42, 45, 41, 34, and 39?
A) 39
B) 39.5
C) 40
D) 41
Answer: B
Difficulty: Easy
Topic: Measures of Central Tendency and Location
AACSB: Analytic Skills
Course LO: Identify and apply formulas for calculating descriptive statistics
68) If two data sets have the same range, then:
A) the distances from the smallest to largest observations in both sets will be the same.
B) the smallest and largest observations are the same in both sets.
C) both sets will have the same variance.
D) both sets will have the same interquartile range.
Answer: A
Difficulty: Moderate
Topic: Measures of Variability
AACSB: Reflective Thinking Skills
Course LO: Identify and apply formulas for calculating descriptive statistics
69) A sample of eight retired persons receiving social security payments revealed the following monthly
benefits: $985, $798, $1,210, $1,356, $1,087, $869, $987, and $1,045. How many observations are below the
median?
A) 2
B) 3
C) 4
D) 4.5
Answer: C
Difficulty: Easy
Topic: Measures of Central Tendency and Location
AACSB: Analytic Skills
Course LO: Compare and contrast methods of summarizing and describing data
2-19
Copyright © 2013 Pearson Education, Inc.
70) For a data set with 10 numerical values arranged in ascending order, the median is the arithmetic
mean of the:
A) third and fourth values.
B) fourth and fifth values.
C) fifth and sixth values.
D) first and tenth values.
Answer: C
Difficulty: Easy
Topic: Measures of Variability
AACSB: Analytic Skills
Course LO: Compare and contrast methods of summarizing and describing data
71) Since the population is always larger than the sample, the population mean:
A) is always larger than the sample mean.
B) is always smaller than the sample mean.
C) is always larger than or equal to or smaller than or equal to the sample mean.
D) can be smaller than, or larger than, or equal to the sample mean.
Answer: D
Difficulty: Easy
Topic: Measures of Central Tendency and Location
AACSB: Reflective Thinking Skills
Course LO: Compare and contrast methods of summarizing and describing data
72) The average score for a class of 35 students was 70. The 20 male students in the class averaged 73.
What was the average score for the 15 female students in the class?
A) 73
B) 70
C) 66
D) 60
Answer: C
Difficulty: Moderate
Topic: Measures of Central Tendency and Location
AACSB: Analytic Skills
Course LO: Identify and apply formulas for calculating descriptive statistics
73) Which of the following summary measures is affected most by outliers?
A) the first quartile
B) the second quartile
C) the third quartile
D) None of the above
Answer: D
Difficulty: Moderate
Topic: Measures of Variability
AACSB: Reflective Thinking Skills
Course LO: Identify and apply formulas for calculating descriptive statistics
2-20
Copyright © 2013 Pearson Education, Inc.
74) When extreme values are present in a set of data, which pair of the following descriptive summary
measures of central tendency and dispersion is most appropriate?
A) mean and standard deviation
B) median and interquartile range
C) range and coefficient of variation
D) mode and variance
Answer: B
Difficulty: Moderate
Topic: Measures of Variability
AACSB: Reflective Thinking Skills
Course LO: Identify and apply formulas for calculating descriptive statistics
75) Which measures of central tendency are not affected by extremely small or extremely large values?
A) arithmetic mean and median
B) arithmetic mean and mode
C) arithmetic mean and geometric mean
D) median and mode
Answer: D
Difficulty: Moderate
Topic: Measures of Central Tendency and Location
AACSB: Reflective Thinking Skills
Course LO: Identify and apply formulas for calculating descriptive statistics
76) If a distribution is highly skewed, what measure of central tendency should be avoided?
A) arithmetic mean
B) median
C) mode
D) all of the above
Answer: A
Difficulty: Moderate
Topic: Measures of Central Tendency and Location
AACSB: Reflective Thinking Skills
Course LO: Identify and apply formulas for calculating descriptive statistics
77) A question in a survey asks for a respondent's favorite sport. Which measure of central tendency
should be used to summarize this question?
A) arithmetic mean
B) geometric mean
C) median
D) mode
Answer: D
Difficulty: Moderate
Topic: Measures of Central Tendency and Location
AACSB: Reflective Thinking Skills
Course LO: Identify and apply formulas for calculating descriptive statistics
2-21
Copyright © 2013 Pearson Education, Inc.
78) According to Chebyshev's Theorem, at least what percent of the observations lie within ±1.25
standard deviations of the mean?
A) 36%
B) 56%
C) 76%
D) 96%
Answer: A
Difficulty: Moderate
Topic: Measures of Variability
AACSB: Analytic Skills
Course LO: Compare and contrast methods of summarizing and describing data
79) Which measure of central location is used to determine an average annual percent increase?
A) arithmetic mean
B) weighted mean
C) geometric mean
D) median
Answer: C
Difficulty: Easy
Topic: Measures of Central Tendency and Location
AACSB: Reflective Thinking Skills
Course LO: Identify and apply formulas for calculating descriptive statistics
80) In the calculation of the arithmetic mean for grouped data, which value is used to represent all the
values in a particular class?
A) the lower limit of the class
B) the upper limit of the class
C) the frequency of the class
D) the midpoint of the class
Answer: D
Difficulty: Moderate
Topic: Weighted Mean and Measures of Grouped Data
AACSB: Reflective Thinking Skills
Course LO: Identify and apply formulas for calculating descriptive statistics
81) A sample of college students revealed their last month income as follows: $765, $680, $623, $980, $875,
and $985. How many observations are below the median?
A) 1
B) 2
C) 3
D) 4
Answer: C
Difficulty: Moderate
Topic: Measures of Central Tendency and Location
AACSB: Analytic Skills
Course LO: Identify and apply formulas for calculating descriptive statistics
2-22
Copyright © 2013 Pearson Education, Inc.
82) A question in a market survey asks for a respondent's favorite car model. Which measure of central
location should be used to summarize this question?
A) arithmetic mean
B) geometric mean
C) median
D) mode
Answer: D
Difficulty: Easy
Topic: Measures of Central Tendency and Location
AACSB: Reflective Thinking Skills
Course LO: Compare and contrast methods of summarizing and describing data
83) The numerical measures mean, median, and mode provide information concerning the:
A) frequency of a data set.
B) evaluation of a data set.
C) location of the center of a data set.
D) direction of a data set.
Answer: C
Difficulty: Easy
Topic: Measures of Central Tendency and Location
AACSB: Reflective Thinking Skills
Course LO: Compare and contrast methods of summarizing and describing data
84) A measure of central tendency that is important in business and economics used in compound
interest, population growth, and total sales growth over time is the:
A) arithmetic mean.
B) median.
C) mode.
D) geometric mean.
Answer: D
Difficulty: Easy
Topic: Measures of Central Tendency and Location
AACSB: Reflective Thinking Skills
Course LO: Compare and contrast methods of summarizing and describing data
85) The mode is used infrequently in business applications because it:
A) is difficult to compute.
B) does not represent the true center of numerical data.
C) is too labor intensive.
D) is an accurate measure of central tendency.
Answer: B
Difficulty: Easy
Topic: Measures of Central Tendency and Location
AACSB: Reflective Thinking Skills
Course LO: Compare and contrast methods of summarizing and describing data
2-23
Copyright © 2013 Pearson Education, Inc.
86) Information about the frequency of sales of a business inventory product's size or color can best be
described by the:
A) mode.
B) mean.
C) median.
D) geometric mean.
Answer: A
Difficulty: Moderate
Topic: Measures of Central Tendency and Location
AACSB: Reflective Thinking Skills
Course LO: Compare and contrast methods of summarizing and describing data
87) For which type of distribution is the mean usually less than the median when measuring continuous
numerical unimodal data?
A) skewed-left
B) skewed-right
C) symmetrical
D) flat
Answer: A
Difficulty: Moderate
Topic: Measures of Central Tendency and Location
AACSB: Reflective Thinking Skills
Course LO: Compare and contrast methods of summarizing and describing data
88) For which type of distribution is the mean usually greater than the median when measuring
continuous numerical unimodal data?
A) skewed-left
B) skewed-right
C) symmetrical
D) flat
Answer: B
Difficulty: Moderate
Topic: Measures of Central Tendency and Location
AACSB: Reflective Thinking Skills
Course LO: Compare and contrast methods of summarizing and describing data
89) A distribution which contains a relatively small proportion of low values is said to be:
A) skewed-left.
B) skewed-right.
C) symmetrical.
D) flat.
Answer: A
Difficulty: Moderate
Topic: Measures of Central Tendency and Location
AACSB: Reflective Thinking Skills
Course LO: Compare and contrast methods of summarizing and describing data
2-24
Copyright © 2013 Pearson Education, Inc.
90) A distribution which contains a relatively small proportion of high values is said to be:
A) skewed-left.
B) skewed-right.
C) symmetrical.
D) flat.
Answer: B
Difficulty: Moderate
Topic: Measures of Central Tendency and Location
AACSB: Reflective Thinking Skills
Course LO: Compare and contrast methods of summarizing and describing data
91) The measures that indicate the location or positions of a value relative to the entire set of data are
called the:
A) mean and median.
B) mode and geometric mean.
C) percentiles and quartiles.
D) standard deviation.
Answer: C
Difficulty: Easy
Topic: Measures of Central Tendency and Location
AACSB: Reflective Thinking Skills
Course LO: Compare and contrast methods of summarizing and describing data
92) Percentiles and Quartiles are generally used to describe which data sets?
A) small
B) evenly distributed
C) medium
D) large
Answer: D
Difficulty: Easy
Topic: Measures of Variability
AACSB: Reflective Thinking Skills
Course LO: Compare and contrast methods of summarizing and describing data
93) The measures used to describe sales data, survey data, or weights of newborn babies are called:
A) mode and geometric mean.
B) mean and median.
C) percentiles and quartiles.
D) both A and B
Answer: B
Difficulty: Easy
Topic: Measures of Central Tendency and Location
AACSB: Reflective Thinking Skills
Course LO: Compare and contrast methods of summarizing and describing data
2-25
Copyright © 2013 Pearson Education, Inc.