DSpace at VNU: Geochemical processes underlying a sharp contrast in groundwater arsenic concentrations in a village on the Red River delta, Vietnam
Bạn đang xem bản rút gọn của tài liệu. Xem và tải ngay bản đầy đủ của tài liệu tại đây (1.05 MB, 12 trang )
Applied Geochemistry 23 (2008) 3143–3154
Contents lists available at ScienceDirect
Applied Geochemistry
journal homepage: www.elsevier.com/locate/apgeochem
Geochemical processes underlying a sharp contrast in groundwater
arsenic concentrations in a village on the Red River delta, Vietnam
Elisabeth Eiche a,*, Thomas Neumann a, Michael Berg b, Beth Weinman c, Alexander van Geen d,
Stefan Norra a, Zsolt Berner a, Pham Thi Kim Trang e, Pham Hung Viet e, Doris Stüben a
a
Institute of Mineralogy and Geochemistry, Universität Karlsruhe (TH), 76131 Karlsruhe, Germany
Eawag, Swiss Federal Institute of Aquatic Science and Technology, 8600 Dübendorf, Switzerland
c
Earth and Environmental Sciences, Vanderbilt University, Nashville, TN 37240, USA
d
Lamont-Doherty Earth Observatory of Columbia University, Palisades, NY 10964, USA
e
Centre for Environmental Technology and Sustainable Development (CETASD), Hanoi University of Science, Hanoi, Viet Nam
b
a r t i c l e
i n f o
Article history:
Available online 11 July 2008
a b s t r a c t
The spatial variability of As concentrations in aquifers of the Red River Delta, Vietnam, was
studied in the vicinity of Hanoi. Two sites, only 700 m apart but with very different As concentrations in groundwater (site L: <10 lg/L vs. site H: 170–600 lg/L) in the 20–50 m
depth range, were characterized with respect to sediment geochemistry and mineralogy
as well as hydrochemistry. Sequential extractions of the sediment were carried out in order
to understand why As is released to groundwater at one site and not the other. No major
differences were observed in the bulk mineralogy and geochemistry of the sediment, with
the exception of the redox state of Fe oxyhydroxides inferred from sediment colour and diffuse spectral reflectance. At site H most of the As in the sediment was adsorbed to grey
sands of mixed Fe(II/III) valence whereas at site L As was more strongly bound to
orange-brown Fe(III) oxides. Higher dissolved Fe and low dissolved S concentrations in
groundwater at site H ($14 mg Fe/L, <0.3 mg S/L) suggest more strongly reducing conditions compared to site L (1–2 mg Fe/L, <3.8 mg S/L). High concentrations of NHþ
4
($10 mg/L), HCOÀ
3 (500 mg/L) and dissolved P (600 mg/L), in addition to elevated As at site
H are consistent with a release coupled to microbially induced reductive dissolution of Fe
oxyhydroxides. Other processes such as precipitation of siderite and vivianite, which are
strongly supersaturated at site H, or the formation of amorphous Fe(II)/As(III) phases
and Fe sulfides, may also influence the partitioning of As between groundwater and aquifer
sands.
The origin of the redox contrast between the two sites is presently unclear. Peat was
observed at site L, but it was embedded within a thick clayey silt layer. At site H, instead,
organic rich layers were only separated from the underlying aquifer by thin silt layers.
Leaching of organic matter from this source could cause reducing conditions and therefore
À
potentially be related to particularly high concentrations of dissolved NHþ
4 , HCO3 , P and
DOC in the portion of the aquifer where groundwater As concentrations are also elevated.
Ó 2008 Elsevier Ltd. All rights reserved.
1. Introduction
The enrichment of natural waters with As from geogenic sources poses a severe health problem throughout the
* Corresponding author. Fax: +49 721 608 4170.
E-mail address: (E. Eiche).
0883-2927/$ - see front matter Ó 2008 Elsevier Ltd. All rights reserved.
doi:10.1016/j.apgeochem.2008.06.023
world. Cases of arsenicosis have long ago been attributed
to elevated As levels in drinking water in countries such
as Taiwan (Tseng et al., 1968), Chile (Zaldivar, 1974), Mexico (Del Razo et al., 1990) and Argentina (Nicolli et al.,
1989). However, the international scientific community
was truly mobilized only after the discovery of elevated
groundwater As concentrations throughout the densely
3144
E. Eiche et al. / Applied Geochemistry 23 (2008) 3143–3154
populated Bengal Basin, which includes Bangladesh and
the state of West Bengal in India (Das et al., 1996). Other
regions with elevated As levels in groundwater have since
been identified, primarily in relatively young alluvial
deposits, such as the densely populated deltas of the Mekong and Red River in Cambodia and Vietnam (Berg
et al., 2001, 2007; Polya et al., 2005; Buschmann et al.,
2007, 2008; Larson et al., 2008; Rowland et al., 2008; Winkel et al., 2008a).
Over the years, various processes have been postulated
in order to explain high As concentrations in groundwater. The reductive dissolution of different Fe oxides, which
are common in sedimentary environments, is widely accepted as a key process for the release of As into groundwater (Nickson et al., 2000; Dowling et al., 2002; Harvey
et al., 2002; Stüben et al., 2003; Charlet and Polya,
2006). However, the reduction of Fe oxides alone cannot
explain the wide range of groundwater As concentrations
encountered in similarly reducing aquifers (Polizzotto
et al., 2006; Stute et al., 2007; van Geen et al., 2008a).
What is clear is that the microbially driven decomposition
of organic matter plays an important role for the onset
and the maintenance of reducing conditions in aquifers
(Lovley, 1992; Lovley and Chapelle, 1995; Rowland
et al., 2006, 2007). Despite its importance, not enough is
known about the nature and the origin of this organic
matter (Rowland et al., 2006). Different sources have been
proposed over the years, including peat layers or confining sediment layers rich in total organic carbon (TOC)
(Lovley and Chapelle, 1995; McAthur et al., 2001; Zheng
et al., 2004; Winkel et al., 2008b, 2008a), recharge from
ponds and rivers commonly high in dissolved organic carbon (DOC), as well as anthropogenic sources of organic
matter (Bukau et al., 2000; McAthur et al., 2001; Harvey
et al., 2002). Further processes under discussion which
could influence the As concentration in groundwater are
competition with other dissolved ions like PO3À
(Su and
4
Pulse, 2001) or HCOÀ
3 (Harvey et al., 2002; Apello et al.,
2002), oxidation of pyrite (Chowdhury et al., 1999) or precipitation and dissolution of secondary mineral phases
(e.g. siderite, magnetite, amorphous phases incorporating
As) (Sengupta et al., 2004; Swartz et al., 2004; Herbel
and Fendorf, 2006). Polizzotto et al. (2006) have also suggested that As released in the surface soil by redox cycling
could be transported downwards towards the sandy
aquifer.
There is still much disagreement about causes underlying the patchy As distribution commonly observed in affected areas. Pronounced differences in As levels can be
found within distances of 100 m (BGS/DPHE, 2001; van
Geen et al., 2003; McAthur et al., 2004). Recent studies in
portions of the Red River Delta have also revealed significant differences even within short distances of 10–20 m
(Berg et al., 2007). Several explanations have been proposed for the complex spatial distribution of As, including
differences in the subsurface lithology, mineralogy, geochemistry, local hydrology and the abundance of organic
material (Pal et al., 2002; van Geen et al., 2006; Stute
et al., 2007). Considerable uncertainty remains, however,
and too little is known to predict with confidence how As
concentrations will evolve over time and to what extent
aquifers currently providing potable water can be relied
on in the future (Zheng et al., 2005).
In an attempt to address some of these unresolved issues, the village of Van Phuc in northern Vietnam was selected for detailed investigations. In this village the
spatial As distribution is known to be highly variable (Berg
et al., 2008). Here geochemical results from two sediment
cores recovered from two contrasting environments are
presented and discussed, as well as profiles of groundwater
properties obtained from nests of wells installed at the
same two locations.
2. Study area
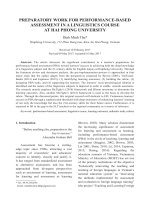
Van Phuc village is located in the Red River delta (Bac
Bo Plain, RRD), 10 km SE of Hanoi (Fig. 1). The delta covers
an area of 11,000 km2 and is used mainly for agriculture by
a population of about 11 million (Berg et al., 2001). The
morphology of the delta has been controlled by the highly
variable discharge of the Red River over the past millennia.
Throughout this period, riverbed movement has caused
erosion as well as accumulation of alluvial material. In
addition, a succession of transgressions and regressions
linked to climate fluctuations has contributed sediment
of marine origin. Due to the multitude of sedimentation
processes occurring in the RRD, the lithology of the delta
sediments is highly complex and sediment sequences vary
considerably within short distances (Mathers and Zalasiewicz, 1999; Tanabe et al., 2006).
Holocene as well as Pleistocene sediments are present
in the larger Hanoi area (Trafford et al., 1996). Southwest
of Hanoi the Holocene sediments contain high amounts
of natural organic matter (NOM). The Pleistocene and
Holocene aquifers along the Red River are mainly recharged by water from the river itself, at least in part because of the large withdrawals supplying the city of
Hanoi (Berg et al., 2007, 2008).
Van Phuc village is located between the Red River and a
levee that protects the south-western parts of Hanoi from
annual flooding (Fig. 1). The village itself is occasionally
flooded for a few days during the rainy season. The aquifer
consists of faintly bedded Holocene and Pleistocene sediments up to depths >40 m (Berg et al., 2007). The land is
mainly used for agriculture (corn, medicinal plants, cabbage). Most of the fields are irrigated during the dry season
either by water from ponds or, to a lesser extent, by
groundwater from dug wells. However, there are no rice
paddies in the region of Van Phuc.
Groundwater is the main source of drinking water in
Van Phuc. Households commonly pass raw groundwater
through sand filters which lowers As concentrations on
average by 80% due to co-precipitation with Fe (Berg
et al., 2006). Between the rainy and dry season, the depth
of the water table varies widely in both the aquifer
(64 m) and in the Red River (7–10 m). The similar major
ion composition of groundwater in Van Phuc and water
from the Red River is consistent with a significant component of recharge originating from the river, as recently documented at different locations upstream (Postma et al.,
2007; Berg et al., 2008).
3145
E. Eiche et al. / Applied Geochemistry 23 (2008) 3143–3154
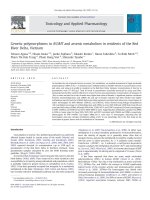
Fig. 1. Map depicting the study sites in Van Phuc village situated some 10 km south of the centre of Hanoi city (modified map from Berg et al., 2007).
Arsenic in groundwater shows a patchy distribution in this village. Site L (low) has particularly low levels of dissolved As (3 ± 2 lg/L), whereas site H (high)
features very high-As concentrations (400 ± 135 lg/L). The two sites are 700 m apart from each other. The satellite image was taken from google-earth
(earth.google.com).
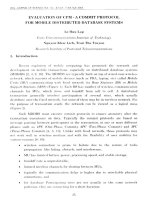
toring wells ranging from 17 to 55 m in depth and consisting of PVC casings with a 1-m long sand trap at the bottom
were also installed at each site (Fig. 2). To avoid infiltration
of surface water, concrete pads surrounding the upper
In April 2006, two $55 m-long sediment cores were
recovered by rotary drilling at site L, located in the lowAs area, and at site H in the high-As area (Fig. 1). The
distance between the two sites is only 700 m. Nine moni-
(a) Site L
(b) Site H
0
0
10
10
20
20
30
40
30
40
50
50
clay
gravel
silt
peat
60
sand
Fig. 2. Lithological logs of the boreholes drilled in April 2006 at (a) site L and (b) site H. Each site was equipped with a nest of nine monitoring wells. The
labelling on the left side of each log marks the samples taken for the sequential extraction procedure.
3146
E. Eiche et al. / Applied Geochemistry 23 (2008) 3143–3154
steel casing were installed and each well was capped with
a steel screw cap.
3. Materials and methods
3.1. Water sampling and analysis
Water samples were taken from the nine monitoring
wells at each site. Prior to sampling, groundwater was
pumped for about 10 min with an electrical pump to avoid
any contamination by stale water. Portable YSI 556 and
WTW Multi 340i (John Morris Scientific Pty Ltd.) systems
were used to measure Eh, pH, temperature, conductivity
and O2. Disposable cartridges that selectively adsorb
As(V) were used in the field to determine the speciation
of As (Meng et al., 2001) by difference relative to total dissolved As concentrations. For analysis of metals, NHþ
4 and
total P (Ptot), groundwater samples were filtered on-site
(cellulose nitrate filter, 0.45 lm) and acidified with HNO3
(65%, Fluka, Switzerland) to a pH < 2. For anions, alkalinity
($HCOÀ
3 ) and dissolved organic C (DOC), the samples were
left unfiltered and non-acidified. Pre-rinsed polypropylene
bottles were filled with the samples, sealed tightly and
stored in the dark at 4 °C until analysis. For alkalinity the
samples were filtered in the laboratory before analysis. In
order to check the quality of the alkalinity analysis in the
laboratory, control-measurements were done in the field
with a test kit (Merck, Germany). The results of laboratory
and field measurements were within 10% and therefore a
significant alteration of the alkalinity during storage and
transport can be excluded.
Dissolved As, Ptot and S concentrations were measured
by high-resolution ICP-MS (Element 2, Thermo Fisher, Bremen, Germany). The analysis of Fe, Mn, Ca, Mg and Ba was
conducted by ICP-OES (Spectro Ciros CCD, Kleve, Germany). Ammonium was analysed by photometry; NOÀ
3
and ClÀ by ion chromatography (Dionex, Switzerland),
alkalinity by titration and DOC by means of a TOC 5000
Analyser (Shimadzu, Switzerland). All groundwater analyses were carried out at Eawag. The quality of the results
can be taken as reasonably good as the ion balance varies
within less than 10%.
3.2. Sediment sampling and analysis
Samples were taken from the sediment cores in intervals of 1-m and more frequently in cases of significant
changes in colour, grain size or texture. About 100 g of
fresh sediment material was placed in polypropylene bags
and later flushed with N2 to minimize oxidation processes
in the time between sampling and analysis. Before transport the samples were packed into Mylar bags and flushed
again with N2. The samples were sent to Germany where
they were frozen until further analysis.
Prior to analysis, subsamples of the sediment were
dried at 40 °C and ground to powder. The elemental composition of the sediments was determined by energy dispersive X-ray fluorescence analysis (Spectra 5000,
Atomica). Precision (better than 5%) was calculated from
repeated measurements of a standard material, whereas
accuracy (better than 10%) was checked by including different reference materials, e.g. GXR 2 (Park City, Utah,
USA). Total S and C contents were quantified by a Carbon–Sulphur-Analyser (CSA 5003, Leybold Heraeus, Germany), and inorganic C was determined by Carbon–
Water-Analysis (CWA 5003, Leybold Heraeus, Germany).
The organic C content was calculated by subtracting inorganic C from total C. The mineral composition of the sediment samples was determined by means of X-ray
diffraction (XRD) analysis (Kristalloflex D500, Siemens,
Germany) at 40 kV and 25 mA. CuKa1-radiation was used
at angles between 3° and 63°. The semi-quantitative evaluation of the spectra was based on calibration curves obtained from different samples with known mineral
composition (Snyder and Bish, 1989).
The grain size distribution of the sediment was measured at Vanderbilt University using a laser-granulometer
(Mastersizer 2000, Malvern). The grain sizes were grouped
as follows: clay: <2 lm, silt: 2–63 lm, sand: >63 lm.
A CM2005d spectrophotometer (Minolta Corp., USA)
was used in order to measure the diffuse reflectance spectrum of freshly collected sediment in the field relative to a
white standard plate consisting of BaSO4. Each measurement was repeated three times. The difference in reflectance between 530 and 520 nm was calculated from the
measurements in order to obtain a value (DR in % reflectance) that previous work has shown is inversely related
to the Fe(II)/Fe ratio in the acid-leachable fraction of aquifer particles in Bangladesh (Horneman et al., 2004).
For sequential extractions of sediment from 7 intervals
at site L and 9 at site H (Fig. 2), 0.5 g of fresh sediment was
weighed into centrifuge tubes and the appropriate amount
of leaching solution was added. After each step the solutions were centrifuged at 4500 rpm for 15 min and then
decanted. The solutions were kept in a refrigerator until
further measurements by (HR-) ICP-MS (Axiom, VG Elemental). The procedure of Keon et al. (2001) was slightly
modified (Table 1). In order to avoid interferences with
ICP-MS measurements, 0.05 M (NH4)2SO4 (Wenzel et al.,
2001) was used instead of MgCl2 in the first step. Furthermore, in step 5 the application of Ti–citrate–EDTA was
changed to dithionite–citrate–bicarbonate (DCB) solution
described in van Herreweghe et al. (2003). Finally, steps
7 and 8 of the original procedure were combined into
one step. Specific conditions and the phases targeted by
each step are listed in Table 1. In order to check the reproducibility of the sequential extraction, one subsample was
first homogenized and afterwards separated into 3 aliquots. In 5 out of 7 of the fractions the results for Fe and
As concentrations did not differ by more than 10%, which
constitutes a reasonable level of reproducibility.
3.3. Geochemical modelling and statistical analysis
The saturation indices of different minerals like calcite,
dolomite, siderite etc. were calculated on the basis of the
hydrochemical results with the PHREEQC-program (Parkhurst and Appelo, 1999). Statistical analysis of water as
well as sediment data was done using the STATISTICA –
program (StatSoft, USA, Version 6). The p-value for the
given correlations is always <0.01.
E. Eiche et al. / Applied Geochemistry 23 (2008) 3143–3154
3147
Table 1
Sequential extraction scheme used for the sediment leaching
Step
Target phase
Extractant
Conditions
Ref.
F1
F2
Ionically bound
Strongly adsorbed
0.05 M (NH4)2SO4
0.5 M NaH2PO4
[1]
[2]
F3
Co-precipitated with acid volatile
sulfides, carbonates, Mn-oxides, very
amorphous Fe oxides
Co-precipitated with amorphous Fe
oxides
Co-precipitated with crystalline Fe
oxyhydroxides
1 M HCl
25 mL, 4 h, 25 °C, one repetition, one water wash
40 mL, 16 h and 24 h, 25 °C, pH 5, one repetition of each
time duration, one water wash
40 mL, 1 h, 25 °C, one repetition, one water wash
40 mL, 2 h, 25 °C, pH 3, dark (wrapped in Al-foil), one
repetition, one water wash
35 mL Na-citrate + 2.5 mL NaHCO3 (heating to 85 °C),
addition of 0.5 g Na2S2O4 Â H2O, 15 min at 85 °C, one
repetition, one water wash
40 mL, 1 h and 24 h, 25 °C, one repetition of each time step,
after 16 h, addition of boric acid, one hot wash
Method according to EPA 3050B
[2]
F4
F5
F6
Co-precipitated with silicate
F7
As-sulphides, co-precipitated with
sulphides, organic matter
0.2 M NHþ
4 -oxalate/oxalic
acid
DCB: 0.5 M Nacitrate + 1 M NaHCO3;
0.5 g Na2S2O4 Â H2O
10 M HF; 5 g boric acid
16 M HNO3; 30% H2O2
[2]
[3]
[2]
[1] Wenzel et al. (2001), [2] Keon et al. (2001), [3] van Herreweghe et al. (2003).
4. Results and interpretation
4.1. Lithology and reflectance
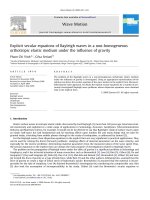
Based on grain-size, the core at site L can be separated
into 3 distinct layers: a silty (75 ± 12%) layer extending
from the top to a depth of 23 m, a sandy (65 ± 16%) intermediate layer with varying amounts of silt to a depth of
48 m, and a coarse gravel layer extending to a depth of
54 m where drilling stopped (Fig. 3a). Noteworthy are
two distinct black, organic rich intervals at depths of
$11 m and $13 m, respectively, within the upper silty
layer. This layer is an aquitard, based on the low hydrologic
conductivity (K: $7 Â 10À8 m/s) estimated from the grain
size distribution (Beyer, 1964). The transition to the underlying aquifer at a depth of 23 m is marked by a Fe-concretion consisting of goethite and quartz. The aquifer is
separated into an upper sand (K: $2 Â 10À6 m/s) and a
lower gravel deposit (Fig. 3a). The upper part is $25 m
thick and mainly composed of fine to medium sands interspersed with silty layers, mostly brown to yellowishbrown in colour.
The lithology of core H differs significantly from core L
and is more heterogeneous (Fig. 3b). The upper silt
(68 ± 20%) layer is only $10 m thick and the colour
changes from reddish-brown to greyish at $7 m. The estimated permeability is comparable to the clayey silt at site
L (K: $7 Â 10À8 m/s). Below this layer, alternating clayey
silt, silty fine sands, and fine sands were observed to a
depth of $21 m. Within this layer the hydraulic conductivity increases to (K: $4 Â 10À6 m/s) until deeper in the aquifer when hydraulic conductivity increases further (K:
$8 Â 10À6 m/s) due to the prevalence of sand (61 ± 20%)
with varying amounts of silt. Noteworthy is a change in
colour from greyish to brownish at $44 m. At a depth of
55 m, a much coarser gravel layer appears as at site L.
The spectral reflectance data are consistent with
changes in the colour of the sediment and can be related
more quantitatively to changes in the redox state of acidleachable Fe oxyhydroxides (Horneman et al., 2004). At site
L, the peat layer corresponds to an interval of particularly
low DR (<0.1) whereas values >0.7 (Fig. 3a) in the underly-
ing aquifer are typical for oxidized orange sediments. Values of DR < 0.25 in the grey sands at site H (Fig. 3b) are
consistent with more reducing conditions throughout the
7–44 m depth range (van Geen et al., 2006). An increase
in DR towards the bottom of the core at site H parallels
the observed change in colour and indicates a transition towards less reducing conditions.
4.2. Hydrochemistry
4.2.1. Site L
The hydrochemistry is distinctly different at the two
sites. As indicated by the Piper diagram in Fig. 4, the water
at site L can be classified as Ca–(Na)–Mg–HCO3 type,
whereas the water at site H belongs to a Ca–HCO3 type.
Low ClÀ concentration in combination with Ca over Mg
predominance is typical for deltaic groundwater (White
et al., 1963; Stüben et al., 2003) and the Red River (Berg
et al., 2008).
Concentrations of As in groundwater at site L range
from 0.9 to 7.8 lg/L and are below the WHO-limit of
10 lg/L. Concentrations remain very low throughout the
sandy aquifer, with 7.8 lg/L reached only in the gravel
layer (Fig. 5). Fifty to ninty percent of As in groundwater
is present as As(III) at site L. The pH (6.7 ± 0.2) is also quite
constant throughout the depth profile. The absence of NOÀ
3
and high dissolved Mn concentrations (1.1 ± 1.1 mg/L)
(Fig. 5) suggest that the groundwater at site L can be considered as Mn-reducing with regard to the classical redox
sequence, at least in the upper part of the profile. However,
the presence of dissolved Fe (1.8 ± 0.6 mg/L) throughout
the depth range and the decrease in dissolved S to
<0.4 mg/L below 30 m depth (Fig. 5) suggest some overlap
with reactions typically associated with more strongly
reducing conditions (sulphide and CH4 were not measured,
but the freshly pumped groundwater did not smell of H2 S).
The mean molar Fe/As ratio in the water at site L is very
high (>1000), although both Fe- and As-concentrations
are very low. The conductivity (230 ± 64 lS/cm) points towards relatively low mineralization in the aquifer at site L,
which is consistent with low concentrations of Ca
(25 ± 13 mg/L), Mg (21 ± 10 mg/L) and Ba (67 ± 32 lg/L)
3148
E. Eiche et al. / Applied Geochemistry 23 (2008) 3143–3154
Fig. 3. Depth profiles of grain size distribution in cumulative percentage of clay (<2 lm), silt (<63 lm), sand (>63 lm) and gravel (>2 mm), reflectance (DR
at 520 nm), concentration of As, Fe and TOC at site L (3a) and site H (3b).
compared to site H. Typical indicators of biodegradation
À
such as NHþ
4 (0.2 ± 0.1 mg/L), DOC (1.3 ± 0.6 mg/L), HCO3
(250 ± 80 mg/L) as well as Ptot (70 ± 40 lg/L) are generally
low in concentration (Fig. 5), suggesting limited organic
turnover in the aquifer at site L. The significant correlation
between the sum of Ca and Mg with HCOÀ
3 (r = 0.99, n = 9)
suggests that these 3 ions mainly originate from the dissolution of calcite and dolomite. Calcite (SIcalcite = À1 ± 0.6)
and dolomite (SIdolomite = À1.7 ± 1) are subsaturated, especially in the upper part of the aquifer at site L (Fig. 6a). The
corresponding molar ratio of [HCOÀ
3 ]/[Mg + Ca] $ 3 indicates, however, that sources other than carbonate dissolution contribute to the HCOÀ
3 in the groundwater.
4.2.2. Site H
In contrast to site L, As concentrations at site H are generally well above 10 lg/L and range from 170 to 600 lg/L
in the sandy aquifer. More than 90% of As in groundwater
occurs in the reduced As(III) form. The concentration of As
declines sharply to 7 lg/L (Fig. 5) in groundwater pumped
from the coarse gravel layer at the bottom of the section.
The pH (7.1 ± 0.1) at site H is slightly higher than at site
L. The groundwater is characterized by high concentrations
of dissolved Fe (14.5 ± 5.6 mg/L) although dissolved Mn
(0.8 ± 0.7 mg/L) levels are comparable to site L. Concentrations of NOÀ
3 and dissolved S are not detectable throughout
at site H (Fig. 5). There is a significant correlation between
dissolved Fe and Eh (r = 0.89, n = 9), suggesting reductive
dissolution of Fe-minerals in the aquifer at site H. The molar Fe/As-ratio of $100 in groundwater is comparable to
Fe/As ratios reported by Berg et al. (2008) in Van Phuc
and Thuong Cat for aquifers that are elevated in As. Concentrations of NHþ
4 (10 ± 7 mg/L), Ptot (0.6 ± 0.3 mg/L),
HCOÀ
(490
±
70
mg/L)
as well as DOC (2.59 ± 1.4 mg/L) all
3
suggest microbial degradation of organic material that is
most intense in the upper part of the profile at site H and
decreases in intensity with depth (Fig. 5). Higher conductivities (490 ± 40 lS/cm) measured at site H compared to
E. Eiche et al. / Applied Geochemistry 23 (2008) 3143–3154
3149
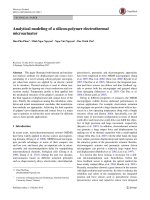
Fig. 6. Depth profiles of saturation indices of calcite, dolomite, siderite
and vivianite at site L (a) and site H (b).
Fig. 4. Piper diagram based on the hydrochemical data at site L (d) and H
(4). The groundwater can be classified as Ca–(Na)–Mg–HCO3 type at site
L, and as Ca–HCO3 type at site H.
site L points towards enhanced mineralization, especially
in the upper part of the profile (Fig. 5). Elevated concentrations of dissolved Ca (110 ± 15 mg/L) and Ba (590 ± 230 lg/
L) suggest dissolution of minerals such as gypsum or barite, which are both undersaturated over the entire profile
at site H (data not shown). However, the groundwater is
supersaturated with respect to calcite as well as dolomite
at this site (Fig. 6b). Since there is no correlation between
2þ
HCOÀ
and Mg2þ concentrations, ele3 and the sum of Ca
À
vated levels of HCO3 in shallow aquifers at site H are probably not the result of calcite or dolomite dissolution but,
instead, the product of mineralization of NOM. This interpretation is consistent with the significant correlation beþ
tween HCOÀ
3 and NH4 (r = 0.95, n = 9) as well as DOC
(r = 0.86, n = 9).
The composition of groundwater suggests the formation of new Fe phases at site H. There is a correlation be-
þ
Fig. 5. Depth profiles of dissolved As, Fe, Mn, DOC, total P, HCOÀ
3 , NH4 and total S (zero values: below detection limit of 5 lg/L) analysed in the groundwater
from site L (closed symbols) and site H (open symbols).
3150
E. Eiche et al. / Applied Geochemistry 23 (2008) 3143–3154
tween HCOÀ
3 concentrations and the saturation index for
siderite (r = 0.71, n = 8) as well as dissolved Fe and SIsiderite
(r = 0.95, n = 9). Siderite was detected in the XRD-measurements, and geochemical modelling shows that it is strongly
supersaturated throughout the profile (SIsiderite = 1.5 ± 0.3)
(Fig. 6b). This suggests siderite precipitation, despite reported slow kinetics at low temperatures (Postma, 1982).
Dissolved Fe concentrations also correlate well with P concentrations (r = 0.84, n = 8), suggesting that phosphate
originally adsorbed onto Fe oxide minerals may be released during the dissolution of these phases at site H.
The result is that groundwater at site H is also supersaturated with respect to vivianite (SIvivianite = 1.95 ± 0.5)
(Fig. 6b). Vivianite was detected in the sediment by XRD,
especially in the upper part of the profile.
The hydrochemistry of groundwater at the depth of the
gravel layer is broadly similar at both sites (Fig. 5). This
holds for dissolved As ($7 lg/L) as well as dissolved Fe
(2 mg/L) and Ptot (0.3–0.6 mg/L). The deepest groundwater
at both sites is supersaturated with respect to calcite and
dolomite, as in the shallower sandy aquifer at site L. The
concentration of dissolved S is significantly higher in
the gravel layer at site L compared to site H, however.
The overall patterns suggest that the composition of
groundwater at depth in Van Phuc may rather be controlled by region-wide flow through the Pleistocene gravel
layer than by differing local conditions.
4.3. Mineralogical and geochemical composition
The bulk mineralogical composition of the sediment at
site L and H is very similar. The dominant minerals are
quartz (A: 56 ± 19, B: 59 ± 15 wt.%), mica (19 ± 5,
17 ± 8 wt.%), feldspars (10 ± 6, 14 ± 6 wt.%) and kaolinite
(7 ± 2, 5 ± 3 wt.%). Variations in their relative proportions
with depth depend primarily on grain size. In clayey silt,
quartz (44 ± 12, 40 ± 7 wt.%) and feldspars (5 ± 1,
5 ± 1 wt.%) are less abundant, whereas in sand their
contribution is significantly higher (quartz: 74 ± 11,
65 ± 11 wt.%; feldspars: 14 ± 4, 15 ± 4 wt.%). The increase
is mainly at the expense of phyllosilicates like mica, chlorite, and kaolinite, which are much less abundant in the
sandy layers. The contribution of calcite and dolomite is
low to undetectable throughout the profiles and could be
quantified only in clayey silt ($1 wt.%). Fe minerals such
as hematite, goethite, and hornblende are present throughout at site L and in most intervals at site H but their
amounts could not be quantified. Minerals such as siderite,
ilmenite, vivianite, gibbsite and boehmite were detectable
in some but not all intervals at both sites. In the upper portion of site L, pyrite was detected in some samples.
The concentration of As in the solid phase at both sites
is within the typical range reported for unconsolidated
sediments (Smedley and Kinniburgh, 2002). Concentrations of 1–30 mg/kg As (Fig. 3) are also comparable to previous observations in alluvial systems in Bangladesh or
West Bengal where groundwater As levels are also elevated (e.g. Nickson et al., 2000; Swartz et al., 2004; Polizzotto et al., 2006). The concentration of solid As in the sandy
deposits is low at both sites with $5 mg/kg on average,
compared to higher values in the upper silty layers of
14.5 ± 7 mg/kg (Fig. 3). Concentrations of As in the solid
phase correlate with the silt content (rs = 0.81, n = 42) at
site L. No such relationship is observed at site H.
Concentrations of Fe in the solid phase ($5 wt.%) are
higher in the upper part of the profile at both sites compared to the underlying sandy aquifer (2 wt.%, Fig. 3).
Throughout the entire core from site L, there is also a clear
relationship between As and Fe concentrations in the solid
phase (rs = 0.74, n = 42). The relationship is weaker at site
H (rs = 0.62, n = 55). The molar Fe/As ratio in the solid
phase is slightly higher in the aquifer at site L
(4000 ± 1500) compared to site H (3200 ± 2000). The ratio
is within the range of 4200–4600 previously reported by
Berg et al. (2008) for sediments in contact with groundwater high in As in the region.
At both sites organic rich layers were found in the upper
part of the profile (Fig. 3). The TOC content is up to 4.5 wt.%
at site L but only up to 0.8 wt.% at site H. On average, the
concentration of TOC in the sandy deposits is below
0.03 wt.% at both sites. These values are in the same range
as previous TOC measurements for aquifers in the Hanoi
region of 0.04–0.74 wt.% and 0.02–2.5 wt.% by Postma
et al. (2007) and Berg et al. (2008), respectively.
4.4. Sequential extractions
4.4.1. Site L
In the sediment, As appears to be associated with different phases in the upper silty layer and in aquifer sands at
site L. In the silty sediment (A8120, A1410, Fig. 2), more
than 40% of As was released by phosphate-extraction (F2,
Table 2), a fraction associated with strong adsorption.
The HCl-extractable fraction is another important pool in
this interval (F3, 10–20%) and may represent other host
phases such as Mn-oxides, very amorphous Fe-oxides, siderite, vivianite and amorphous Al-oxides. A molar Fe:Al
ratio of 9:1 and the low quantities of Mn released in the
HCl-treatment compared to Fe and Al suggest that only
Fe phases contribute significantly. Additionally, the extractions indicate that sulphides and organic matter (F7) may
also contain significant levels of As (20–30%), which would
be consistent with elevated total S (TS) (0.2–0.6 wt.%) and
TOC (0.7–4 wt.%) concentrations in the upper layer. Compared to fractions F2, F3, and F7, other extractions did
not release significant quantities of As from silty sediment
at site L (Table 2). Iron was mainly released in the HCl-, HFand HNO3/H2O2-extraction steps (F3–F6–F7). Possible Fe
phases released by these extractions include very amorphous Fe-oxides (i.e., ferrihydrite), siderite, phyllosilicates
(i.e., chlorite and biotite), amphiboles and Fe sulfides (e.g.
pyrite). Extraction F3 may also include adsorbed Fe(II)
(Dixit and Hering, 2006).
In aquifer sands from site L, instead, little As was released by the phosphate extraction whereas more than
90% of As was released by HCl (F3: 35–54%) and DCB (F5:
25–65%, Table 2). The lack of correlation between Fe and
As released in F3 and F5 suggests non-Fe containing phases
may be significant hosts of As in aquifer sands at site L.
These may include amorphous Al-oxides, as suggested by
similar Fe and Al concentrations in F3 (3:2). All the other
extractions released minor or undetectable levels of As
3151
E. Eiche et al. / Applied Geochemistry 23 (2008) 3143–3154
Table 2
Average partitioning of Fe and As in each fraction of the sequential extraction for all samples from site L and H
Core L
Core H
Silt
F1
F2
F3
F4
F5
F6
F7
(SO4-step)
(PO4-step)
(HCl-step)
(Ox-step)
(DCB-step)
(HCl-step)
(HNO3/H2O2-step)
Total amount in sediments (average)
Sand
As (%)
Fe (%)
As (%)
Fe (%)
As (%)
Fe (%)
4
44
17
2
7
1
25
2
8
20
4
6
38
22
4
<1
46
<1
38
9
2
<1
3
14
5
35
41
<1
5
56
16
6
6
9
2
<1
8
16
8
32
37
<1
As (mg/kg)
Fe (g/kg)
As (mg/kg)
Fe (g/kg)
As (mg/kg)
Fe (g/kg)
41
23
2
19
8
23
(Table 2). Most of the Fe present in aquifer sands at site L
was released by DCB (13–48%) or HF (26–54%), suggesting
the dominance of crystalline Fe-oxides like hematite or
goethite, as well as Fe-containing silicates (Table 2).
4.4.2. Site H
In contrast to site L, strongly adsorbed As liberated by the
phosphate extraction was by far the dominant pool (F2:
>50%) throughout the sandy aquifer at site H (Table 2). Additional quantities of As were also extracted by HCl (F3:
10–20%) and HF (F6: $9%) solutions. The average molar
Fe:Al ratio of 5:2 in the solid phase suggests that amorphous
Al-oxides are probably less important at site H than at site L.
Contributions of As from other extractions were minor.
At site H, concentrations of Fe in the sediment extractable with DCB and HF are roughly balanced (32–37%) and
larger than in the HCl-extractable pool (16%, Table 2).
These observations indicate that Fe is mainly bound in
crystalline phases like oxides and silicates (hematite, biotite, hornblende, etc.) as well as amorphous phases. Some
Fe is also released by the phosphate extraction ($ 8%), indicating that Fe(II) might also be adsorbed to mineral surfaces, and by the oxalate-extraction ($ 8%).
5. Discussion
5.1. Association of arsenic in the sediment
The main difference in sediment geochemistry between
the two sites is the extent of reduction of Fe oxhydroxides
which, as inferred from colour and reflectance, is much
more pronounced in all but the deepest sandy interval at
site H compared to site L. In Bangladesh, DR values ranging
from <0.1 to $1 correspond to leachable Fe(II)/Fe ratios
ranging from >0.9 to $0.1, respectively (Horneman et al.,
2004). There are no other significant mineralogical differences between the two sites, as previously reported elsewhere for aquifers associated with contrasting levels of
As in groundwater (Pal et al., 2002; van Geen et al.,
2008a). The presence of crystalline Fe(III) oxides like
hematite inferred from the sequential extractions is consistent with the brown colour and reflectance of aquifer
sands at site L (DR > 0.7) (Fig. 3a). The sequential extractions indicate that most of the As in the sediment is associated with these crystalline Fe(III) oxides at site L (Table 2)
and, based on the dissolved As profiles, is relatively insoluble. Similar associations have previously been reported
for deeper Pleistocene aquifers of Bangladesh (BGS/DPHE,
2001; Harvey et al., 2002; Swartz et al., 2004; Zheng
et al., 2005; Stollenwerk et al., 2007).
In contrast, amorphous Fe phases of mixed Fe(II/III) valence are indicated by the grey colour and low DR values
(<0.25) of aquifer sands at site H (Fig. 3b). The sequential
extraction data indicate that As is primarily adsorbed to
these phases (Table 2) and, arguably for that reason, also
elevated in groundwater (Zheng et al., 2005; van Geen
et al., 2006; van Geen et al., 2008a). Elevated Fe(II)/Fe ratios and high concentrations of P-extractable As in grey
aquifer sands measured at several nearby locations (van
Geen et al., 2008b, 2008a) indicate that conditions at site
H are representative of the larger area within Van Phuc
where groundwater As concentrations are elevated. The
high proportion of adsorbed As in reducing sands is consistent with previous observations by Berg et al. (2008) in this
and other areas of Vietnam based on a simplified version of
the extraction scheme of Keon et al. (2001). Postma et al.
(2007) concluded from their analysis of aquifer sediment
from a shallow grey aquifer near the Red River associated
with elevated dissolved As that, rather than being adsorbed, As in the solid phase is primarily bound within
the lattice of Fe-oxides. The step in their extraction scheme
used to identify adsorbed As relies on a 10-fold lower P
concentration (Wenzel et al., 2001), which may explain
the different attribution.
5.2. Factors contributing to arsenic release and retention
Whereas contrasting redox conditions between sandy
aquifers at the two sites are likely to play a role, there is
no simple correlation at site H between As and other constituents of groundwater indicative of microbially induced
À
Fe-oxide reduction such as dissolved Fe, NHþ
4 or HCO3 . One
potential confounding factor is competitive adsorption of
As with PO3À
(Su and Pulse, 2001; Dixit and Hering,
4
2003; Radu et al., 2005) and HCOÀ
3 . Dissolved P concentrations are at least an order of magnitude higher at site H
compared to site L, and HCOÀ
3 levels up to threefold higher
(Fig. 5). The sequential extraction data show that very little
As is adsorbed at site L, however, suggesting that other
factors control the release of As to groundwater at this
3152
E. Eiche et al. / Applied Geochemistry 23 (2008) 3143–3154
location. There is no clear correlation between dissolved As
and P levels even within the profile at site H. Whereas
HCOÀ
3 levels are also generally higher at site H than at site
L, the influence of HCOÀ
3 on the adsorption of As remains
unclear Apello et al. (2002) and Anawar et al. (2004) concluded from their experiments that high concentrations
of HCOÀ
3 result in considerable desorption of As. Meng
et al. (2000) as well as Radu et al. (2005) could not confirm
these results in their studies, however.
The precipitation of secondary mineral phases may be
another reason why processes that are likely to influence
the partitioning of As between groundwater and aquifer
particles are difficult to separate. Several studies have
pointed out that siderite can adsorb As or co-precipitate
with As (Anawar et al., 2004; Sengupta et al., 2004; Guo
et al., 2007). Siderite as well as vivianite are both supersaturated at site H and therefore likely to precipitate (Fig. 6).
The reflectance data suggest the formation of amorphous
Fe(II)–As(III)-phases at site H and these may have a relatively low affinity for As (Swartz et al., 2004; Horneman
et al., 2004; van Geen et al., 2004; Herbel and Fendorf,
2006; Pedersen et al., 2006; Dixit and Hering, 2006; Coker
et al., 2006). Dixit and Hering (2006) provided evidence
that sorption of As(III) on Fe-minerals is enhanced at higher Fe(II) concentrations, which is the case between 20 and
35 m at site H (Fig. 5), leading to surface-precipitation of
Fe(II)–As(III)-bearing phases. On the other hand, the formation of sulphide phases suggested by low dissolved S
levels in portions of the aquifer at both sites could result
in the loss of As from groundwater (Lowers et al., 2007).
5.3. Source of organic matter resulting in reducing conditions
The geochemistry of the sediment and groundwater at
sites H and L shows that both aquifers are reducing,
although to a different extent. This raises the question of
the origin of this contrast in redox conditions. The concentration of NHþ
4 , a good indicator of the intensity of NOM
degradation (Postma et al., 2007), is much higher at site
H (<34 mg/L) compared to site L (<1 mg/L). The depth profiles, therefore, suggest a higher NOM-accessibility at site
H compared to site L that is consistent with a more advanced state of reduction. The TOC content of sandy intervals at both sites is comparable and fairly low (L:
0.03 wt.%; H: 0.02 wt.%), which means that the nature of
the organic matter would have to be different to account
for the observed contrast.
An alternative explanation is that the reactive organic
matter reaching sandy aquifers originates primarily from
intercalated confining layers (Chapelle and Bradley, 1996;
McMahon, 2001). Peat layers have been documented in
the Hanoi area and seem to be a common feature (Berg
et al., 2001, 2008; Tanabe et al., 2003). The upper layer at
site L contains intervals elevated in TOC (Fig. 3a), but concentrations are lower on average compared to site H (0.15
vs. 0.29 wt.%, respectively). At site L, however, this NOM is
embedded within a thick silt layer and sealed from the
underlying aquifer by Fe concretion. Combined with low
NHþ
4 concentrations even in the shallowest well at site L,
this suggests little downward transport of the NOM contained in the upper silt layer at site L. At site H instead,
the NOM-rich layers are separated from the aquifer by only
À
thin silt lenses and NHþ
4 , HCO3 , Ptot and DOC concentrations are all elevated in the shallowest portion of the aquifer (Fig. 5). The contrast in redox conditions between sites
H and L could therefore plausibly be related to enhanced
downward transport of organic matter from the top silt
layer at site H which is in accordance with the interpretation of Berg et al. (2008). Further study will be required to
confirm such a link. The penetration of bomb-produced 3H
in the sandy aquifers at site H and the absence of 3H at site
L (unpublished data, F. Frei and R. Kipfer) might be another
indication of a greater supply of reactive organic matter to
those aquifers of Van Phuc that are elevated in As.
6. Conclusions
The data presented in this paper show that the sharp
contrast in dissolved As concentrations between two portions of a single village on the banks of the Red River cannot be explained by major differences in bulk
geochemistry or mineralogy of the sediment. Even if total
concentrations of As in sandy parts of the sediment at both
sites are comparable, the form and availability of As in
aquifer particles is markedly different. At site H, concentrations of dissolved As in groundwater are elevated and As in
the solid phase is primarily adsorbed to grey sands of
mixed Fe(II/III) valence. The lithology and hydrochemistry
of this site suggest that the strongly reducing nature of the
aquifers at site H is related to a considerable supply of
reactive NOM to the upper portion of the aquifer. At site
L instead, As is not adsorbed but more tightly bound
mostly within orange-brown Fe(III) oxides. Less reducing
conditions at site L inferred from sediment colour and
reflectance are consistent with a limited supply of reactive
NOM to this location indicated by low levels of Fe, NHþ
4,
HCOÀ
3 and DOC in groundwater compared to site H. Extensive reduction of Fe oxhydroxides in the solid phase appears to be a key step for the release of As to
groundwater in Vietnam, although the importance of other
contributing factors, such as hydrogeology and the quality
of NOM, has yet to be resolved.
Acknowledgements
We acknowledge our colleagues from the Institute for
Mineralogy and Geochemistry for analytical support: Utz
Kramar (XRF), Beate Oetzel (XRD) and Claudia Mössner
(ICP-MS). A special thank to Caroline Stengel who analysed
the groundwater samples at Eawag, Switzerland. We are
also very grateful to the colleagues at CETASD and HUMG,
in particular Tran Nghi, Do Minh Duc, Vi Mai Lan, Dao
Manh Phu, Bui Hong Nhat and Pham Qui Nhan for their
assistance during the field campaign and the villagers
and authorities of Van Phuc for their hospitality. Thanks
also to Felix Frei, Zahid Aziz, Kathleen A. Radloff, and
Hun-Bok Jung for their participation in the field campaign.
For financial support we thank the International Bureau of
the German Ministry of Education and Research (BMBF)
and the LGK-BW. US-based involvement was funded by
NSF Grant EAR 0345688.
E. Eiche et al. / Applied Geochemistry 23 (2008) 3143–3154
References
Anawar, H.M., Akai, J., Sakugawa, H., 2004. Mobilization of arsenic from
subsurface sediments by effect of bicarbonate ions in groundwater.
Chemosphere 54, 753–762.
Apello, C.A.J., Van der Weiden, M.J.J., Tournassat, C., Charlet, L., 2002.
Surface complexation of ferrous iron and carbonate on ferrihydrite
and the mobilization of arsenic. Environ. Sci. Technol. 36, 3096–3103.
Berg, M., Tran, H.C., Nguyen, T.C., Pham, H.V., Schertenleib, R., Giger, W.,
2001. Arsenic contamination of groundwater and drinking water in
Vietnam: a human health threat. Environ. Sci. Technol. 35, 2621–
2626.
Berg, M., Luzi, S., Trang, P.T.K., Viet, P.H., Giger, W., Stüben, D., 2006.
Arsenic removal from groundwater by household sand filters –
comparative field study, model calculations, and health benefits.
Environ. Sci. Technol. 40, 5567–5573.
Berg, M., Stengel, C., Trang, P.T.K., Viet, P.H., Sampson, M.L., Leng, M.,
Samreth, S., Fredericks, D., 2007. Magnitude of arsenic pollution in the
Mekong and Red River Deltas – Cambodia and Vietnam. Sci. Total
Environ. 372, 413–425.
Berg, M., Trang, P.T.K., Stengel, C., Buschmann, J., Viet, P.H., Dan, N.V.,
Giger, W., Stüben, D., 2008. Hydrological and sedimentary controls
leading to arsenic contamination of groundwater in the Hanoi area,
Vietnam: the impact of iron–arsenic ratios, peat, river bank deposits,
and excessive groundwater abstraction. Chem. Geol. 249, 91–112.
Beyer, W., 1964. Zur Bestimmung der Wasserdurchlässigkeit von Kiesen
und Sanden aus der Kornverteilungskurve. WasserwirtschaftWassertechnik 14, 165–168.
BGS, DPHE, 2001. Arsenic contamination of groundwater in Bangladesh.
In: Kinniburg, D.G., Smedley, P.L. (Eds.), Final Report, BGS Technical
Report WC/00/19, vol. 2. British Geological Survey, Keyworth, UK.
Bukau, G., Artinger, R., Geyer, S., Wolf, M., Fritz, P., Kim, J.I., 2000.
Groundwater in-situ generation of aquatic humic and fulvic acids and
the mineralization of sedimentary organic carbon. Appl. Geochem. 15,
819–832.
Buschmann, J., Berg, M., Stengel, C., Sampson, M.L., 2007. Arsenic and
manganese contamination of drinking water resources in Cambodia:
coincidence of risk areas with low relief topography. Environ. Sci.
Technol. 41, 2146–2152.
Buschmann, J., Berg, M., Stengel, C., Winkel, L., Sampson, M.L., Trang,
P.T.K., Viet, P.H., 2008. Contamination of drinking water resources in
the Mekong delta floodplains: arsenic and other trace metals pose
serious health risks to population. Environ. Int. 34, 756–764.
Chapelle, F.H., Bradley, P.B., 1996. Microbial acetogenesis as a source of
organic acids in ancient Atlantic Coastal Plain sediments. Geology 24,
925–928.
Charlet, L., Polya, D.A., 2006. Arsenic in shallow, reducing groundwaters in
Southern Asia: an environmental health disaster. Elements 2, 91–96.
Chowdhury, T.R., Basu, G.K., Mandal, B.K., Biswas, B.K., Samanta, G.,
Chowdhury, U.K., Chanda, C.R., Lodh, D., Roy, S.L., Saha, K.C., Roy, S.,
Kabir, S., Quamruzzaman, Q., Chakrabort, D., 1999. Arsenic poisoning
in the Ganges Delta. Nature 401, 545–546.
Coker, V.S., Gault, A.G., Pearce, C.I., van der Laan, G., Telling, N.D.,
Charnock, J.M., Polya, D.A., Lloyd, J.R., 2006. XAS and XMCD evidence
for species-dependent partitioning of arsenic during microbial
reduction of ferrihydrite to magnetite. Environ. Sci. Technol. 40,
7745–7750.
Das, D., Samanta, G., Mandal, B.K., Chowdhury, T.R., Chanda, C.R.,
Chowdhury, P.P., Basu, G.K., Chakraborti, D., 1996. Arsenic in
groundwater in six districts of West-Bengal, India. Environ.
Geochem. Health 18, 5–15.
Del Razo, L.M., Arellano, M.A., Cebrián, M.E., 1990. The oxidation states of
arsenic in well-water from a chronic arsenicism area of northern
Mexico. Environ. Pollut. 64, 143–153.
Dixit, S., Hering, J.G., 2003. Comparison of arsenic(V) and arsenic(III)
sorption onto iron oxide minerals: implications for arsenic mobility.
Environ. Sci. Technol. 37, 4182–4189.
Dixit, S., Hering, J.G., 2006. Sorption of Fe(II) and As(III) on goethite in
single- and dual-sorbate systems. Chem. Geol. 228, 6–15.
Dowling, C.B., Poreda, R.J., Basu, A.R., Peters, S.L., Aggarwal, P.K., 2002.
Geochemical study of arsenic release mechanisms in the Bengal Basin
groundwater. Water Resour. Res. 38, 1173.
Guo, H., Stüben, D., Berner, Z., 2007. Adsorption of arsenic(III) and
arsenic(V) from groundwater using natural siderite as the adsorbent.
J. Colloilds Interf. Sci. 315, 47–53.
Harvey, C.F., Swartz, C.H., Badruzzaman, A.B.M., Keon-Blute, N., Yu, W.,
Ashraf Ali, M., Jay, J., Beckie, R., Niedan, V., Brabander, D., Oates, P.M.,
Ashfaque, K.N., Islam, S., Hemond, H.F., Ahmed, M.F., 2002. Arsenic
3153
mobility and groundwater extraction in Bangladesh. Science 298,
1602–1606.
Herbel, M., Fendorf, S., 2006. Biogeochemical processes controlling the
speciation and transport of arsenic within iron coated sand. Chem.
Geol. 228, 16–32.
Horneman, A., Van Geen, A., Kent, D.V., Mathe, P.E., Zheng, Y., Dhar, R.K.,
´ Connell, S.O., Hoque, M.A., Aziz, Z., Shamsudduha, M., Seddique, A.A.,
O
Ahmed, K.M., 2004. Decoupling of As and Fe release to Bangladesh
groundwater under reducing conditions. Part I: evidence from
sediment profiles. Geochim. Cosmochim. Acta 68, 3459–3473.
Keon, N.E., Swartz, C.H., Brabander, D.J., Harvey, C., Hemond, H.F., 2001.
Validation of an arsenic sequential extraction method for evaluating
mobility in sediments. Environ. Sci. Technol. 35, 2778–2784.
Larson, F., Nhan, P.Q., Nhan, D.D., Postma, D., Jessen, S., Vietn, P.H., Thao,
N.B., Huy, T.D., Hoan, N., Chambon, J., Hoan, N.V., Dang, H.H., Nguyen,
H.T., Mai, D.T., 2008. Controlling geological and hydrogeological
processes in an arsenic contaminated aquifer on the Red River flood
plain, Vietnam. Appl. Geochem. 23 (11), 3099–3115.
Lovley, D.R., 1992. Microbial oxidation of organic matter coupled to the
reduction of Fe(III) and Mn(IV) oxides. Catena Suppl. 21, 101–114.
Lovley, D.R., Chapelle, F.H., 1995. Deep subsurface microbial processes.
Rev. Geophys. 33, 365–381.
Lowers, H.A., Breit, G.N., Foster, A.L., Whitney, J., Yount, J., Uddin, M.N.,
Muneem, A.A., 2007. Arsenic incorporation into authigenic pyrite,
Bengal Basin sediment, Bangladesh. Geochim. Cosmochim. Acta 71,
2699–2717.
Mathers, S., Zalasiewicz, J., 1999. Holocene sedimentary architecture of
the Red River Delta, Vietnam. J. Coast. Res. 15, 314–325.
McAthur, J.M., Ravenscroft, P., Safiullah, S., Thirlwall, M.F., 2001. Arsenic
in groundwater: testing pollution mechanisms for sedimentary
aquifers in Bangladesh. Water Resour. Res. 37, 109–117.
McAthur, J.M., Banerjee, D.M., Hudson-Edwards, K.A., Mishra, R., Purohit,
R., Ravencroft, P., Cronin, A., Howarh, R.J., Chatterjee, A., Talukder, T.,
Lowry, D., Houghton, S., Chadha, D.K., 2004. Natural organic matter in
sedimentary basins and its relation to arsenic in anoxic ground water:
the examples of West Bengal and its worldwide implications. Appl.
Geochem. 19, 1255–1293.
McMahon, P.B., 2001. Aquifer/aquitard interfaces: mixing zones that
enhance biogeochemical reactions. Hydrogeol. J. 9, 34–43.
Meng, X., Bang, S., Korfiatis, G.P., 2000. Effects of silicate, sulfate and
carbonate on arsenic removal by ferric chloride. Water Res. 34, 1255–
1261.
Meng, X., Korfiatis, G.P., Christodoulatos, C., Bang, S., 2001. Treatment of
arsenic in Bangladesh well water using a household co-precipitation
and filtration system. Water Res. 35, 2805–2810.
Nickson, R.T., McArthur, J.M., Ravenscroft, P., Burgess, W.G., Ahmed, K.M.,
2000. Mechanisms of arsenic release to groundwater, Bangladesh and
West Bengal. Appl. Geochem. 15, 403–413.
Nicolli, H.B., Suriano, J.M., Peral, M.A.G., Ferpozzi, L.H., Baleani, O.A., 1989.
Groundwater contamination with arsenic and other trace-elements in
an area of the Pampa, province of Córdoba, Argentina. Environ. Geol.
Water Sci. 14, 3–6.
Pal, T., Mukherjee, P.K., Sengupte, S., 2002. Nature of arsenic pollutants in
groundwater of Bengal Delta – a case study from Baruipur area, West
Bengal, India. Curr. Sci. 82, 554–561.
Parkhurst, D.L., Appelo, C.A., 1999. User´s guide to PHREEQC (version 2) – a
computer program for speciation, reaction-path, 1D-transport, and
inverse geochemical calculations. US Geol. Surv. Water Resour. Invest.
Rep., pp. 99–4259.
Pedersen, H.D., Postma, D., Jakobsen, R., 2006. Release of arsenic
associated with the reduction and transformation of iron oxides.
Geochim. Cosmochim. Acta 70, 4116–4129.
Polizzotto, M.L., Harvey, C.F., Li, G., Badruzzman, B., Ali, A., Newville, M.,
Sutton, S., Fendorf, S., 2006. Solid-phases and desorption processes of
arsenic within Bangladesh sediments. Chem. Geol. 228, 97–111.
Polya, D.A., Gault, A.G., Diebe, N., Feldmann, P., Rosenboom, J.W., Gilligan,
E., Fredericks, D., Milton, A.H., Sampson, M., Rowland, H.A.L., Lythgoe,
P.R., Jones, J.C., Middleton, C., Cooke, D.A., 2005. Arsenic hazard in
shallow Cambodian groundwaters. Mineral. Mag. 69, 807–823.
Postma, D., 1982. Pyrite and siderite formation in brackish and freshwater
swamp sediments. Am. J. Sci. 282, 1151–1183.
Postma, D., Larsen, F., Hue, N.T.M., Duc, M.T., Viet, P.H., Nhan, P.Q., Jessen,
S., 2007. Arsenic in groundwater of the Red River floodplain, Vietnam:
controlling geochemical processes and reactive transport modelling.
Geochim. Cosmochim. Acta 71, 5054–5071.
Radu, T., Subacz, J.L., Phillippi, J.M., Barnett, M.O., 2005. Effects of
dissolved carbonate on arsenic adsorption and mobility. Environ.
Sci. Technol. 39, 7875–7882.
3154
E. Eiche et al. / Applied Geochemistry 23 (2008) 3143–3154
Rowland, H.A.L., Polya, D.A., Lloyd, J.R., Pancost, R.D., 2006.
Characterisation of organic matter in a shallow, reducing, arsenicrich aquifer, West Bengal. Org. Geochem. 37, 1101–1114.
Rowland, H.A.L., Pederick, R.L., Polya, D.A., Pancost, R.A., van Dongen, B.E.,
Gault, A.G., Bryant, C., Anderson, B., Charnock, J.M., Vaughan, D.J.,
Lloyd, J.R., 2007. Control of organic matter type of microbially
mediated release of arsenic from contrasting shallow aquifer
sediments from Cambodia. Geobiology 5, 281–292.
Rowland, H.A.L., Gault, A.G., Lythgoe, P., Polya, D.A., 2008. Geochemistry
of aquifer sediments and arsenic-rich groundwaters from Kandal
Province, Cambodia. Appl. Geochem. 23 (11), 3029–3046.
Sengupta, S., Mukherjee, P.-K., Pal, T., Shome, S., 2004. Nature and origin
of arsenic carriers in shallow aquifer sediments of Bengal Delta, India.
Environ. Geol. 45, 1071–1081.
Smedley, P.L., Kinniburgh, D.G., 2002. A review of the source, behaviour
and distribution of arsenic in natural waters. Appl. Geochem. 17, 517–
568.
Snyder, R.L., Bish, D.L., 1989. Quantitative analysis. In: Bish, D.L., Post, J.E.
(Eds.), Modern Powder Diffraction. Reviews in Mineralogy, vol. 20.
Mineralogical Society of America, pp. 101–144.
Stollenwerk, K.G., Breit, G.N., Welch, A.H., Yount, J.C., Whitney, J.W.,
Foster, A.L., Uddin, M.N., Majumder, R.K., Ahmed, N., 2007. Arsenic
attenuation by oxidized aquifer sediments in Bangladesh. Sci. Total
Environ. 379, 133–150.
Stüben, D., Berner, Z., Chandrasekharam, D., Karmakar, J., 2003. Arsenic
enrichment in groundwater of West Bengal, India: geochemical
evidence for mobilization of As under reducing conditions. Appl.
Geochem. 18, 1417–1434.
Stute, M., Zheng, Y., Schlosser, P., Horneman, A., Dhar, R.K., Datta, S.,
Hoque, M.A., Seddique, A.A., Shamsudduha Ahmed, K.M., Van Geen, A.,
2007. Hydrological control of As concentrations in Bangladesh
groundwater. Water Resour. Res. 43, W09417.
Su, C., Pulse, R.W., 2001. Arsenate and arsenite removal by zerovalent
iron: effects of phosphate, silicate, carbonate, borate, sulphate,
chromate, molybdate and nitrate, relative to chloride. Environ. Sci.
Technol. 35, 4562–4568.
Swartz, C.H., Blute, N.K., Badruzzman, B., Ali, A., Barbander, D., Jay, J.,
Besancon, J., Islam, S., Hemond, H.F., Harvey, C.D., 2004. Mobility of
arsenic in a Bangladesh aquifer: Inferences from geochemical profiles
leaching data and mineralogical characterisation. Geochim.
Cosmochim. Acta 68, 4539–4557.
Tanabe, S., Hori, K., Saito, Y., Haruyama, S., Vu, V.P., Kitamura, A., 2003.
Song Hong (Red River) delta evolution related to millenniumscale Holocene sea-level changes. Quaternary Sci. Rev. 22, 2345–
2361.
Tanabe, S., Saito, Y., Vu, Q.L., Hanebuth, T.J.J., Ngo, Q.L., Kitamura, A., 2006.
Holocene evolution of the Song Hong (Red River) delta system,
northern Vietnam. Sediment. Geol. 187, 29–61.
Trafford, J.M., Lawrence, A.R., Macdonald, D.M.J., Nguyen, V.D., Tran, D.N.,
Nguyen, T.H., 1996. The effect of urbanisation on groundwater quality
beneath the city of Hanoi, Vietnam. BGS Technical Report WC/96/22.
British Geological Survey, Keyworth, UK.
Tseng, W.P., Chu, H.M., How, S.W., Fong, J.M., Lin, C.S., Yeh, S., 1968.
Prevalence of skin cancer in an endemic area of chronic arsenicism in
Taiwan. J. Nat. Cancer Inst. 40, 239–254.
van Geen, A., Zheng, Y., Versteeg, R., Stute, M., Horneman, A., Dhar, R.,
Steckler, M., Gelman, A., Small, C., Ahsan, H., Graiano, J.H., Hussain, I.,
Ahmed, K.M., 2003. Spatial variability of arsenic in 6000 tube wells in
a 25 km2 area of Bangladesh. Water Resour. Res. 39, 1140.
van Geen, A., Rose, J., Thoral, S., Garnier, J.M., Zheng, Y., Bottero, J.Y., 2004.
Decoupling of As and Fe release to Bangladesh groundwater under
reducing conditions. Part II: evidence from sediment incubations..
Geochim. Cosmochim. Acta 68, 3475–3486.
van Geen, A., Zheng, Y., Cheng, Z., Aziz, Z., Horneman, A., Dhar, R.K.,
Mailloux, B., Stute, M., Weinman, B., Goodbred, S., Seddique, A.A.,
Hoque, M.A., Ahmed, K.M., 2006. A transect of groundwater and
sediment properties in Araihazar, Bangladesh: further evidence of
decoupling between As and Fe mobilization. Chem. Geol. 228, 85–96.
van Geen, A., Zheng, Y., Goodbred Jr., S., Horneman, A., Aziz, Z., Cheng, Z.,
Stute, M., Mailloux, B., Weinman, B., Hoque, M.A., Seddique, A.A.,
Hossain, M.S., Chowdhury, S.H., Ahmed, K.M., 2008a. Flushing history
as a hydrogeological control on the regional distribution of arsenic in
shallow groundwater of the Bengal Basin. Environ. Sci. Technol. 42,
2283–2288.
van Geen, A., Radloff, K., Aziz, Z., Cheng, Z., Huq, M.R., Ahmed, K.M.,
Weinman, B., Goodbred, S., Jung, H.B., Zheng, Y., Berg, M., Trang, P.T.K.,
Charlet, L., Metral, J., Tisserand, D., Guillot, S., Chakraborty, S., Gajurel,
A.P., Upreti, B.N., 2008b. Comparison of arsenic concentrations in
simultaneously-collected groundwater and aquifer particles from
Bangladesh, India, Vietnam, and Nepal. Appl. Geochem. 23 (11),
3244–3251.
van Herreweghe, S., Swennen, R., Vandecasteele, C., Cappuyns, V., 2003.
Solid phase speciation of arsenic by sequential extraction in standard
reference materials and industrially contaminated soil samples.
Environ. Pollut. 122, 323–342.
Wenzel, W.W., Kirchbaumr, N., Prohaska, T., Stingeder, G., Lombic, E.,
Adriano, D.C., 2001. Arsenic fractionation in soils using an improved
sequential extraction procedure. Anal. Chim. Acta 436, 309–323.
White, D.E., Hem, J.D., Waring, G.A., 1963. Chemical composition of
subsurface water. Data of Geochemistry. US Geological Survey.
Winkel, L., Berg, M., Amini, M., Hug, S.J., Johnson, C.A., 2008a. Predicting
groundwater arsenic contamination in Southeast Asia from surface
parameters. Nature Geosci. 1, 536–542.
Winkel, L., Berg, M., Stengel, C., Rosenberg, T., 2008b. Hydrogeological
survey assessing arsenic and other groundwater contaminants in the
lowlands of Sumatra, Indonesia. Appl. Geochem. 23 (11), 3019–3028.
Zaldivar, B.J., 1974. Arsenic contamination of drinking water and
foodstuffs causing endemic chronic poisoning. Beitr. Pathol. 151,
384–400.
Zheng, Y., Stute, M., van Geen, A., Gavrieli, I., Dhar, R., Simpson, H.R.,
Schlosser, P., Ahmed, K.M., 2004. Redox control of arsenic
mobilization in Bangladesh groundwater. Appl. Geochem. 19, 201–
214.
Zheng, Y., van Geen, A., Stute, M., Dhar, R., Mo, Z., Cheng, Z., Horneman, A.,
Gavrieli, I., Simpson, H.J., Versteeg, R., Steckler, M., Grazioli-Venier, A.,
Goodbred, S., Shahnewaz, M., Shamsudduha, M., Hoque, M.A., Ahmed,
K.M., 2005. Geochemical and hydrogeological contrasts between
shallow and deeper aquifers in two villages of Araihazar,
Bangladesh: implications for deeper aquifers as drinking water
sources. Geochim. Cosmochim. Acta 69, 5203–5218.