DSpace at VNU: Genetic polymorphisms in AS3MT and arsenic metabolism in residents of the Red River Delta, Vietnam
Bạn đang xem bản rút gọn của tài liệu. Xem và tải ngay bản đầy đủ của tài liệu tại đây (1.02 MB, 11 trang )
Toxicology and Applied Pharmacology 236 (2009) 131–141
Contents lists available at ScienceDirect
Toxicology and Applied Pharmacology
j o u r n a l h o m e p a g e : w w w. e l s ev i e r. c o m / l o c a t e / y t a a p
Genetic polymorphisms in AS3MT and arsenic metabolism in residents of the Red
River Delta, Vietnam
Tetsuro Agusa a,b, Hisato Iwata a,⁎, Junko Fujihara b, Takashi Kunito c, Haruo Takeshita b, Tu Binh Minh a,d,
Pham Thi Kim Trang d, Pham Hung Viet d, Shinsuke Tanabe a
a
Center for Marine Environmental Studies (CMES), Ehime University, Bunkyo-cho 2-5, Matsuyama 790-8577, Japan
Department of Legal Medicine, Shimane University Faculty of Medicine, Enya 89-1, Izumo 693-8501, Japan
Department of Environmental Sciences, Faculty of Science, Shinshu University, 3-1-1 Asahi, Matsumoto 390-8621, Japan
d
Center for Environmental Technology and Sustainable Development (CETASD), Hanoi University of Science, Vietnam National University, T3 Building, 334 Nguyen Trai Street,
Thanh Xuan District, Hanoi, Vietnam
b
c
a r t i c l e
i n f o
Article history:
Received 9 December 2008
Revised 23 January 2009
Accepted 25 January 2009
Available online 31 January 2009
Keywords:
Arsenic
AS3MT
Polymorphism
SNP
Vietnam
Groundwater
Sand-filtered water
Human urine
Human hair
a b s t r a c t
To elucidate the role of genetic factors in arsenic (As) metabolism, we studied associations of single nucleotide
polymorphisms (SNPs) in As (+3 oxidation state) methyltransferase (AS3MT) with the As concentrations in hair
and urine, and urinary As profile in residents in the Red River Delta, Vietnam. Concentrations of total As in
groundwater were 0.7–502 μg/l. Total As levels in groundwater drastically decreased by using sand filter,
indicating that the filter could be effective to remove As from raw groundwater. Concentrations of inorganic As
(IAs) in urine and total As in hair of males were higher than those of females. A significant positive correlation
between monomethylarsonic acid (MMA)/IAs and age in females indicates that older females have higher
methylation capacity from IAs to MMA. Body mass index negatively correlated with urinary As concentrations in
males. Homozygote for SNPs 4602AA, 35991GG, and 37853GG, which showed strong linkage disequilibrium
(LD), had higher percentage (%) of dimethylarsinic acid (DMA) in urine. SNPs 4740 and 12590 had strong LD and
associated with urinary %DMA. Although SNPs 6144,12390,14215, and 35587 comprised LD cluster, homozygotes
in SNPs 12390GG and 35587CC had lower DMA/MMA in urine, suggesting low methylation capacity from MMA
to DMA in homo types for these SNPs. SNPs 5913 and 8973 correlated with %MMA and %DMA, respectively.
Heterozygote for SNP 14458TC had higher MMA/IAs in urine than TT homozygote, indicating that the
heterozygote may have stronger methylation ability of IAs. To our knowledge, this is the first study on the
association of genetic factors with As metabolism in Vietnamese.
© 2009 Elsevier Inc. All rights reserved.
Introduction
Consumption of arsenic (As)-polluted groundwater has adversely
affected human health in certain areas of the world (Mandal and
Suzuki, 2002; Nordstrom, 2002; Smedley and Kinniburgh, 2002).
Recently, Berg et al. (2001) and Agusa et al. (2004, 2005, 2006, 2007,
2009) reported elevated As contamination (up to 3150 μg/l) in
groundwater of the Red River Delta in Northern Vietnam; many
groundwater samples contained As over the WHO drinking water
guideline (10 μg/l) (WHO, 2004).
It is known that As exposure causes lung and skin cancers and also
birth defects (WHO, 2004). There seems to be a wide variation in the
susceptibility to As toxicity among individuals and populations, which
is probably related to genetic factors in metabolism of As (Vahter,
2002). It has been generally accepted that inorganic As is oxidatively
methylated in the body (Challenger, 1945; Cullen and Reimer, 1989),
but recently reductive methylation pathway has also been proposed
⁎ Corresponding author. Fax: +81 89 927 8172.
E-mail address: (H. Iwata).
0041-008X/$ – see front matter © 2009 Elsevier Inc. All rights reserved.
doi:10.1016/j.taap.2009.01.015
(Hayakawa et al., 2005; Naranmandura et al., 2006). In either case,
methylation is a critical metabolic pathway for As biotransformation,
since the toxicity of organic As is generally lower than that of
inorganic forms, and also the methylated As would be readily excreted
into the urine. In these processes, As (+ 3 oxidation state) methyltransferase (AS3MT), an S-adenosyl- L -methionine-dependent
enzyme, catalyzes the methylation of arsenite (AsIII) and monomethyl
As (Lin et al., 2002; Wood et al., 2006). It is known that human AS3MT
gene is approximately 32-kb long and is composed of 11 exons (Wood
et al., 2006).
It has been reported that there are some single nucleotide
polymorphisms (SNPs) in human AS3MT (Wood et al., 2006).
Recombinant 173Ala N Trp (Ala to Trp substitution at amino acid base
173), 287Met N Thr, and 306Thr N Ile variants in AS3MT significantly
altered levels of the enzyme activity and immunoreactive protein
(Wood et al., 2006). 287Met N Thr heterozygote was linked with
increased percentage of monomethylarsonic acid (MMA) in urine of
central European population (Lindberg et al., 2007) and miners in
Chile (Hernandez et al., 2008). For SNPs in intron of AS3MT, Meza et al.
(2005) reported association between intronic SNPs 7395G NA,
132
T. Agusa et al. / Toxicology and Applied Pharmacology 236 (2009) 131–141
12390G N C, and 35587T N C in AS3MT, and urinary dimethylarsinic acid
(DMA)/MMA values in the Mexican children. Three intronic polymorphisms in AS3MT (SNPs 12390G N C, 14215C N T, and 35991G NA)
were found to be associated with a lower percentage of MMA and a
higher percentage of DMA in urine of Argentina (Schläwicke
Engström et al., 2007). Hence, SNPs in AS3MT may be responsible
for inter-individual variation in the As metabolism. Given these
results, information on the genotyping of polymorphism in AS3MT
may help in understanding genetic susceptibility to As toxicity.
However, data on distribution of AS3MT polymorphisms and their
relations to As methylation ability are limited, especially among Asian
populations (Fujihara et al., 2007).
To understand the importance of certain biological and environmental factors in inter-individual variation in As metabolism, we
initially investigated the effects of sex, age, body mass index (BMI),
occupation, residential years, and alcohol and smoking habits on the
As metabolites in urine of residents from the Red River Delta, Vietnam.
Moreover, to comprehend whether or not the genetic factor can affect
As metabolism, we studied the relationships between 13 SNPs in
AS3MT and urinary metabolite pattern of As.
Materials and methods
Sampling locations and collected samples.
Groundwater samples
(n = 28) were randomly collected at each home in rural areas of Hoa
Hau (HH) and Liem Thuan (LT) in Ha Nam Province located in the Red
River Delta, Vietnam during March (dry season), 2006. There are no
significant anthropogenic As pollution sources such as industrial sites
and mining regions in both locations. Because some houses equipped
a sand filter system for the well, filtrated groundwater samples
(n = 19) were also collected along with unfiltered water samples from
both locations.
Human hair (n = 99), urine (n = 100), and blood (n = 100) were
correspondingly collected from the residents of each house equipped
with the tube well in an ethical manner. All participants were
randomly selected without an arbitrary manner. We obtained the
informed consent from all the subjects. The study was approved by the
Ethical Committee of Ehime University, Japan. For donors who
participated in this study, information on age (mean, 35.8 years;
range, 11–70 years), sex (male, n = 44; female, n = 56), height (mean,
153 cm; range, 121–173 cm), weight (mean, 46 kg; range, 22–67 kg),
body mass index (BMI; mean, 19.6; range, 12.1–30.0), occupation
(farmer, n = 32; farmer with weaver, n = 4; weaver, n = 32; student,
n = 29; retired worker, n = 2; bricklayer, n = 1), residential years
(mean, 32 years; range, 3–65 years), and alcohol (yes, n = 24; no,
n = 76) and smoking habits (yes, n = 20; no, n = 80) were obtained.
Table 1
Information on water and human samples from Hoa Hau and Liem Thuan in Vietnam
Location
Groundwater
No.
Used period (years)a
Well depth (m)a
Filtered water
No.
Subjects
No.
No. of male/female
Age (years)a
Residential time (years)a
Height (cm)a
Weight (kg)a
No. of smokers/non smokers
No. of drinkers/non drinkers
BMIa,b
a
b
Hoa Hau
Liem Thuan
15
9 (5.5–13)
14 (8–16)
13
6 (1–16)
15 (12–24)
10
9
51
22/29
37 (11–60)
33 (3–60)
156 (137–173)
48 (27–66)
14/37
14/37
20 (14–26)
49
22/27
34 (11–70)
31 (6–65)
150 (121–169)
44 (22–67)
6/43
10/39
19 (12–29)
Arithmetic mean and range.
Body mass index (weight (kg)/height (m)2).
All samples were preserved in the Environmental Specimen Bank
(es-BANK), Center for Marine Environmental Studies (CMES), Ehime
University, Japan at − 25 °C (Tanabe, 2006) until chemical analysis
and genotyping were conducted. The details of wells and subjects are
shown in Table 1.
Analyses of total As and As compounds. Water sample was acidified
with nitric acid for total As (TAs) analysis. Human hair sample washed
by sonication with 0.3% polyoxyethylene lauryl ether was dried for
12 h at 80 °C (Agusa et al., 2006). The dried hair sample was digested
by nitric acid with a microwave oven (Agusa et al., 2006). Thawed
urine was filtrated with a syringe filter (Millex-HV, 0.45 μm syringedriven filter unit, Millipore) and then diluted by Milli-Q water.
Concentrations of TAs in groundwater and human hair were
measured with an inductively coupled plasma-mass spectrometer
(ICP-MS; HP-4500, Hewlett-Packard, Avondale, PA, USA). Yttrium was
used as an internal standard for ICP-MS measurement. Six arsenic
compounds including arsenocholine (AC), arsenobetaine (AB), DMA,
MMA, AsIII, and arsenate (AsV) were determined in urine samples with
a high performance liquid chromatograph (HPLC; LC10A Series,
Shimadzu, Kyoto, Japan) coupled with ICP-MS using an anion
exchange column (Shodex Asahipak ES-502N 7C) (Mandal et al.,
2001; Agusa et al., 2009). The column was equilibrated with a mobile
phase (15 mM citric acid, pH 2.0 with nitric acid) at a flow rate of
1.0 ml/min at 30 °C for more than 2 h before analysis. The injection
volume was 50 μl. Rhodium and Rb were measured as internal
standards for AB and other arsenicals, respectively. Sum of all As
compounds, AsIII + AsV, and AsIII + AsV + MMA + DMA detected in
urine are represented as SAs, IAs, and IMDAs, respectively. Percentages
of AB, AsIII, AsV, MMA, DMA, IAs, and IMDAs to SAs in human urine
were denoted as %AB, %AsIII, %AsV, %MMA, %DMA, %IAs, and %IMDAs,
respectively. Urinary creatinine was measured by SRL, Inc. (Tokyo,
Japan), and concentrations of As compounds in urine were expressed
as μg As/g on a creatinine basis. Detection limits of TAs in water and
hair, and As compounds (AC, AB, AsIII, AsV, MMA, and DMA) in urine
were 0.1 μg/l, 0.01 μg/g dry wt, and 1 μg/g creatinine, respectively in
our methods.
To confirm the accuracy of our analytical methods, certified
reference materials, SLRS-4 River Water from the National Research
Council Canada (NRCC) and NIES No.13 Human Hair and NIES No.18
Human Urine provided by the National Institute for Environmental
Studies (NIES), Japan were analyzed for TAs and As compounds (AB
and DMA), respectively. Results of TAs in the water and hair and AB
and DMA in the urine were in very good agreement with the certified
values, and the recoveries were in the range of 90–106%. The analytical
precision for these samples (n = 3) were within 4%. In addition, we
have participated in an inter-calibration exercise organized by the
Swiss Federal Institute of Aquatic Science and Technology (Eawag) in
the frame of the ongoing cooperation of Vietnam and Switzerland in
As related surveys and researches for analytical quality assurance and
control.
Genotyping of polymorphism in AS3MT. Genotyping of SNPs in
AS3MT was conducted by polymerase chain reaction and restriction
fragment length polymorphism (PCR-RFLP) technique (Fujihara et al.
2007). First, genomic DNA was extracted from blood sample using
QIAamp DNA mini kit (Qiagen, Hilden, Germany), and genotyped for
13 SNPs in AS3MT including 4602A NG (A to G substitution at
nucleotide base 4602), 4740T N C, 5913T N C, 6144A NT, 7395G NA,
8979T NA, 12390G N C, 12590T N C, 14215C N T, 14458T N C (287Met N Thr
(Met to Thr substitution at amino acid base)), 35587T N C, 35991G NA,
and 37853G NA. Primers for AS3MT were designed based on the DDBJ
Sequence Database under accession no. AY817668 (Table 2). The
mismatched PCR method (Kumar and Dunn, 1989) was employed for
identifying a new restriction enzyme site for the detection of SNPs.
One microgram of DNA was subjected to PCR amplification in 10 μl
T. Agusa et al. / Toxicology and Applied Pharmacology 236 (2009) 131–141
133
Table 2
Information on primer sequences, annealing temperatures, restriction enzymes, and fragment sizes of the amplified products used for PCR-RFLP
SNP IDa
rs numberb
Functional region
Nucleotide
change
Primer sequencec
Annealing
temp (°C)
Restriction
enzyme
Fragment size
(bp)
4602
rs7085104
5′ upstream region
ANG
F: 5′-CGAAGAAACTTGTGGGCCAGA-3′
R: 5′-TCGCTCCACTGCGATTTTCAC-3′
60
MspI
5′ upstream region
TNC
F: 5′-CGAAGAAACTTGTGGGCCAGA-3′
R: 5′-CTGATTTAAATGAACACTCAC(C N G)T-3′
56.5
MslI
rs4917986
Intron 3
TNC
F: 5′-GGTCACTAGGGAATTAACCCG-3′
R: 5′-TGGCTATGTTGACCAAGCTGG-3′
61
BglI
6144
rs17878846
Intron 3
A NT
F: 5′-GGTCACTAGGGAATTAACCCG-3′
R: 5′-GGTTCCAACTAATCACCCACG-3′
61
XbaI
7395
rs12767543
Intron 3
G NA
F: 5′-CGCCTATGGGACAGAAACCTT-3′
R: 5′-CTAAGGGACAGAGT(G N C)AGACTC-3′
55
AlwNI
8979
rs7920657
Intron 5
T NA
F: 5′-AGAGTGCAGTGGCCCAATGTC-3′
R: 5′-TGAGCACAGTGCCTCACACCT-3′
63
NlaIII
12390
rs3740393
Intron 6
GNC
F: 5′-GTTCCCCTATTCCTTTC(T NA)TTG-3`
R: 5′-AACCTTGGCCTCATGGCCTAA-3′
51
MslI
12590
rs3740392
Intron 7
TNC
F: 5′-GTTTCAGCATGGTGGGGAGTT-3′
R: 5′-CTG(G N C)CTATTAGC-3′
51
BslI
14215
rs3740390
Intron 8
CNT
F: 5′-CTGTACAATGGTAACCCCCCA-3′
R: 5′-GCAAGGGCAAGAGCAGAAAGA-3′
63
Hpyl88I
14458
rs11191439
Exon 9
TNC
F: 5′-GTGCTGGAGATGAACCGTGAA-3′
R: 5′-GCAAGGGCAAGAGCAGAAAGA-3′
59
HpyCH4IV
35587
rs11191453
Intron 10
TNC
F: 5′-CAGCAGTCTTGTCTTTTAAAT(ANT)AA-3′
R: 5′-CCTCTTTGGAACTGAGATACGG-3′
58
AseI
35991
rs10748835
Intron 10
G NA
F: 5′-CACGTGCAAATGCAACCCCA-3′
R: 5′-GTTTGATTTAGGTTGAC(T N G)T(A N G)CA-3′
51
ApaLI
37853
rs11191459
3′ downstream region
G NA
F: 5′-CATGGTGAGACCCCCATCTCT-3′
R: 5′-CCTGATGATAATGACC-3′
60
MspI
AA: 261
AG: 261, 200, 61
GG: 200, 61
TT: 224
TC: 224, 205, 19
CC: 205, 19
TT: 251
TC: 251, 151, 100
CC: 151, 100
AA: 415
AT: 415, 376, 39
TT: 376, 39
GG: 155
GA: 155, 138, 17
AA: 138, 17
TT: 160, 94
TA: 254, 160, 94
AA: 254
GG: 286
GC: 286, 265, 21
CC: 265, 21
TT: 164
TC: 164, 157, 7
CC: 157, 7
CC: 320, 81
CT: 401, 320, 81
TT: 401
TT: 233
TC: 233, 154, 79
CC: 154, 79
TT: 194, 21
TC: 215, 194, 21
CC: 215
GG: 205, 22
GA: 227, 205, 22
AA: 227
GG: 415, 42
GA: 457, 415, 42
AA: 457
4740
rs12416687
5913
a
b
c
Amino acid
change
Met N Thr
SNP ID indicates the SNP identification number relative to the location in the consensus sequence, with the first base of the consensus numbered 1.
Rs numbers were cited from NCBI SNP Database ( />N N N in parenthesis indicates substitution of nucleotide for constriction of mismatched nucleotide.
reaction mixture containing GoTaq® Green Master Mix (Promega,
Madison WI, USA) and each primer pair corresponding to each SNP.
Information on primer sequence, annealing temperature, restriction
enzyme, and PCR product size is listed in Table 2. The PCR product was
digested with restriction enzyme and then was subjected to
electrophoresis on 8% polyacrylamide gel.
Statistical analyses. All statistical analyses were performed with
StatView (version 5.0, SAS® Institute, Cary, NC, USA) and SPSS (version
12, SPSS, Chicago, IL, USA). One half of the value of the respective limit
of detection was substituted for those values below the limit of
detection and used in statistical analysis. All data were tested for
goodness of fit to a normal distribution with Kolmogorov–Smirnov's
one sample test. Because some variables were not normally
distributed, log transformation was conducted for parametric
analyses. Outlier (As concentration of 2120 μg/l in groundwater)
was checked by Thompson test. Relationships among concentrations
of As in water, hair, and urine, composition of As compounds in urine,
age, residential period, and BMI were examined by Pearson's
correlation coefficient test. Student's t-test was used to detect
influences of regions, sexes, and smoking and drinking habits on As
levels in water, hair and urine, and urinary metabolites. Differences in
As concentrations between genetic polymorphisms in AS3MT were
checked by Tukey–Kramer method, along with one-factor ANOVA.
Relationships between genetic polymorphisms in AS3MT, and hair and
urinary As concentrations and As compositions were also examined by
multiple regression analysis including sex, age, and BMI as
independent variables. The residual values were obtained from the
difference between the actual value and the predicted value from the
regressions. These residual values reflect the variation after the effects
of the regression variables have been removed. Linkage disequilibrium
(LD) and haplotype of SNPs in AS3MT were calculated using
Haploview (version 4.0, Day Lab at the Broad Institute Cambridge,
MA, USA). A p value of less than 0.05 was considered to indicate
statistical significance. Geometric mean value was represented as GM
in this study.
Results and discussion
Concentration of total As in groundwater
Arsenic was detected in all groundwater samples and the levels
were 0.7–2120 μg/l. One groundwater sample with the highest
concentration of TAs (2120 μg/l) was removed for further statistics,
because this was considered to be an outlier (p b 0.001). The
extraordinary high As level of the outlier might be due to the presence
of large amount of particulate matters found in this sample. In the data
set without this outlier, the range was 0.7–502 μg/l (Table 3). Arsenic
concentration in groundwater from HH (GM, 368 μg/l) was
significantly higher (p b 0.001) than that from LT (GM, 1.4 μg/l)
134
T. Agusa et al. / Toxicology and Applied Pharmacology 236 (2009) 131–141
Table 3
Concentrations (geometric mean and range) of total As and As compounds in water (μg/l),
human hair (μg/g dry wt) and urine (μg/g creatinine) from Hoa Hau and Liem Thuan in
Vietnam
Location
Groundwater
n
TAs⁎
Filtered water
n
TAs⁎
Drinking water
n
TAs⁎
Human hair
n
TAs⁎
Human urine
n
AC
AB
DMA
MMA
AsIII
AsV
SAs
IAs
IMDAs
Hoa Hau
Liem Thuan
15
368 (163–502, and 2120 (an outlier))
13
1.4 (0.7–6.8)
10
18.9 (3.2–143)
9
2.0 (1.0–4.9)
15
50.1 (3.2–486)
13
1.7 (0.9–4.9)
50
0.351 (0.028–2.94)
49
0.232 (0.068–0.690)
51
b1.0
17.7 (2.5–72.6)
50.5 (22.5–268)
9.3 (3.5–23.9)
6.9 (b 1.0–32.2)
1.5 (b1.0–12.7)
92.6 (45.2–365)
9.3 (3.1–38.2)
70.5 (33.6–320)
49
b 1.0
14.5 (2.1–232)
56.4 (20.2–132)
9.3 (3.8–23.1)
7.1 (b 1.0–26.6)
1.7 (b 1.0–19.1)
97.9 (38.6–397)
10.2 (4.0–28.6)
77.3 (33.0–176)
TAs; total As.
SAs; sum of all As compounds.
IAs; sum of AsIII + AsV.
IMDAs; sum of IAs + MMAV + DMAV.
Drinking water; In a house equipped with sand filter, filtered water instead of raw
groundwater is assumed to be consumed.
⁎ Significant difference (p b 0.001) between locations.
(Table 3). Furthermore, all the samples (n = 15) from HH contained
TAs concentrations (range, 163–502 μg/l) exceeding 10 μg/l of WHO
drinking water guideline (WHO, 2004). This result suggests that the
groundwater in HH is heavily contaminated by As and the health of
this population is at risk. On the contrary, As concentrations in all
groundwater samples from LT were less than 10 μg/l. Total As
concentration in groundwater was not related to depth and usage
history of the wells.
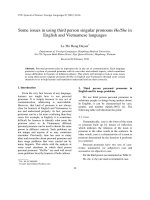
Efficiency of sand filter for As removal
Concentration ranges of TAs in sand-filtered groundwater were
3.2–143 μg/l in HH and 1.0–4.9 μg/l in LT (Table 3). In the filtered
water, regional difference in TAs concentration was observed
(p b 0.001). In HH, concentration of TAs in filtered water (GM,
18.9 μg/l) was significantly low (p b 0.001) compared with the raw
groundwater (GM, 368 μg/l), and GM of the removal efficiency of TAs
from raw groundwater was estimated to be 93% (Fig. 1). Berg et al.
(2006) also reported that about 80% of As was removed from
groundwater by sand filtration in Vietnam. Therefore, the simple
sand filter system can be useful to remove TAs from contaminated
groundwater in these regions. However, several filtered water samples
in HH still contained TAs concentrations over 10 μg/l of the WHO
guideline value (WHO, 2004) (Fig. 1), indicating that sand filtration is
not enough to remove excessive As and the water is not suitable for
drinking in some cases.
Concentration of total As in human hair
Human hair could be a useful indicator of contamination status of
trace elements including As, because it is easy for non-invasive
collection, transportation, and preservation (Matsubara and Machida,
1985). Total As concentrations in hair of residents from HH and LT
were in the range of 0.028–2.94 μg/g dry wt. (Table 3). Similar to the
results of groundwater, TAs level in human hair of HH (GM, 0.351 μg/g
dry wt) was significantly higher (p b 0.001) than that of LT (GM,
0.232 μg/g dry wt). Total As concentrations in hair of three individuals
(1.00 μg/g dry wt, 2.67 μg/g dry wt, and 2.94 μg/g dry wt) from HH
exceeded the level of 1 μg/g dry wt which may be a level that can
induce skin lesion (Arnold et al., 1990), suggesting potential high risk
for some residents in this area.
Concentration and composition of As compounds in human urine
It is generally known that ingested inorganic As is methylated to
MMA, followed by DMA and then they are excreted into the urine in
humans (Styblo et al., 2002). Therefore, As speciation is important for
assessing exposure and metabolic capacity of As in humans. Concentrations of As species in human urine from the HH and LT are shown in Table
3. Concentration ranges of SAs and IMDAs were 38.6–397 μg/g creatinine
and 33.0–320 μg/g creatinine, respectively. There was no significant
difference in concentrations of urinary SAs between HH (GM, 92.6 μg/g
creatinine) and LT (GM, 97.9 μg/g creatinine), which was inconsistent
with the results of groundwater and human hair. The reason is discussed
in the next section. Similar composition of urinary As compounds was
found in the residents of both HH and LT, showing DMA as the
predominant form and inorganic arsenicals as minor species. Arsenobetaine, which may be mainly derived from consumption of seafood,
was also detected in the urine as the second abundant As species. In the
present study, AC was not detected in any of the urine samples.
Fig. 1. Concentrations of TAs in raw and sand-filtrated groundwater from Hoa Hau and Liem Thuan in Vietnam.
T. Agusa et al. / Toxicology and Applied Pharmacology 236 (2009) 131–141
135
Relationships among concentration of As in drinking water, hair
and urine
To understand whether subjects in these areas are exposed to As
mainly through the consumption of groundwater, relationships
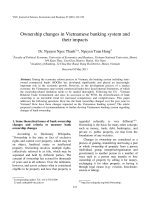
Fig. 3. Comparison of (a) %IAs and (b) DMA/MMA ratio in urine between females and
males from Hoa Hau and Liem Thuan in Vietnam. Bar and plots indicate arithmetic
mean and individual values, respectively.
between As concentrations in water, and in hair and urine were
examined. Since it is expected that residents of the house equipped
with the sand filter system drink the filtered groundwater,
concentration of As in filtered water was used to evaluate As
exposure status for these subjects. A significant positive correlation
was found between TAs concentrations of drinking water and hair in
residents from HH and LT (p b 0.001; Fig. 2a). On the contrary, there
were no positive correlations between concentrations of TAs in
water and any of the As compounds in human urine of all the
residents (the result of IMDAs is only shown in Fig. 2b). Hence, it
seems that uptake of As from other source(s) such as food might
affect the urinary concentration especially for the LT residents.
However, since food habit was almost similar between locations but
TAs levels in human hair were positively correlated with those in
drinking water, peoples in HH may be not recently exposed to As
from the water.
Hair As levels were positively correlated with concentrations of
urinary IMDAs (p b 0.001; Fig. 2c) and SAs (p = 0.002). Similar
relationship was obtained in previous investigations in the
population from Cambodia (Kubota et al., 2006) and Finland
(Kurttio et al., 1998). Since hair can be a good indicator of past As
exposure status, while As level in urine can represent recent
exposure of As (Mandal and Suzuki, 2002), these results indicate
that the residents in HH and LT may have been chronically exposed
to As from groundwater.
Fig. 2. Relationships between (a) concentrations of TAs in drinking water and human
hair, (b) concentrations of TAs in drinking water and IMDAs in human urine, and
(c) concentrations of TAs in human hair and IMDAs in human urine from Hoa Hau
and Liem Thuan in Vietnam. Solid line in each figure represents the regression line
((a) y = 0.216x0.123, R2 = 0.155, p b 0.001; (c) y = 0.014x0.691, R2 = 0.203, p b 0.001).
Potential effects of sex, age, and BMI on As concentration and metabolism
Influences of age, sex, BMI, occupation, residential years, and alcohol
and smoking habits on As levels and metabolites in the residents were
136
T. Agusa et al. / Toxicology and Applied Pharmacology 236 (2009) 131–141
investigated. Occupation, residential period, and alcohol and smoking
habits were not significantly correlated with As concentrations and
profiles in the residents. Concentrations of MMA (p = 0.034), AsIII
(p = 0.033), and IAs (p = 0.004) in urine and TAs (p = 0.012) in hair of
males were significantly higher than those of females. Also, males
showed higher %MMA (p = 0.001), %AsIII (p = 0.003), %AsV (p = 0.043),
and %IAs (p b 0.001, Fig. 3a) in urine compared to females. Concentration
ratio of urinary DMA/MMA, which can be a useful indicator as 2nd
methylation step of IAs, was significantly higher in females (p = 0.008;
Fig. 3b). These results suggest that males might be highly exposed to IAs
and/or might have a lower 2nd methylation capacity of As compared to
females. In our previous study, sexual difference in hair As concentration
was not significant for residents in Gia Lam and Thanh Tri in Hanoi,
Vietnam (Agusa et al., 2006). Interestingly, urinary As concentrations in
females from As-contaminated sites were higher than those in males,
while opposite trend was observed in its reference site (Chiou et al.,
1997; Chowdhury et al., 2003; Loffredo et al., 2003). Although, the
reason still remains unclear, our result is consistent with the study in
non-As contaminated sites. Watanabe et al. (2001) reported that from
an As contaminated area of Bangladesh, concentrations of As in urine of
females were high but severe cases of skin pathologies were remarkably
found in males, and suggested that females may prevent toxic effects
(ex. skin disorder) from chronic As exposure by immediately excreting
of As in their body compared with males. However, further studies on
the mechanism of sexual difference in As excretion are necessary.
It is known that creatinine level in urine of males is generally
higher than that of females because its excretion into urine is related
to mass of muscle. Therefore, it is expected that sexual difference in
Fig. 5. Relationships between BMI and (a) concentration of DMA, and (b) IMDAs in
human urine from Hoa Hau and Liem Thuan in Vietnam. Solid line in each figure
represents the regression line for males ((a) [Log DMA] = − 0.032 × [BMI] + 2.33,
R2 = 0.278, p b 0.001, (b) [Log IMDAs] = − 0.029 × [BMI] + 2.43, R2 = 0.254, p b 0.001).
Fig. 4. Relationships between age and (a) MMA/IAs, and (b) %IAs in human urine from
Hoa Hau and Liem Thuan in Vietnam. Solid lines in each figure represent the regression
lines for females ((a) [MMA/IAs] = 0.018 × [age] + 0.49, R2 = 0.303, p b 0.001, (b) %
IAs = − 0.075 × [age] + 12, R2 = 0.108, p = 0.013).
urinary creatinine level might affect the above-mentioned results.
However, no significant difference was observed for creatinine
between males and females in this study. Also, even when we used
data of urinary As levels and compositions without correction by
creatinine, similar results were obtained.
Concentration ratio of urinary MMA/IAs, an index of 1st methylation
step of IAs, significantly increased with age in all subjects (p = 0.005).
Greater age-dependence was observed for females (p b 0.001, Fig. 4a).
Furthermore, a significant negative correlation was observed between
age and %IAs in urine of females (p = 0.013, Fig. 4b). Therefore, older
persons may have a higher methylation capacity from IAs to
monomethylated As than young people and also this tendency is
possibly pronounced in female. Several previous studies reported that
children may have a higher 2nd methylation capacity compared to
adults (Agusa et al., 2009; Chowdhury et al., 2003; Chung et al., 2002),
but no significant correlation between age and DMA/MMA in urine was
found in the present study. This difference may be due to the small
sample size of children. No age-dependent variation in human hair As
concentration in this study was consistent to our previous study
conducted for Vietnamese (Agusa et al., 2006).
Significant negative correlations between BMI as an indicator of
nutritional status (Bailey and Ferro-Luzzi, 1995) and concentrations of
urinary DMA (p = 0.003), MMA (p = 0.044), AsV (p = 0.008), IAs
(p = 0.006), SAs (p = 0.005), and IMDAs (p = 0.002), and hair TAs
(p = 0.027) were found in all the residents. These correlations except
IAs in urine and TAs in hair were also observed only in males.
Representative results of DMA and IMDAs are shown in Figs. 5a and b,
T. Agusa et al. / Toxicology and Applied Pharmacology 236 (2009) 131–141
respectively. These results might suggest that nutrition status was
exacerbated by As exposure in the residents, especially in males.
Alternatively, people with poorer nutritional status might accumulate
more As in their body.
Genetic polymorphisms in AS3MT
Genetic factors could also be one of critical factors for As
metabolism (Vahter, 2000). The present study investigated potential
influence of nine SNPs (4602, 4740, 7395, 12390, 12590, 14215, 14458,
35587, and 35991) in AS3MT that may be involved in As metabolism
(Meza et al., 2005; Wood et al., 2006; Schläwicke Engström et al.,
2007; Lindberg et al., 2007; Hernandez et al., 2008). Also, four SNPs
Table 4
Composition of As compounds (arithmetic mean) and concentration ratios of MMA/IAs
and DMA/MMA (arithmetic mean) in urine for SNPs of AS3MT in residents from Hoa
Hau and Liem Thuan in Vietnam
SNP IDa
4602
AA
AG
GG
4740
TT
TC
CC
5913
TT
TC
CC
6144
AA
TA
TT
7395
GG
GA
AA
8979
TT
TA
AA
12390
GG
GC
CC
12590
TT
CT
CC
14215
CC
CT
TT
14458
TT
TC
35587
TT
TC
CC
35991
GG
GA
AA
37853
GG
GA
AA
n
%AB
%DMA
%MMA
%IAs
DMA/MMA
MMA/IAs
40
22
38
16.2 y
19.6 xy
25.8 x
61 x
59.8 x
52.7 y
10.8
10.0
10.3
11.9
10.6
11.2
5.9
6.5
5.9
1.0
1.1
1.0
52
40
8
17.1 y
24.9 x
29.4 x
61.2 y
54.9 x
45.6 x
10.3
10.1
11.3
11.5
10.1
13.7
6.5
6.0
4.6
1.0
1.2
0.9
85
14
1
22.1
15.1
31.2
57.0
60.6
43.6
9.9 y
12.7 x
13.7 xy
11.0
11.6
11.5
6.4
5.1
3.2
1.0
1.3
1.2
57
36
7
20.3
21.4
27.5
57.6
58.1
52.5
10.7
9.6
10.0
11.4
10.8
9.9
5.8
6.7
6.1
1.1
1.0
1.0
38
57
5
20.4
20.8
31.9
57.4
58.2
48.0
10.8
10.0
10.2
11.3
11.0
10.0
5.7
6.5
5.1
1.1
1.0
1.1
36
46
18
18.9 y
19.0 y
31.4 x
59.7 x
58.6 x
49.6 y
10.3
10.9
8.7
11.0
11.5
10.3
6.3
5.9
6.5
1.1
1.1
0.9
59
37
4
20.5
21.8
25.6
56.9
58.2
58.5
11.0 x
9.5 xy
7.1 y
11.6
10.6
8.9
5.6 y
6.8 x
8.2 xy
1.1
1.0
0.8
43
42
15
18.2
22.5
26.3
60.9 x
56.8 xy
48.9 y
9.8
10.3
11.7
11.1
10.4
13.0
6.7 x
6.2 xy
4.6 y
1.0
1.1
1.0
57
37
6
20.9
21.3
23.3
57.0
57.8
59.2
10.8
9.8
8.3
11.3
11.1
9.2
5.7
6.6
7.4
1.1
1.0
0.9
96
4
21.1
23.0
57.5
54.7
10.2
11.9
11.1
10.4
6.2
4.8
1.0 y
1.6 x
59
28
13
21.0
18.4
28.1
56.6
60.1
55.1
10.9
9.9
8.3
11.5
11.5
8.5
5.6 y
6.9 x
6.9 xy
1.1
0.9
1.0
19
45
36
17.2
19.6
25.3
60.2 xy
60.0 x
52.7 y
10.9
10.2
10.2
11.7
10.3
11.8
5.8
6.4
6.0
1.0
1.1
0.9
26
49
25
17.5 y
18.2 y
31.0 x
60.5 x
59.6 x
50.0 y
11.0 x
10.7 xy
8.8 y
11.1
11.6
10.2
5.7
6.2
6.5
1.2
1.0
0.9
Values with same letters are not significantly different at p b 0.05.
a
SNP ID indicates the SNP identification number relative to the location in the
consensus sequence, with the first base of the consensus numbered 1.
137
(5913, 6144, 8979, and 37853) with relatively high frequency of alleles
in AS3MT (Meza et al., 2005) were identified by PCR-RFLP in the
present study. Numbers of subjects for each genotype are shown in
Table 4. CC homo type of 5913 was found only in one subject and there
was no homo type of 14458CC in this population.
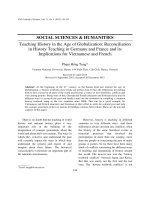
Distinct LD groups were found for SNPs in AS3MT (Fig. 6); 4602–
35991 (R2 = 0.71), 4602–37853 (R2 = 0.53), 4740–12590 (R2 = 0.61),
6144–12390 (R 2 = 0.82), 6144–14215 (R 2 = 0.72), 6144–35587
(R2 = 0.62), 12390–14215 (R2 = 0.84), 12390–35587 (R2 = 0.74),
14215–35587 (R2 = 0.78), and 35991–37853 (R2 = 0.55). In this
analysis, three clusters were obtained: SNPs 4602, 35991 and 37853
as cluster 1, 4740 and 12590 as cluster 2, and 6144, 12390, 14215 and
35587 as cluster 3. Among these three LD clusters, some haplotypes
were identified: 8 for LD cluster 1, 4 in LD cluster 2, and 9 in LD cluster
3 (Table 5). Haplotype 1 represented the most frequent sequence in
each LD cluster of AS3MT and the frequencies in LD cluster 1, 2, and 3
were 0.457, 0.629, and 0.690, respectively. The three groups of LD
obtained in this study were different from previous findings reported
for the populations of Mexico (Meza et al., 2005) and Argentine
(Schläwicke Engström et al., 2007) (Table 6). Mexicans had strong LD
among SNPs 7395, 12390, and 35587 (Meza et al., 2005). Schläwicke
Engström et al. (2007) showed a LD cluster composed of SNPs 12390,
14215, and 35991 in Argentina. Remaining genotypes such as SNPs
5913, 7395, 8979, and 14458 were independent from other SNPs in
this Vietnam population.
Potential effects of genetic polymorphisms in AS3MT on As concentration
and metabolism
Results of ANOVA followed by Tukey–Kramer Test showed statistically significant associations between 10 SNPs (4602, 4740, 5913, 8979,
12390, 12590, 14458, 35587, 35991, and 37853), and As concentration
and metabolite pattern in urine of Vietnamese (Table 4). On the
contrary, SNPs 6144, 7395, and 14215 had no relation to any of the
indicators of As exposure and metabolic capacity. Although urinary %AB,
which is unlikely to be involved in As methylation, had some
associations with SNPs 4602, 4640, 8979, and 37853 (p b 0.05), these
associations might result from relations between these SNPs and %DMA
as shown by a strong negative correlation between %DMA and %AB (r =
−0.865, p b 0.001). Concentration of TAs in human hair had no
dependence on genotype in AS3MT.
Homo types in 4602GG, 35991AA, and 37853AA, which had strong
LD with each other (cluster 1), showed significantly lower %DMA in
urine compared to other genotypes in each corresponding SNP
(p b 0.05) (Table 4). For SNP 37853, %MMA in AA homozygote was
also lower than those in GG type (p b 0.05, Table 4). The results did not
agree with previous studies. In Mexicans, SNP 4602 was not correlated
with urinary As composition (Meza et al., 2005) (Table 6). Schläwicke
Engström et al. (2007) revealed that AA variant homozygosis in SNP
35991 was associated with a decrease in %MMA and an increase in %
DMA in urine (Table 6), suggesting consequently a higher ratio for the
2nd methylation step. To understand relationships between As
metabolic capacity and haplotype, subjects were initially divided
into several groups, comprising homozygote and heterozygote for
AS3MT haplotype in each LD cluster (Table 7). Then, the association
was assessed by excluding haplotype groups with less than four
subjects to obtain sufficient statistical power. Urinary %DMA in G1-2
(4602GG/35991AA/37853AA) of haplotype group in LD cluster 1 was
significantly lower than those in G1-1 (4602AG/35991GA/37853GA)
and G1-3 (4602AA/35991GG/37853GG) (p b 0.05) (Fig. 7). Furthermore, this G1-2 showed lower %MMA compared with G1-4 (4602GG/
35991AA/37853AG) (p b 0.05).
Higher %DMA in urine for TT homozygote in SNP 4740 was
observed in the present study (p b 0.05) (Table 4), while no similar
observation was reported in Mexicans (Meza et al., 2005) (Table 6).
Although concentration of IAs in urine for 4740TT was significantly
138
T. Agusa et al. / Toxicology and Applied Pharmacology 236 (2009) 131–141
Fig. 6. Linkage disequilibrium of SNPs in AS3MT of humans from Hoa Hau and Liem Thuan in Vietnam. The value shown in each diamond indicates pair wise R2 value for each SNP pair.
higher than that for 4740TC (p = 0.002), %IA was not related to the
genetic polymorphism. For SNP 12590 belonging to the cluster 2 as
does SNP 4740, the TT type had higher concentrations of DMA and
IMDAs, %DMA, and DMA/MMA in urine than other genotypes
(p b 0.05), suggesting the prompted 2nd methylation capacity in this
carrier. In the LD cluster 2, concentrations of DMA, IAs, and IMD in
urine of G2-1 (4740TT/12590TT) haplotype group were greater than
those in G2-2 (4740TC/12590TC) (p b 0.05) (Table 7). Furthermore,
significant higher %DMA in urine was observed in G2-3 (4740TT/
12590TC) and G2-1 than in G2-4 (4740CC/12590CC) (p b 0.05) (Fig. 7
and Table 7). Higher hair As concentration was found in G2-3
compared to G2-1, indicating the difference in allele between T and C
in AS3MT 12590.
Although SNPs 6144, 12390, 14215, and 35587 showed strong LD
and were grouped as cluster 3 in the present study, their associations
with urinary As profile were classified into two different patterns;
genotypes in SNPs 6144 and 14215 showed no significant correlations
with As in hair and urine, while 12390GG and 35587CC had higher
urinary %MMA and thus lower DMA/MMA (Table 4). Similarly, Meza
et al. (2005) and Schläwicke Engström et al. (2007) have reported
lower DMA/MMA in urine of 12390GG in Mexican children and
Argentina women (Table 6). SNP 14215 in females of Argentine had
Table 5
Distribution of haplotype group in linkage disequilibrium (LD) cluster og AS3MT in residents from Hoa Hau and Liem Thuan in Vietnam
SNP IDsa
Total frequency
Cumulative frequency
1
2
3
4
5
6
7
8
4602G/35991A/37853A
4602A/35991G/37853G
4602G/35991A/37853G
4602A/35991A/37853G
4602G/35991G/37853G
4602A/35991A/37853A
4602G/35991G/37853A
4602A/35991G/37853A
0.457
0.368
0.087
0.025
0.025
0.016
0.012
0.011
0.457
0.824
0.912
0.937
0.962
0.977
0.989
1.000
1
2
3
4
4740T/12590T
4740C/12590C
4740T/12590C
4740C/12590T
0.629
0.269
0.091
0.011
0.629
0.898
0.989
1.000
1
2
3
4
5
6
7
8
9
6144A/12390G/14215C/35587T
6144T/12390C/14215T/35587C
6144A/12390G/14215C/35587C
6144T/12390G/14215C/35587T
6144A/12390G/14215T/35587C
6144A/12390G/14215T/35587T
6144A/12390C/14215T/35587C
6144T/12390C/14215C/35587T
6144T/12390G/14215T/35587C
0.690
0.215
0.035
0.026
0.010
0.010
0.005
0.005
0.005
0.690
0.904
0.939
0.965
0.975
0.985
0.990
0.995
1.000
Haplotype
LD cluster 1
Haplotype
Haplotype
Haplotype
Haplotype
Haplotype
Haplotype
Haplotype
Haplotype
LD cluster 2
Haplotype
Haplotype
Haplotype
Haplotype
LD cluster 3
Haplotype
Haplotype
Haplotype
Haplotype
Haplotype
Haplotype
Haplotype
Haplotype
Haplotype
a
SNP ID indicates the SNP identification number relative to the location in the consensus sequence, with the first base of the consensus numbered 1.
T. Agusa et al. / Toxicology and Applied Pharmacology 236 (2009) 131–141
139
Table 6
Comparison of significant differences in composition of As compounds and concentration ratios of MMA/IAs and DMA/MMA in urine and linkage disequilibrium for SNPsa of AS3MT
among study groups in Vietnam, Mexico, and Argentine
Reference
This study
Meza et al., 2005
Schläwicke Engström et al., 2007
Study group
n
SNP 4602
SNP 4740
SNP 6144
SNP 7395
SNP 12390
Vietnam
100
%DMA; AA NGG, AA NGG
%DMA; TT N TC, CC
NS
NS
%MMA; GG b CC
DMA/MMA; GG b GC
Mexico (children)
41
NS
NS
Argentine (females)
147
SNP 12590
NS
SNP 14215
%DMA; TT N CC
DMA/MMA; TT N CC
NS
SNP 14458
SNP 35587
MMA/IA; TT b TC
DMA/MMA; TT b TC
SNP 35991
DMA/MMA; GA N AA
SNP 37853
DMA%; GG NAA, GA N AA
MMA%; GG NAA
Pair of linkage disequilibrium
SNPs 4602, 35991, and 37853
SNPs 4740 and 12590
SNPs 6144, 12390, 14215, and 35587
DMA/MMA; GG bAG + AA
DMA/MMA; GG b GC + CC
%DMA; GG b GC, GG b CC
%MMA; GG N GC, GG N CC
DMA/MMA; GG b GC, GG b CC
%DMA; CC b CT, CC b TT
%MMA; CC N CT, CC N TT
DMA/MMA; CC b CT, CC b TT
DMA/MMA; TT b CT + CC
MMA/AsIII; TT N CT + CC
%DMA; GG b GA, GG b AA
%MMA; GG N GA, GG NAA
DMA/MMA; GG b GA, GG b AA
SNPs 7395, 12390, and 35587
SNPs 12390, 14215, and 35991
NS; not significant.
a
SNP ID indicates the SNP identification number relative to the location in the consensus sequence, with the first base of the consensus numbered 1.
strong LD with SNP 12390, and the association with estimated
metabolic capacity of As was also similar between SNPs 14215 and
12390 (Schläwicke Engström et al., 2007). As for Vietnamese, no such
a result of SNP 14215 was observed. Among the haplotype groups in
this LD cluster 3, AB concentration in urine of G3-3 (6144AT/
12390GC/14215CT/35587CC) was significantly higher than that in
G3-2 (6144AT/12390GC/14215CT/35587TC) (p b 0.05) (Table 7),
although the reason was not clear.
%MMA in urine for 5913TT was significantly lower (p = 0.003)
than that for 5913TC (Table 4). TT genotype in 8979 was associated
with higher %DMA (p b 0.05). To our knowledge, this is the first finding
on the association with SNPs in addition to SNP 37853.
14458TC hetero type had significantly higher MMA/IAs (p = 0.002)
than TT homo type (Table 4), although the sample size was small (n = 4).
SNP 14458 located at exon 8 in AS3MT corresponds to 287 at amino acid
base, in which amino acid substitution occurs from Met to Thr. A
previous in vitro expression study using COS-1 cell, variant type with
287MetN Thr showed significantly higher levels of enzymatic activity
and immunoreactive protein than the Met/Met homo type (Wood et al.,
2006). Higher %MMA in urine was reported for 287Met N Thr heterozygous carriers than the Met/Met homozygosis in general populations
in Hungary, Romania, and Slovakia, (Lindberg et al., 2007), and in male
workers of copper smelting plant in Chile (Hernandez et al., 2008).
Although there was no significant difference, %MMA in urine for the TC
Table 7
Composition of As compounds (arithmetic mean) and concentration ratios of MMA/IAs and DMA/MMA (arithmetic mean) in urine for haplotype group of each linkage
disequilibrium (LD) cluster of AS3MT in residents from Hoa Hau and Liem Thuan in Vietnam
Group
LD cluster 1
G1-1
G1-2
G1-3
G1-4
LD cluster 2
G2-1
G2-2
G2-3
G2-4
G2-5
LD cluster 3
G3-1
G3-2
G3-3
G3-4
n
Haplotype groupa
SNP IDsb
%AB
%DMA
%MMA
%IAs
DMA/MMA
MMA/IAs
33
21
17
10
Haplotype 1 × 2, 3 × 8, 4 × 7, 5 × 6
Haplotype 1 × 1
Haplotype 2 × 2
Haplotype 1 × 3
4602AG/35991GA/37853GA
4602GG/35991AA/37853AA
4602AA/35991GG/37853GG
4602GG/35991AA/37853GA
18.9 y
30.5 x
16.4 y
17.5 y
60.2
50.2
60.3
55.3
x
y
x
xy
10.0 xy
9.0 y
11.2 xy
12.6 x
10.8
10.3
12.1
14.5
6.6
6.4
5.5
5.0
1.0
0.9
1.1
1.0
41
31
11
8
7
Haplotype 1 × 1
Haplotype 1 × 2, 3 × 4
Haplotype 1 × 3
Haplotype 2 × 2
Haplotype 2 × 3
4740TT/12590TT
4740TC/12590TC
4740TT/12590TC
4740CC/12590CC
4740TC/12590CC
18.0
25.6
13.8
29.4
22.7
60.9
55.0
62.0
45.6
52.8
x
xy
x
y
xy
9.9
9.9
11.7
11.3
12.2
11.2
9.6
12.5
13.7
12.3
6.6
6.1
6.3
4.6
4.6
1.0
1.2
1.0
0.9
1.2
54
25
7
4
Haplotype 1 × 1
Haplotype 1 × 2, 4 × 7, 5 × 8
Haplotype 2 × 3
Haplotype 2 × 2
6144AA/12390GG/14215CC/35587TT
6144AT/12390GC/14215CT/35587TC
6144AT/12390GC/14215CT/35587CC
6144TT/12390CC/14215TT/35587CC
20.4
18.6
32.2
25.6
57.6
60.0
51.6
58.5
10.7
9.6
8.4
7.1
11.3
11.8
7.9
8.9
5.8
7.0
6.5
8.2
1.1
0.9
1.2
0.8
Values with same letters are not significantly different at p b 0.05.
a
Each haplotype detail is shown in Table 5.
b
SNP ID indicates the SNP identification number relative to the location in the consensus sequence, with the first base of the consensus numbered 1.
140
T. Agusa et al. / Toxicology and Applied Pharmacology 236 (2009) 131–141
Fig. 7. Comparison of %DMA in urine among haplotype groups in linkage distribution (LD) cluster 1 and 2 from Hoa Hau and Liem Thuan in Vietnam. Bar and plots indicate arithmetic
mean and individual values, respectively.
heterozygote (mean,11.9%) showed a tendency to be higher than that for
the TT homozygote (mean, 10.2%) in the present study. From these
results, hetero type in 14458TC (287Met N Thr at amino acid base) may
have higher methylation ability from IA to MMA.
Since sex, age, and BMI were also significantly related to As
accumulation and methylation capacity as shown above, the results of
genetic differences may be submerged by the effects of such factors.
Thus, we adjusted concentrations and compositions of As using
multiple regression analysis to remove effects of these co-factors and
then reconsidered the genetic association with As concentration and
methylation. %DMA, AB concentration and %AB in urine of local
residents were not corrected by the analysis, because no significant
regression equations were obtained for these variables. The adjustment by the multiple regression analysis also provided similar results
to the analysis without the correction as described before. However,
significant associations between %MMA and SNP 12390, between
IMDAs level and SNP 12590, and between DMA, IAs, and IMDAs
concentrations and haplotype groups in LD cluster 2 disappeared after
the correction. On the contrary, following new associations were
obtained; higher MMA/IAs for 5913TC than that for 5913TT was
observed (p = 0.007), suggesting that the SNP may be related to the
1st methylation process of As. In addition, concentration of MMA for
TT homozygosis in SNP 4740 was higher than TC heterozygosis
(p = 0.013) and TT homozygote in SNP 5913 was associated with
increased SAs level in urine (p = 0.014). Adjusted DMA and IMDAs
concentrations in urine of G1-1 (4602AG/35991GA/37853GA) were
the highest among LD1 haplotype groups (p b 0.05). In haplotype
groups of the LD cluster 3, significant higher DMA/MMA was found in
G3-2 (6144AT/12390GC/14215CT/35587TC) than in G3-1 (6144AA/
12390GG/14215CC/35587TT). This indicates that G3-2 haplotype
group may have higher 2nd methylation capacity.
The present study identified 10 SNPs in AS3MT that may affect As
methylation process in residents of the Red River Delta, Vietnam.
Especially, we found that SNP 12390 in AS3MT was greatly associated
with DMA/MMA ratios in human urine, which was consistent with the
results in previous studies (Meza et al., 2005; Schläwicke Engström
et al., 2007) (Table 6). Therefore, SNP 12390 may be a universal
genotype which affects 2nd step methylation process of As. Furthermore, to our knowledge, significant relationships between SNPs 5913,
8979 and 37853, and urinary As profile were observed for the first time.
Interestingly, among the 10 SNPs, only SNP 14458 is located at the exon,
and other SNPs are at the intron, upstream or downstream region.
Further investigation is necessary to link non-exonic polymorphisms
with the function of AS3MT.
Acknowledgments
We are grateful to Dr. A. Subramanian, CMES, Ehime University for
critical reading of the manuscript. The authors wish to thank the staff of
the CETASD, Hanoi University of Science and Dr. H. Sakai, CMES, Ehime
University for their help in sample collection. We also acknowledge Ms. H.
Touma and Ms. N. Tsunehiro, staff of the es-BANK, CMES, Ehime University
for their support in sample management. This study was mainly
supported by Japan Society for the Promotion of Science (JSPS) for the
cooperative research program under the Core University Program
between JSPS and Vietnamese Academy of Science and Technology
(to M.I.) and by a Grant from Research Revolution 2002 (RR2002) Project
for Sustainable Coexistence of Human, Nature and the Earth (FY2002; to
H.I.). Financial assistance were also provided by Grants-in-Aid for
Scientific Research (S) (No. 20221003; to S.T.) and (A) (No. 19209025;
to H.T.) from JSPS, and 21st Century and Global COE Programs from the
Ministry of Education, Culture, Sports, Science, and Technology (MEXT),
T. Agusa et al. / Toxicology and Applied Pharmacology 236 (2009) 131–141
Japan and JSPS. The award of the JSPS Post Doctoral Fellowship for
Researchers in Japan to T. Agusa (No. 207871) is also acknowledged.
References
Agusa, T., Kunito, T., Fujihara, J., Kubota, R., Minh, T.B., Trang, P.T.K., Subramanian, A.,
Iwata, H., Viet, P.H., Tanabe, S., 2004. Contamination by trace elements in
groundwater of Vietnam. Biomed. Res. Trace Elem. 15, 339–341.
Agusa, T., Inoue, S., Kunito, T., Kubota, R., Minh, T.B., Trang, P.T.K., Subramanian, A., Iwata,
H., Viet, P.H., Tanabe, S., 2005. Widely-distributed arsenic pollution in groundwater
in the Red River Delta, Vietnam. Biomed. Res. Trace Elem. 16, 296–298.
Agusa, T., Kunito, T., Fujihara, J., Kubota, R., Minh, T.B., Trang, P.T.K., Iwata, H.,
Subramanian, A., Viet, P.H., Tanabe, S., 2006. Contamination by arsenic and other
trace elements in tube-well water and its risk assessment to humans in Hanoi,
Vietnam. Environ. Pollut. 139, 95–106.
Agusa, T., Kubota, R., Kunito, T., Minh, T.B., Trang, P.T.K., Chamnan, C., Iwata, H., Viet, P.H.,
Tana, T.S., Tanabe, S., 2007. Arsenic pollution in groundwater of Vietnam and
Cambodia: a review. Biomed. Res. Trace Elem. 18, 35–47.
Agusa, T., Kunito, T., Minh, T.B., Trang, P.T.K., Iwata, H., Viet, P.H., Tanabe, S., 2009.
Relationship of urinary arsenic metabolites to intake estimates in residents of the
Red River Delta, Vietnam. Environ. Pollut. 157, 396–403.
Arnold Jr., H.L., Odom, R.B., James, W.D., 1990. Andrew's Diseases of the Skin: Clinical
Dermatology, 8th ed. WB Saunders Company, Philadelphia.
Bailey, K.V., Ferro-Luzzi, A., 1995. Use of body mass index of adults in assessing individual
and community nutritional status. Bull. World Health Organ. 73, 673–680.
Berg, M., Tran, H.C., Nguyen, T.C., Pham, H.V., Schertenleib, R., Giger, W., 2001. Arsenic
contamination of groundwater and drinking water in Vietnam: a human health
threat. Environ. Sci. Technol. 35, 2621–2626.
Berg, M., Luzi, S., Trang, P.T.K., Viet, P.H., Giger, W., Stüben, D., 2006. Arsenic removal
from groundwater by household sand filters: comparative field study, model
calculations, and health benefits. Environ. Sci. Technol. 40, 5567–5573.
Challenger, F., 1945. Biological methylation. Chem. Rev. 36, 315–361.
Chiou, H.-Y., Hsueh, Y.-M., Hsieh, L.-L., Hsu, L.-I., Hsu, Y.-H., Hsieh, F.-I., Wei, M.-L., Chen,
H.-C., Yang, H.-T., Leu, L.-C., 1997. Arsenic methylation capacity, body retention, and
null genotypes of glutathione S-transferase M1 and T1 among current arsenicexposed residents in Taiwan. Mutat. Res. 386, 197–207.
Chowdhury, U.K., Rahman, M.M., Sengupta, M.K., Lodh, D., Chanda, C.R., Roy, S., Quamruzzaman, Q., Tokunaga, H., Ando, M., Chakraborti, D., 2003. Pattern of excretion of arsenic
compounds [arsenite, arsenate, MMA(V), DMA(V)] in urine of children compared to
adults from an arsenic exposed area in Bangladesh. J. Environ. Sci. Health. 38, 87–113.
Chung, J.S., Kalman, D.A., Moore, L.E., Kosnett, M.J., Arroyo, A.P., Beeris, M., Guha
Mazumder, D.N., Hernandez, A.L., Smith, A.H., 2002. Family correlations of arsenic
methylation patterns in children and parents exposed to high concentrations of
arsenic in drinking water. Environ. Health Perspect. 110, 729–733.
Cullen, W.R., Reimer, K.J., 1989. Arsenic speciation in the environment. Chem. Rev. 89,
713–764.
Fujihara, J., Kunito, T., Agusa, T., Yasuda, T., Iida, R., Fujii, Y., Takeshita, H., 2007.
Population differences in the human arsenic (+ 3 oxidation state) methyltransferase (AS3MT) gene polymorphism detected by using genotyping method. Toxicol.
Appl. Pharmacol. 225, 251–254.
Hayakawa, T., Kobayashi, Y., Cui, X., Hirano, S., 2005. A new metabolic pathway of
arsenite: arsenic–glutathione complexes are substrates for human arsenic
methyltransferase Cyt19. Arch. Toxicol. 79, 183–191.
Hernandez, A., Xamena, N., Surralles, J., Sekaran, C., Tokunaga, H., Quinteros, D., Creus,
A., Marcos, R., 2008. Role of the Met(287)Thr polymorphism in the AS3MT gene on
the metabolic arsenic profile. Mutat. Res. 637, 80–92.
141
Kubota, R., Kunito, T., Agusa, T., Fujihara, J., Monirith, I., Iwata, H., Subramanian, A., Tana,
T.S., Tanabe, S., 2006. Urinary 8-hydroxy-2′-deoxyguanosine in inhabitants
chronically exposed to arsenic in groundwater in Cambodia. J. Environ. Monit. 8,
293–299.
Kumar, R., Dunn, L.L., 1989. Designed diagnostic restriction fragment length polymorphisms for the detection of point mutations in ras oncogenes. Oncogene. Res. 4,
235–241.
Kurttio, P., Komulainen, H., Hakala, E., Kahelin, H., Pekkanen, J., 1998. Urinary excretion
of arsenic species after exposure to arsenic present in drinking water. Arch. Environ.
Contam. Toxicol. 34, 297–305.
Lin, S., Shi, Q., Nix, F.B., Styblo, M., Beck, M.A., Herbin-Davis, K.M., Hall, L.L., Simeonsson,
J.B., Thomas, D.J., 2002. A novel S-adenosyl-L-methionine:arsenic(III) methyltransferase from rat liver cytosol. J. Biol. Chem. 277, 10795–10803.
Lindberg, A.-L., Kumar, R., Goessler, W., Thirumaran, R., Gurzau, E., Koppova, K., Rudnai,
P., Leonardi, G., Fletcher, T., Vahter, M., 2007. Metabolism of low-dose inorganic
arsenic in a central European population: influence of sex and genetic polymorphisms. Environ. Health Perspect. 115, 1081–1086.
Loffredo, C.A., Aposhian, H.V., Cebrian, M.E., Yamauchi, H., Silbergeld, E.K., 2003.
Variability in human metabolism of arsenic. Environ. Res. 92, 85–91.
Mandal, B.K., Suzuki, K.T., 2002. Arsenic round the world: a review. Talanta 58,
201–235.
Mandal, B.K., Ogra, Y., Suzuki, K.T., 2001. Identification of dimethylarsinous and
monomethylarsonous acids in human urine of the arsenic-affected areas in West
Bengal, India. Chem. Res. Toxicol. 14, 371–378.
Matsubara, J., Machida, K., 1985. Significance of elemental analysis of hair as a means of
detecting environmental pollution. Environ. Res. 38, 225–238.
Meza, M.M., Yu, L., Rodriguez, Y.Y., Guild, M., Thompson, D., Gandolfi, A.J., Klimecki, W.T.,
2005. Developmentally restricted genetic determinants of human arsenic metabolism: association between urinary methylated arsenic and CYT19 polymorphisms in
children. Environ. Health Perspect. 113, 775–781.
Naranmandura, H., Suzuki, N., Suzuki, K.T., 2006. Trivalent arsenicals are bound to
proteins during reductive methylation. Chem. Res. Toxicol. 19, 1010–1018.
Nordstrom, D.K., 2002. Worldwide occurrences of arsenic in ground water. Science 296,
2143–2145.
Schläwicke Engström, K.S., Broberg, K., Concha, G., Nermell, B., Warholm, M., Vahter, M.,
2007. Genetic polymorphisms influencing arsenic metabolism: evidence from
Argentina. Environ. Health Perspect. 115, 599–605.
Smedley, P.L., Kinniburgh, D.G., 2002. A review of the source, behaviour and distribution
of arsenic in natural waters. Appl. Geochem. 17, 517–568.
Styblo, M., Drobna, Z., Jaspers, I., Lin, S., Thomas, D.J., 2002. The role of biomethylation in
toxicity and carcinogenicity of arsenic: a research update. Environ. Health Perspect.
110 (Suppl. 5), 767–771.
Tanabe, S., 2006. Environmental Specimen Bank in Ehime University (es-BANK), Japan
for global monitoring. J. Environ. Monit. 8, 782–790.
Vahter, M., 2000. Genetic polymorphism in the biotransformation of inorganic arsenic
and its role in toxicity. Toxicol. Lett. 112–113, 209–217.
Vahter, M., 2002. Mechanisms of arsenic biotransformation. Toxicol. 181–182, 211–217.
WHO, 2004. Guidelines for Drinking Water Quality, 3rdedition. World Health
Organization, Geneva, Switzerland.
Watanabe, C., Inaoka, T., Kadono, T., Nagano, M., Nakamura, S., Ushijima, K., Murayama,
N., Miyazaki, K., Ohtsuka, R., 2001. Males in rural Bangladeshi communities are
more susceptible to chronic arsenic poisoning than females: analyses based on
urinary arsenic. Environ. Health Perspect. 109, 1265–1270.
Wood, T.C., Salavagionne, O.E., Mukherjee, B., Wang, L., Klumpp, A.F., Thomae, B.A.,
Eckloff, B.W., Schaid, D.J., Wieben, E.D., Weinshilboum, R.M., 2006. Human arsenic
methyltransferase (AS3MT) pharmacogenetics: gene resequencing and functional
genomics studies. J. Biol. Chem. 281, 7364–7373.