DSpace at VNU: DNA barcodes for globally threatened marine turtles: a registry approach to documenting biodiversity
Bạn đang xem bản rút gọn của tài liệu. Xem và tải ngay bản đầy đủ của tài liệu tại đây (326.46 KB, 12 trang )
Molecular Ecology Resources (2010) 10, 252–263
doi: 10.1111/j.1755-0998.2009.02747.x
DNA BARCODING
DNA barcodes for globally threatened marine turtles:
a registry approach to documenting biodiversity
EUGENIA NARO-MACIEL,*† BRENDAN REID,‡ NANCY N. FITZSIMMONS,§ MINH LE,¶**
ROB DESALLE* and G E O R G E A M A T O *
*Sackler Institute for Comparative Genomics, American Museum of Natural History, New York, NY 10024, USA, †Center for
Biodiversity and Conservation, American Museum of Natural History, New York, NY 10024, USA, ‡Department of Ecology,
Evolution and Environmental Biology, Columbia University, New York, NY 10027, USA, §Institute for Applied Ecology,
University of Canberra, Canberra, ACT 2601, Australia, ¶Center for Natural Resources and Environmental Studies, Vietnam
National University, 19 Le Thanh Tong St., Hanoi, Vietnam, **Department of Herpetology, American Museum of Natural History,
New York, NY 10024, USA
Abstract
DNA barcoding is a global initiative that provides a standardized and efficient tool to
catalogue and inventory biodiversity, with significant conservation applications. Despite
progress across taxonomic realms, globally threatened marine turtles remain underrepresented in this effort. To obtain DNA barcodes of marine turtles, we sequenced a segment of
the cytochrome c oxidase subunit I (COI) gene from all seven species in the Atlantic and Pacific Ocean basins (815 bp; n = 80). To further investigate intraspecific variation, we sequenced
green turtles (Chelonia mydas) from nine additional Atlantic ⁄ Mediterranean nesting areas
(n = 164) and from the Eastern Pacific (n = 5). We established character-based DNA barcodes
for each species using unique combinations of character states at 76 nucleotide positions. We
found that no haplotypes were shared among species and the mean of interspecific variation
ranged from 1.68% to 13.0%, and the mean of intraspecific variability was relatively low
(0–0.90%). The Eastern Pacific green turtle sequence was identical to an Australian haplotype,
suggesting that this marker is not appropriate for identifying these phenotypically distinguishable populations. Analysis of COI revealed a north–south gradient in green turtles of
Western Atlantic ⁄ Mediterranean nesting areas, supporting a hypothesis of recent dispersal
from near equatorial glacial refugia. DNA barcoding of marine turtles is a powerful tool for
species identification and wildlife forensics, which also provides complementary data for
conservation genetic research.
Keywords: Chelonia mydas, COI, DNA barcoding, mtDNA, sea turtle, species identification
Received 23 March 2009; revision received 3 June 2009; accepted 5 June 2009
Introduction
In recent years, DNA barcoding has become one of the
leading international programmes to catalogue and
inventory life on earth in light of current biodiversity loss
(Hebert et al. 2004a, b; Hebert & Gregory 2005; Janzen
et al. 2005; Savolainen et al. 2005; Smith et al. 2005). In
this effort, data are collected from an agreed-upon
DNA sequence in a standardized, rapid, cost-efficient
and straightforward manner for species identification
Correspondence: Eugenia Naro-Maciel, Fax: +1 212 769 5292;
E-mail:
purposes and to aid in species discovery (DeSalle et al.
2005; DeSalle 2006; Rach et al. 2008). Information from
this unique identifier, the cytochrome c oxidase subunit I
(COI, or cox1) gene, can offer the necessary resolution for
distinguishing among species rapidly, providing insights
into species diversification and molecular evolution (but
see Moritz & Cicero 2004). DNA barcoding of threatened
species provides an identification system for these
species or their parts, allowing for rapid classification of
illegally harvested organisms. The initiative enhances
taxonomic understanding, which is key to developing
appropriate conservation strategies (DeSalle & Amato
2004), and results can readily be made available to
Ó 2009 Blackwell Publishing Ltd
D N A B A R C O D I N G 253
researchers, conservation practitioners, or other interested parties. Even so, prior to this study, globally threatened marine turtles were poorly represented in the
DNA barcoding initiative.
Marine turtles have inhabited the Earth for over
100 Myr (Hirayama 1998), and occupy diverse ecosystems throughout their highly migratory life cycles
(Bjorndal & Jackson 2003). After hatching from eggs on
nesting beaches, the young disperse into the ocean. As
juveniles, some species, including green (Chelonia mydas)
and hawksbill (Eretmochelys imbricata) turtles, leave the
pelagic environment and move to coastal feeding
grounds, while others, including the leatherback (Dermochelys coriacea), continue to feed in the open ocean (Musick & Limpus 1996; Hirth 1997). Adults undertake
breeding migrations between feeding grounds and nesting areas that may be thousands of kilometres apart,
and many females return to nest in the vicinity of their
natal beach, a phenomenon known as natal homing
(Carr 1967).
Marine turtles are threatened worldwide due to overharvest, fisheries interactions, habitat loss, climate
change, pollution, disease and other factors, thus emphasizing the need for effective conservation measures, as
well as the potential for DNA barcoding applications.
There are seven widely recognized species of marine
turtle (Table 1), as well as a distinct form of Chelonia mydas
occurring in the Eastern Tropical Pacific whose taxonomic
status has been debated (Kamezaki & Matsui 1995;
Parham & Zug 1996; Pritchard 1996; Karl & Bowen 1999;
Naro-Maciel & Le et al. 2008). All marine turtle species are
listed under Appendix I of the Convention on International Trade in Endangered Species of Wild Fauna and
Flora (CITES), and included on the World Conservation
Union’s IUCN (2008) Red List of Threatened Species.
Wildlife trade of these species can include meat, eggs,
leather, shell and bone, for which the species or location
of geographical origin may be difficult to identify using
conventional means. In addition, animals caught as
fisheries bycatch or stranding onshore may be damaged
beyond recognition. By identifying these animals to
species and providing a standardized registry for
documenting genetic diversity within this group, DNA
barcoding promises to advance conservation and
research.
There are different ways to carry out species identification using DNA barcodes. In commonly used
approaches, sequences are grouped using genetic distance, sometimes in combination with tree-building
methods (Hebert et al. 2003a, b; Steinke et al. 2005;
). Sequences can be
assigned to the most similar group found in a BLAST
search (Altschul et al. 1990). Genetic distances may also
be used to build neighbour-joining trees (Tamura et al.
Ó 2009 Blackwell Publishing Ltd
2004), and species assigned to the taxon they cluster with
on these trees (Hebert et al. 2003a, b). However results
may not be accurate if, for example, there is incomplete
sampling in the database, and the nearest neighbour species is not the most closely related one (Koski & Golding
2001). Further, despite the wide usage of these methods,
there is no threshold for genetic distance that can be
used consistently to define species (Goldstein et al. 2000;
Moritz & Cicero 2004; DeSalle et al. 2005). Overlap
between inter and intraspecific divergence may present
obstacles to correct assignment of query sequences, due
to high intraspecific genetic variability or distances
between species that are lower than within species
(Meyer & Paulay 2005; Wiemers & Fiedler 2007; Rach
et al. 2008). Consistent thresholds may also fail to be
established due to variable effects of mutation rate and
effective population size, among other factors. It is therefore useful to have a measure of certainty and risk in
assignment of query sequences, and statistical methods
are being developed to this end using a Bayesian framework (Nielsen & Matz 2006) and a decision theoretic and
model-based approach (Abdo & Golding 2007; http://
info.mcmaster.ca/TheAssigner).
These approaches also neglect to include information
about diagnostic characters, or nucleotides that can be
used to identify species and populations through their
presence or absence, a method more consistent with
classical taxonomy (DeSalle et al. 2005). Diagnostic
characters, also referred to as characteristic attributes
(CAs, Rach et al. 2008), can be classified as pure or
private (DeSalle et al. 2005). Pure diagnostic characters
are those shared among all elements in a clade, but
absent from members of other clades at a node. Private
diagnostic characters, on the other hand, occur in some
members of a clade, but are not found in members of
other clades at a node. CAs can be simple (occurring at
a single nucleotide position; DeSalle et al. 2005) or compound (occurring at multiple nucleotide positions; DeSalle et al. 2005). By using CAs for diagnosis, error from
incorrect grouping with the nearest neighbor is ruled
out. By not relying on tree-building to assign species,
the problem of using methods designed for hierarchically structured entities being applied to nonhierarchical
groups, such as populations, is also avoided (DeSalle
et al. 2005).
In this research, we provide the first barcode
sequences for marine turtles of all extant species sampled
in the Atlantic and Pacific, and investigate the utility of
COI for barcoding purposes. We assess the marker’s
potential for species identification in marine turtles with
relatively slow molecular evolution (Avise et al. 1992;
FitzSimmons et al. 1995). We employ a character-based
approach, the characteristic attribute organization system
(CAOS; Sarkar et al. 2002a, b) and compare results to
Ada Foah, Ghana (4)
New York, USA (5)
*Sample collected at a feeding rather than nesting area.
Lepidochelys
kempii*
Lepidochelys
olivacea
Natator
depressus
1 (LO-AP1)
1 (LK-A1)
1 (EI-A1)
Puerto Rico, USA (5)
1 (CM-A1)
1 (CM-A1)
1 (CM-A1)
1 (CM-A1)
1 (CM-A2)
1 (CM-A2)
1 (CM-A2)
1 (CM-A2)
1 (CM-A2)
2 (CM-A1,
n = 2;
CM-A2,
n = 32)
1 (DC-API)
Florida, USA (11)
Tortuguero, Costa Rica (8)
Quintana Roo, Mexico (3)
Cyprus (9)
Atol das Rocas, Brazil (35)
Trindade Island, Brazil (38)
Suriname (10)
Ascension Island, UK (25)
Guinea Bissau (2)
Aves Island, Venezuela (34)
Chelonia mydas
1 (CC-A1)
# Haplotypes
(Designation)
Mayumba, Gabon (7)
Georgia, USA (5)
Caretta caretta
Chelonia mydas of the Eastern Pacific
Dermochelys
coriacea
Eretmochelys
imbricata
Sample site (n)
Taxon
Atlantic
GQ152890
GQ152891
GQ152887
GQ152876
GQ152881
’’
’’
’’
GQ152882
’’
’’
’’
’’
GQ152881;
GQ152882
GQ152889
GenBank
Accession
numbers
’’
’’
GQ152878
’’
GQ152879;
GQ152880
1 (CM-PI)
1 (CM-PI)
1 (CM-P2)
1 (CM-P2)
2 (CM-P3;
CM-P4)
GQ152883
’’
’’
GQ152884
’’
1 (LO-AP1)
1 (ND-P1)
1 (ND-P1)
1 (ND-P1)
1 (ND-P2)
1 (ND-P2)
Gulf of Carpentaria,
Australia (2)
Maret Island, Australia (1)
Barrow Island, Australia (2)
Duck Island, Australia (1)
Curtis Island, Australia (3)
GQ152890
GQ152877
GQ152876
’’
GQ152885
GQ152886
GQ152886
’’
’’
GQ152877
1 (CC-P1)
1 (CC-P1)
1 (CM-PI)
1 (CM-PI)
1 (DC-API)
1 (DC-API)
2 (EI-P1, n = 2;
EI-P2, n = 2)
1 (EI-P2)
GQ152888
GenBank
Accession
numbers
1 (CC-P1)
# Haplotypes
(Designation)
Oxley Islands, Australia (5)
Michoacan, Mexico (5)
Perth, Australia (2)
Solomon Islands (5)
Milman Island,
Australia (4)
Rosemary Island,
Australia (4)
La Roche Percee, New
Caledonia (2)
Swain Reef, Australia (2)
Dirk Hartog, Australia (2)
Cocos (Keeling) Islands,
Australia (1)
Lacepedes, Australia (2)
Port Bradshaw, Australia (1)
Heron Island, Australia (1)
Scott Reef, Australia (1)
Bramble Cay, Australia (2)
Sample site (n)
Pacific
12
5
2
10
30
11
6
Pu
0
0
0
1
0
1
0
Pr
Table 1 Sampling locations at nesting beaches in the Atlantic or Pacific Oceans for each of the seven sea turtle species, along with green turtles sampled from the Eastern Pacific and
Mediterranean Sea. Also listed are number of haplotypes, their designations, GenBank Accession numbers (with the symbol ’’ meaning ‘same as above’), number of pure diagnostic
characters (Pu) and number of private diagnostic characters shared by at least 80% of group members (Pr)
254 D N A B A R C O D I N G
Ó 2009 Blackwell Publishing Ltd
D N A B A R C O D I N G 255
those obtained using typically employed phenetic and
tree-building methods. We also discuss the applicability
of a widely characterized genetic marker in marine turtles, the mitochondrial DNA (mtDNA) control region, for
DNA barcoding purposes. We examine intraspecific variation over a wide geographical range to ensure comprehensive representation and seek evidence of cryptic
species. We further explore the utility of the COI gene in
shedding light on the group’s evolutionary history and
for population genetic applications. By obtaining DNA
barcodes for globally threatened marine turtles, this
study promises to aid in the enforcement of endangered
species legislation, augment our knowledge of molecular
evolution within this group and substantially contribute
to the global DNA barcoding initiative’s objective to document the diversity of life.
Materials and methods
Taxonomic sampling and laboratory analysis
We obtained blood or tissue samples from a wide global
distribution for each species, and complemented this
with a focused study of green turtles within the Atlantic
Ocean and Mediterranean Sea. This resulted in 249
samples that were analysed from individual or multiple
rookeries in the Atlantic and Pacific Oceans, the Mediterranean Sea and one feeding ground located in New York,
USA (Table 1). DNA extractions were performed using a
DNeasy Tissue Kit as per instructions for animal tissues
or blood (QIAGEN Inc.) or by a salting out procedure.
Polymerase chain reactions (PCR) were carried out using
standard reagents and negative controls, with the primers L-turtCOI (5¢-ACTCAGCCATCTTACCTGTGATT-3¢)
and H-turtCOIc (5¢-TGGTGGGCTCATACAATAAAGC3¢) designed for a freshwater turtle by Stuart & Parham
(2004). These primers were chosen because they span the
COI segment utilized for DNA barcoding of other turtles
(). PCR conditions were
as follows: 95 °C for 5 min; 30–35 cycles of 95 °C for 45 s,
54 °C for 45 s, 72 °C for 45 s; 72 °C for 6 min followed by
4 °C storage. In rare instances where the sample was
degraded, an additional PCR was performed using the
PCR product as template. PCR products were then
cleaned using the Ampure system with a Biomek automated apparatus. Sequencing reactions were conducted
using standard protocols and BigDye reagents (PerkinElmer), followed by alcohol precipitations. PCR products
were separated using an ABI 3730 sequencer, and
sequencing was carried out in both directions. Alternatively, PCR products from Pacific region samples were
cleaned using a polyethylene glycol protocol (Sambrook
& Russell 2001) and sequenced by Macrogen. Sequences
were aligned using the program Sequencher v4.6
Ó 2009 Blackwell Publishing Ltd
(Gene Codes Corporation) and posted on GenBank and
BOLD.
Data analysis
Genetic diversity. Mitochondrial haplotype (h) and
nucleotide (p) diversities (Nei 1987) were calculated
using the Arlequin program (v3.0; Excoffier et al. 2005).
Variable sites, transition and transversion rates and
coding differences in the whole data set were identified
using MEGA v4 (Tamura et al. 2007). Haplotype networks
based on statistical parsimony were constructed to
elucidate relationships among COI haplotypes using TCS
v1.21 (Clement et al. 2000).
Character-based diagnosis. We used the CAOS (Sarkar
et al. 2002a, b) to identify diagnostic characters for species
identification. We conservatively relied only on simple
CAs, not including compound characters. We analysed
pure CAs and private CAs with frequencies above 80%,
following Rach et al. (2008). A guide tree was created
using the maximum parsimony module in PHYLIP (v3.67;
Felsenstein 2007) and incorporated into a NEXUS file
containing COI sequence data in MacClade (v4.06;
Maddison & Maddison 2002). Then, the P-Gnome program (Rach et al. 2008) searched each node, starting with
the basal node, to identify diagnostic characters using the
CAOS algorithm.
Genetic distance and tree-building. A BLAST search of
GenBank was carried out using our COI sequences, and
the species most closely matching our sequences was
recorded. Intraspecific as well as mean interspecific pairwise distances were calculated using p-distances and the
Kimura 2-parameter (K2P) distance model, commonly
used in barcoding studies, in MEGA v4 (Tamura et al.
2007). MEGA was also used to create a neighbour-joining
tree based on pairwise K2P distances for all COI
sequences. Both of these analyses were performed
through the online BOLD interface (Ratnasingham &
Hebert 2007) as well, giving similar results.
Control region analysis. Character-based species diagnosis and analysis of genetic divergence were also carried
out for publicly available mitochondrial control region
sequences obtained for each marine turtle species from
GenBank and the Archie Carr Center for Sea Turtle
Research ( These
sequences (n = 367 total) were aligned in MEGA and
trimmed to a 395-bp common fragment to account for
variations in sequence length. Of the publicly available
sequences, 165 were from green turtles (Chelonia mydas,
65 from the Atlantic, 100 from the Pacific), 89 were from
loggerhead turtles (Caretta caretta; 80 Atlantic, 9 Pacific),
256 D N A B A R C O D I N G
19 were from leatherback turtles (Dermochelys coriacea; 9
Atlantic, 8 Pacific, and 2 described as occurring in the
Atlantic and Pacific), 64 were from hawksbill turtles
(58 Atlantic, 6 Pacific), 4 were from Kemp’s ridley turtles
(Lepidochelys kempii, Atlantic), 25 were from olive ridley
turtles (Lepidochelys olivacea, 2 Atlantic, 23 Pacific) and 1
was from a flatback turtle (Natator depressus, Pacific). Any
sequences that were from putative hybrids were
excluded.
CM-P4 ND-P1 CC-P1 EI-P1 LO-AP1 LK-A1 DC-AP1
ND-P2
Results
CM-P1 CM-P2
Genetic diversity
Cytochrome c oxidase subunit I sequences were obtained
from 249 individuals (815 bp; 271 amino acids). There
were 159 variable sites in the data set, representing 19.5%
of the data set, with T<->C transitions dominating. Most
of the nucleotide changes were synonymous; however,
two (0.7% of the data set) resulted in amino acid
(AA) changes. These were AA 65: isoleucine to valine
(Dermochelys coriacea) and AA 259: arginine to serine
(Eretmochelys imbricata). The COI fragment was somewhat variable across marine turtle taxa, with haplotype
and nucleotide diversities (Table 2) generally lower than
or comparable to those reported for the mtDNA control
region, although direct comparisons were not possible
due to variation in sampling (Encalada et al. 1996, 1998;
Bowen et al. 1998, 2007; Dutton et al. 1999; Shanker et al.
2004; Dethmers et al. 2006).
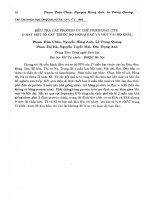
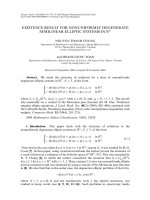
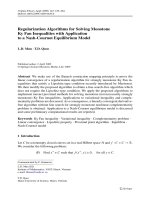
All COI haplotypes were separated into distinct
networks by species using a 95% connection limit in TCS
(Fig. 1). The number of haplotypes within hawksbill
(n = 3) and green turtles (n = 6) was the greatest, while
there were no COI sequence differences between ocean
basins for olive ridley and leatherback turtles, with each
represented by a single haplotype (Fig. 1; Table 2). Two
different haplotypes were found in loggerhead turtles,
each specific to an ocean basin. There were little or no
differences among haplotypes within the species endemic to ocean basins: the Kemp’s ridley, occurring only in
the Atlantic, was characterized by a single haplotype,
Species
Alleles
Haplotype
diversity
Caretta caretta
Chelonia mydas
Dermochelys coriacea
Eretmochelys imbricata
Lepidochelys kempii
Lepidochelys olivacea
Natator depressus
2
6
1
3
1
1
2
0.5455
0.3983
0.0000
0.6667
0.0000
0.0000
0.5556
EI-P2
CM-P3
CC-A1
CM-A2
CM-A1
EI-A1
Fig. 1 COI haplotype network based on statistical parsimony.
Haplotype designations correspond to those in Table 1. Lines
indicate a single base pair substitution. The size of the circle or
square is proportional to the haplotype frequency. Abbreviations
are as follows: DC, Dermochelys coriacea; CM, Chelonia mydas; ND,
Natator depressus; CC, Caretta caretta; EI, Eretmochelys imbricata;
LO, Lepidochelys olivacea; LK, Lepidochelys kempii. Atlantic haplotypes are indicated by an A, Pacific haplotypes are indicated by
a P, and those found in both ocean basins are indicated by an
AP. The green turtle haplotypes were from Florida (n = 5) and
Ascension Island (n = 5).
Standard
deviation
Nucleotide
diversity
Standard
deviation
Sample
size
±0.0722
±0.0392
±0.0000
±0.0782
±0.0000
±0.0000
±0.0902
0.00608
0.00143
0.00000
0.00834
0.00000
0.00000
0.00068
±0.00362
±0.00103
±0.00000
±0.00472
±0.00000
±0.00000
±0.00070
11
188
14
13
5
9
9
Table 2 Number of alleles, haplotype
diversity (h) and nucleotide diversity (p),
with sample size, of COI for marine turtle
species
Ó 2009 Blackwell Publishing Ltd
D N A B A R C O D I N G 257
and the flatback, found only in the Pacific, displayed two
similar haplotypes (0.07% divergence, Table 3; Fig. 1).
No haplotypes were shared among species.
Character-based diagnosis
Character-based DNA barcodes were established for
each a priori defined species using unique combinations
of character states at 76 nucleotide positions (Table 4).
Leatherback turtles were separated from all other marine
turtle species by 30 diagnostic characters, while two CAs
defined Kemp’s ridleys. Diagnostic sites specific to ocean
basins were found within green and hawksbill turtles.
Atlantic hawksbill turtles were diagnosed by two T’s at
positions 430 and 753, while Pacific hawksbill turtles
were diagnosed by an A at position 339, and a C at position 396. Atlantic green turtles were diagnosed by two
T’s at positions 240 and 573. However, no haplotypes
diagnosed green turtle samples in the Eastern Pacific
from other Pacific green turtles; indeed the haplotype
from green turtles of the Eastern Pacific exactly matched
that of green turtles sampled in Australia.
Genetic distance and tree-building
If COI sequences were assigned to the most similar group
in a BLAST search of sequences posted on GenBank, the
results would have only been partially correct. The
species with COI sequences already posted on GenBank
were in fact most similar to their conspecifics. However,
the remaining four species that did not have COI
sequences posted on GenBank—leatherback, flatback,
loggerhead and Kemp’s ridley turtles—were most similar, in the BLAST search, to hawksbill, green, hawksbill and
olive ridley turtles, respectively.
All mean values of intraspecific divergence at COI
were below 1% (Table 3; Fig. 2), with pairwise K2P values
of 0% for leatherback turtles and both ridley species, and
ranging from 0% to 1.75% in hawksbill turtles, 0% to
0.12% in flatback turtles and 0% to 1.12% in loggerhead
and green turtles. In Western Atlantic ⁄ Mediterranean
green turtle populations, a gradient was detected for COI
haplotypes. Turtles from most northern nesting sites
(Florida; Costa Rica; Mexico; and Cyprus) were characterized by one haplotype, while those from southern or near
equatorial nesting sites (Rocas and Trindade, Brazil;
Ascension Island; Surinam) were fixed for a second
haplotype (Fig. 3). A mixture of both haplotypes was
found at Aves Island, Venezuela, a centrally located rookery, and the ‘southern’ haplotype was fixed in the eastern
colony of Guinea Bissau (Fig. 3). Interspecific divergence
levels using the K2P model ranged from 1.68% between
the Lepidochelys species, to as high as 13.0% between green
and leatherback turtles (Table 3; Fig. 2). Values produced
using the BOLD program (Ratnasingham & Hebert
2007) were similar (data not shown). Trees based on COI
Table 3 Divergence values for: (A) COI (this study) and (B) D-loop (sequences from GenBank). Average within-species divergence
calculated using the Kimura 2-parameter model (K2P) is on the diagonal. Average pairwise divergences between species are above
(p-distance) and below (K2P) the diagonal
(A) COI divergence
Caretta
caretta
Chelonia
mydas
Dermochelys
coriacea
Eretmochelys
imbricata
Lepidochelys
kempii
Lepidochelys
olivacea
Natator
depressus
Caretta caretta
Chelonia mydas
Dermochelys coriacea
Eretmochelys imbricata
Lepidochelys kempii
Lepidochelys olivacea
Natator depressus
0.63
9.31
11.70
8.15
5.30
5.86
8.84
8.56
0.54
13.01
9.07
8.36
8.07
8.31
10.65
11.68
0.00
10.02
11.09
11.55
11.86
7.59
8.39
9.43
0.90
7.50
7.64
9.94
5.04
7.76
10.15
7.02
0.00
1.68
9.73
5.55
7.52
10.53
7.15
1.65
0.00
9.71
8.20
7.69
10.72
9.14
8.94
8.94
0.07
(B) D-loop divergence
Caretta
caretta
Chelonia
mydas
Dermochelys
coriacea
Eretmochelys
imbricata
Lepidochelys
kempii
Lepidochelys
olivacea
Natator
depressus
Caretta caretta
Chelonia mydas
Dermochelys coriacea
Eretmochelys imbricata
Lepidochelys kempii
Lepidochelys olivacea
Natator depressus
2.30
15.30
21.04
9.64
10.69
11.13
14.08
13.65
4.96
24.75
16.06
15.70
15.62
12.95
18.12
20.80
1.02
20.19
23.31
18.09
22.21
8.91
14.35
17.47
2.30
12.73
12.15
16.65
9.82
14.06
19.78
11.63
0.00
6.35
14.37
10.20
13.96
15.96
11.12
6.01
1.48
16.23
12.72
11.80
19.12
14.81
13.00
14.40
N⁄A
All values are given in percentages.
Ó 2009 Blackwell Publishing Ltd
4
1
4
4
0
8
C
C
C
C
T
C
C
Taxa (n)
Dermochelys coriacea (14)
Chelonia mydas (188)
Natator depressus (9)
Eretmochelys imbricata (13)
Caretta caretta (11)
Lepidochelys olivacea (11)
Lepidochelys kempii (5)
T
C
C
C
C⁄A
C
C
4
2
3
C
T
C
C
C
C
C
2
7
G
C
C
C
C
C
C
4
2
6
C
C
T
C
C
C
C
3
3
C
C
C
C
C
C
T
4
2
9
C
C
C
T
C
C
C
3
4
T
A
A
A
A⁄G
A
A
4
4
1
A
A
A
G
A
A
A
3
6
A
T
C
C
T
T
T
4
4
4
A
C
T
A
A
A
A
6
3
A
T
G
C
C⁄T
C
C
4
5
6
C
C
T
C
C
C
C
6
6
T
C
C
C
C
C
C
4
6
2
A
A
G
A
A
A
A
7
2
C
C
C
C
C
T
C
4
6
8
C
T
C
C
C
C
C
7
9
T
C
C
C
C
C
C
5
0
1
C
C
C
C
C
C
T
9
7
T
C
C
C
C
C
C
5
4
1
G
A
A
A
A
A
A
1
0
8
T
T
T
T
T
C
T
5
5
9
C
T
T
T
T
T
T
1
1
4
A
A
A
A⁄G
T
G
G
5
7
0
C
C
C
T
C
C
C
1
7
7
T
C
T
T
T
T
T
5
8
5
G
A
A
A
A
A
A
1
9
3
A
C
C
C
T
T
T
5
9
1
C
T
C
C
T
A
C
2
0
4
C
T
T
T
T
T
T
5
9
4
C
T
C
C
C
C
C
2
1
6
T
T
T
T
C
T
T
6
0
6
C
C
C
C
T
C
C
2
2
9
T
C
C
C
C
C
C
6
3
3
T
A
A
A
A
A
A
2
3
1
T
C
T
T
T
T
T
6
3
9
A
T⁄
C
A
A
G
A
2
4
0
T
T
T
C
T
T
T
6
4
2
G
A
A
A
A
A
A
2
5
2
C
C
T
C
C
C
C
6
7
6
A
T
T
T
T
T
T
2
6
4
C
T
C
C
C
C
C
6
8
7
C
C
T
C
C
C
C
2
7
3
A
T
G
T
T
T
T
6
9
9
A
A
G
A
A
A
A
2
9
1
T
C
C
C
C
C
C
7
1
7
C
T
C
A
T
T
T
2
9
7
A
T
C
T
C
T
T
7
2
0
G
A
A
A
A
A
A
3
0
3
C
T
T
T
T
T
T
7
2
9
T
T
T
A
T
T
T
3
1
2
A
T
C
C
C
T
C
7
4
1
C
C
C
C
C
T
C
3
1
3
T
C
C
C
C
C
C
7
4
4
T
C
T
G⁄A
C
C
C
3
3
9
T
C
T
T
T
T
T
7
5
6
A
A
G
A
A
A
A
3
4
2
G
G
G
T
G
G
G
7
6
0
A
T
C
C⁄T
C
T
T
3
4
5
T
T
T
T
C
A
A
7
6
5
C
T
C
C
C
C
C
3
5
1
T
C
C
C
C
C
C
7
8
3
C
A
A
A
G
A
G
3
6
0
C
C
T
C
C
C
C
7
8
6
T
C
C
C
C
C
C
3
6
6
A
G
A
A
A
A
A
8
0
7
C
T
T
T
T
T
T
3
7
0
C
C
C
A
C
C
C
8
1
3
A
G
A
A
A
A
A
3
8
4
T
C⁄T
T
A
T
T
T
4
0
2
The pure diagnostic characters, or those shared by all sampled individuals of one species, but not found in any individuals of the other species, are shaded in grey. Also in grey at
position 339 are private characters, or those found in some members of a species but not in other species, that diagnose Eretmochelys imbricata (G ⁄ A). At position 63, a ‘C’ diagnoses
Chelonia mydas, while a ‘T’ diagnoses Natator depressus. Similarly, at positions 456 and 699 an ‘A’ diagnoses Dermochelys coriacea, while a ‘G’ diagnoses Natator depressus.
T
T
T
T
C
T
T
T
T
C
T
T
T
T
T
C
C
C
C
C
C
1
2
Chelonia mydas (188)
Natator depressus (9)
Eretmochelys imbricata (13)
Caretta caretta (11)
Lepidochelys olivacea (11)
Lepidochelys kempii (5)
Taxa (n)
9
Position
Table 4 DNA barcodes for marine turtles based on pure diagnostic characters at selected nucleotide positions
258 D N A B A R C O D I N G
Ó 2009 Blackwell Publishing Ltd
D N A B A R C O D I N G 259
7
6
Frequency
5
4
3
2
1
3.
99
4.
9
5
– 9
5
6 .99
–
6
7 .99
–
7
8 .99
–
8
9 .99
–
10 9.9
– 9
11 10.
– 99
12 11.
– 99
13 12.
– 99
13
.9
9
–
–
3
4
2.
99
99
2
–
1.
–
1
0
–
0.
99
0
Sequence divergence (% K2P)
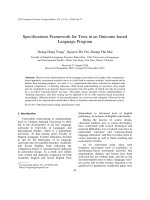
Fig. 2 Intra- and interspecific divergences in marine turtles
calculated using the Kimura 2-parameter model. Intraspecific
divergences are in white (mean = 0.27%; n = 7), and inter-specific
divergences are in black (mean = 8.89%; n = 21).
GenBank. No haplotypes were shared among species.
However, at the more variable control region, no pure
diagnostic characters were found for loggerhead, green,
or olive ridley turtles, while private diagnostics at over
80% frequency were found for green turtles (n = 7). Of
the remaining species, there were pure (Pu) and sometimes private (Pr) diagnostic characters defining leatherback (nPu = 22; nPr = 1), flatback (nPu = 9; nPr = N ⁄ A),
hawksbill (nPu = 8; nPr = 4) and Kemp’s ridley (nPu = 2;
nPr = 0) turtles. Mean levels of genetic divergence were
higher for the D-loop than for COI (D-loop divergence
range using K2P model: interspecific: 6.35–24.75%;
intraspecific: 0–4.96%; Table 3), and the range of pairwise
divergences within variable species was larger (loggerhead turtles: 0–6.94%; green turtles: 0–12.28%; leatherback turtles: 0–1.69%; hawksbill turtles: 0–7.68%;
olive ridley turtles: 0–4.61%; other species: N ⁄ A). In the
neighbour-joining tree, all taxa grouped correctly with
their conspecifics.
Discussion
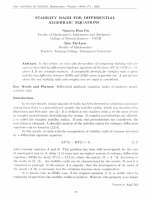
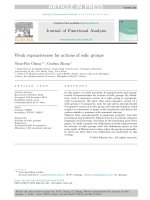
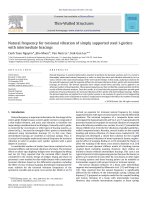
0
1200 2400 Km
Fig. 3 COI haplotype frequencies of Atlantic and Mediterranean
green sea turtle nesting areas, with respect to the Equator. Haplotype designations correspond to those in Table 1, with CM-A1
shaded black and CM-A2 shown in white.
sequences grouped species correctly with their conspecifics in all cases (data not shown).
Control region analysis
Character-based species diagnosis and tree-building using genetic distance were also carried out for
mitochondrial control region sequences posted on
Ó 2009 Blackwell Publishing Ltd
DNA barcoding promises to be a powerful tool for species identification and other conservation genetic applications in marine turtles, which are unique on the
evolutionary tree of turtles for occupying the marine
realm, and widely known for their extensive migrations.
Species identification, one of the main goals of the DNA
barcoding initiative, was successfully carried out using
their COI sequences. Even though these are ancient taxa
with relatively slow molecular evolution (Avise et al.
1992; FitzSimmons et al. 1995), diagnostic sites were
obtained for each of the seven marine turtle species at
COI. Distance-based analysis of COI sequences consistently grouped members of the same species, although a
complete baseline sample was necessary for correct
assignment using phenetic methods. There was no convincing evidence of cryptic species revealed in this
research, a result that is concordant with many other
genetic studies of marine turtles. In addition, the
barcodes provided insight into population structure and
history. The COI marker was more suitable for barcoding
objectives than mitochondrial control region sequences.
However, hybridization is an important source of error
for analyses relying solely on a mitochondrial marker,
including in this group that is known to hybridize
despite ancient separations (Conceic¸a˜o et al. 1990; Karl &
Bowen 1995; Seminoff et al. 2003; Lara-Ruiz et al. 2006).
Cytochrome c oxidase subunit I barcodes were
obtained for each of the a priori defined seven marine
turtle species using unique combinations of their CAs
(Table 4). The diagnostics were reliable, based on pure as
well as private characters, with no haplotypes shared
among species (Table 4; Fig. 1). On the highest end of the
260 D N A B A R C O D I N G
range, 30 CAs diagnosed the leatherback turtle (Table 4).
Of interest, five CAs diagnosed olive ridleys, while two
diagnosed their sister taxon, Kemp’s ridleys. There has
been some debate about whether the ridleys are in fact
separate species (Bowen et al. 1991), and the COI
barcodes point to the validity of current species designations. For marine turtles, we found that the characterbased approach was rapid through application of the
CAOS algorithm using discrete characters, more consistent with classical taxonomy than distance-based
methods and did not rely on somewhat arbitrary genetic
distance thresholds for species identification. Importantly, the character-based approach was reliable—no
species diagnoses could be made if the query sequences
did not contain the relevant diagnostic characters.
On the other hand, query sequences could be assigned
to the wrong species if a phenetic approach based on a
BLAST search was employed in the absence of a complete
baseline sample, such as the one available on GenBank
prior to this study. For example, there were no leatherback COI sequences posted on GenBank, and a query on
a leatherback sequence grouped it most closely with a
hawksbill turtle. In the same vein, the remaining three
species that did not have COI sequences posted on
GenBank—the flatback, loggerhead and Kemp’s ridley
turtles—could be misidentified as green, hawksbill and
olive ridley turtles, respectively; the species they were
most similar to in COI BLAST searches.
Even so, these ancient marine turtle lineages did lend
themselves well to distance- and tree-based barcoding
approaches in some ways. There was no overlap between
mean inter- and intraspecific distances, which many
times introduces error into distance-based assignment of
query barcode sequences (Meyer & Paulay 2005;
Wiemers & Fiedler 2007; Rach et al. 2008). Most of the
mean interspecific divergences were relatively high
(range: 1.68–13.0%; Table 3), falling well above the
typically used 2–3% threshold between inter- and intraspecific divergence (Hebert et al. 2003b; but see Moritz &
Cicero 2004). The single exception was the lower level of
divergence among the more recently speciated Kemp’s
and olive ridley turtles. Even so, due to low intraspecific
variation within this genus, all of the turtles tested were
accurately assigned to species using COI barcode trees.
Mean intraspecific variation fell below 1% in all cases,
fitting in well with the 2–3% threshold, and ranging from
leatherback and olive ridley haplotypes that were identical across ocean basins, to more variable hawksbill turtle
sequences (0–0.90%; Table 3).
Control region analysis
We considered the utility of mtDNA control region
sequences for DNA barcoding purposes; given their
extensive use in sea turtle genetic studies (see Bowen &
Karl 2007, for a review). The data are in many cases
readily accessible: standardized mtDNA control region
sequences are publicly available on GenBank and on
other websites. Control region sequences have also been
used for wildlife forensic purposes (Encalada et al.
1994).
We found that, although mtDNA control region
sequences are of demonstrated utility for various conservation genetics objectives, they do not meet all DNA barcoding purposes as appropriately as COI sequences. At
the more variable control region, pure or private diagnostic characters meeting a suggested reliability criterion of
at least 80% frequency (Rach et al. 2008) were not found
for several species. Even so, all species did group
with their conspecifics in distance-based tree-building
approaches. Inter- and intraspecific divergence levels
were generally higher for the control region than for COI.
In some cases, such as green turtles, mean intraspecific
divergence levels close to 5% precluded establishing a
2–3% threshold demarcating inter- and intraspecific
divergence. Also, one of the main benefits of COI barcoding is comparability to a wide range of taxa also being
barcoded at this marker, which is not the case with the
control region. Further, sampling was uneven as some
species are vastly better represented than others on GenBank, an issue that may be considered in the context of
developing statistical approaches, despite their computational intensiveness and ⁄ or inherent assumptions about
the evolutionary process.
Cryptic species
The analysis provided no convincing evidence of new
species units in most of the taxa examined. Leatherback
and olive ridley turtle haplotypes were each identical
across ocean basins, with no suggestion of hidden species
units. These findings are consistent with previous work
revealing shallow divergences between ocean basins in
these species, likely due to recent colonization and population expansion (Bowen et al. 1998; Dutton et al. 1999). In
fact, with the exception of Eastern Pacific green turtles
(Kamezaki & Matsui 1995; Parham & Zug 1996; Karl &
Bowen 1999) and the two species within the genus
Lepidochelys (Bowen et al. 1991), there has been little
recent debate over subspecific status in marine turtles.
This study revealed that the COI sequence from green
turtles of the Eastern Pacific was identical to a Pacific
haplotype sampled in Australia, providing no evidence
for species-level designation of Eastern Pacific green
turtles based on this marker, and supporting conclusions
of previous research (Bowen et al.1993; Dutton et al. 1996;
Karl & Bowen 1999; Naro-Maciel & Le et al. 2008). And,
as noted above, each ridley species was characterized by
Ó 2009 Blackwell Publishing Ltd
D N A B A R C O D I N G 261
a single haplotype, and no haplotypes were shared
among these taxa that are diagnosed by various CAs.
However, the study did uncover diagnostic characters
specific to ocean basins within green and hawksbill
turtles. These are both species in which there is a strong
propensity for female natal homing, which differentiates
populations at mitochondrial loci within ocean basins
(Bass et al. 1996; Encalada et al. 1996; Dethmers et al.
2006; Formia et al. 2006; Velez-Zuazo et al. 2008). Deep
divergence
between
Atlantic-Mediterranean
and
Indo-Pacific groups has been consistently reported in the
literature for green turtles (Bowen et al. 1992; Encalada
et al. 1996; Naro-Maciel & Le et al. 2008). Furthermore,
these are tropical species whose dispersal across ocean
basins tends to be limited by cold waters along the southern tips of continents. However, recent gene flow is
known to have occurred between the Atlantic and Indian
Oceans in green turtles (see Bourjea et al. 2006). We predict that increased sampling is likely to reveal other
shared haplotypes between Atlantic and Indian Ocean
populations, and that gene flow among these divergent
lineages may be increased by changes to sea temperature,
currents and sea levels, due to climate change. Thus
although the COI diagnostics could serve as a flag for
additional taxonomic investigation (Rach et al. 2008), the
notion of cryptic species, or subspecies categories, does
not appear warranted in marine turtles.
Population structure and history
Although COI analysis did not suggest to us that current
species designations needed to be seriously challenged, it
did indicate that barcoding could be useful for other
conservation genetics purposes. For example, hawksbill,
loggerhead and green turtles had haplotypes endemic to
each ocean basin that could potentially be used to assign
their origins. Additional sampling in the Indian Ocean
and other areas would be of special interest in confirming
the utility of COI to assign ocean basin origins in these
groups.
Analysis of COI sequences revealed a north–south
gradient in sequences from green turtles of Western
Atlantic ⁄ Mediterranean nesting areas. Turtles from most
northern nesting sites were characterized by one
haplotype, while those from southern or near equatorial
nesting sites were fixed for a second haplotype (Fig. 3). A
mixture of both haplotypes was found at Aves Island,
Venezuela, a centrally located rookery, and the ‘southern’
haplotype was fixed in the eastern colony of Guinea
Bissau. These two haplotypes differed from each other by
a single base pair (Fig. 3). These data are consistent with
the hypothesis that turtles clustered in near equatorial
regions during the most recent ice-age, and dispersed
from these glacial refugia once the climate warmed about
Ó 2009 Blackwell Publishing Ltd
10 000–18 000 years ago (Encalada et al. 1996). Rather
than revealing an east–west clustering of rookeries (Encalada et al. 1996), however, the COI data suggest more of a
north–south dispersal scenario.
In conclusion, the establishment of marine turtle COI
barcodes may contribute to the global DNA barcoding
effort to document and catalogue the diversity of life,
particularly with regard to conservation applications.
They have demonstrated utility for species identification
and may additionally be useful for finer-scale assignment
in some cases. Marine turtle DNA barcodes contribute to
genomics science by increasing knowledge of COI across
taxa. Through the Barcode of Life database (http://
www.barcodinglife.org/views/login.php) and posting
on GenBank, the results have been made readily available to researchers, conservation practitioners and other
users. The barcodes can also be applied directly to the
conservation of these globally endangered species when
used to identify incidental sea turtle bycatch and illegally
obtained or traded wildlife. Further, the barcodes
enhance taxonomic understanding, which is central to
developing appropriate conservation strategies (DeSalle
& Amato 2004), and provide insight into population
structure and history of this unique and highly threatened group.
Acknowledgements
We thank the Projeto TAMAR, the Riverhead Foundation, the
Wildlife Conservation Society, Brian Bowen, Omar ChassinNoria, Carlos Diez, Peter Dutton, Angela Formia, Stephen Karl,
Robin Leroux, Manjula Tiwari and Ximena Velez-Zuazo for
samples. We thank Meredith Martin, Sergios-Orestis Kolokotronis and Eleanor Sterling for assistance, as well as two anonymous reviewers. We also wish to thank the Regina Bauer
Frankenberg Foundation for Animal Welfare, the Royal
Caribbean Ocean Fund, the Alfred P. Sloan Foundation and the
Richard Lounsbery Foundation for supporting this study.
References
Abdo Z, Golding GB (2007) A step toward barcoding life: a
model-based, decision-theoretic method to assign genes to
preexisting species groups. Systematic Biology, 56, 44–56.
Altschul SF, Gish W, Miller W, Myers EW, Lipman DJ (1990)
Basic local alignment search tool. Journal of Molecular Biology,
215, 403–410.
Avise JC, Bowen BW, Lamb T, Meylan AB, Bermingham E
(1992) Mitochondrial DNA evolution at a turtle¢s pace: evidence for low genetic variability and reduced microevolutionary rate in the testudines. Molecular Biology and Evolution, 9,
457–473.
Bass AL, Good DA, Bjorndal KA et al. (1996) Testing models of
female reproductive migratory behaviour and population
structure in the Caribbean hawksbill turtle, Eretmochelys imbricata, with mtDNA sequences. Molecular Ecology, 5, 321–328.
262 D N A B A R C O D I N G
Bjorndal KA, Jackson JBC (2003) Roles of sea turtles in marine
ecosystems: reconstructing the past. In: The Biology of Sea
Turtles Volume II (eds Lutz PL, Musick JA, Wyneken J), pp.
259–274. CRC Press, Boca Raton, FL.
Bourjea J, Lape`gue S, Gagnevin L et al. (2006) Phylogeography of
the green turtle, Chelonia mydas, in the Southwest Indian
Ocean. Molecular Ecology, 16, 175–186.
Bowen BW, Karl SA (2007) Population genetics and phylogeography of sea turtles. Molecular Ecology, 16, 4886–4907.
Bowen BW, Meylan AB, Avise JC (1991) Evolutionary distinctiveness of the endangered Kemp’s ridley sea turtle. Nature,
352, 709–711.
Bowen BW, Meylan AB, Ross JP, Limpus CJ, Balazs GH, Avise
JC (1992) Global population structure and natural history of
the green turtle (Chelonia mydas) in terms of matriarchal
phlyogeography. Evolution, 46, 865–881.
Bowen BW, Nelson WS, Avise JC (1993) A molecular phylogeny
for marine turtles: trait mapping, rate assessment, and conservation relevance. Proceedings of the National Academy of Sciences,
USA, 90, 5574–5577.
Bowen BW, Clark AM, Abreu-Grobois FA, Chaves A, Reichart
HA, Ferl RJ (1998) Global phylogeography of the ridley sea
turtles (Lepidochelys spp.) as indicated by mitochondrial DNA
sequences. Genetica, 101, 179–189.
Bowen BW, Grant WS, Hillis-Starr Z et al. (2007) Mixed-stock
analysis reveals the migrations of juvenile hawksbill turtles
(Eretmochelys imbricata) in the Caribbean Sea. Molecular Ecology,
16, 49–60.
Carr AF (1967) So Excellent a Fishe: A Natural History of Sea
Turtles. Scribner, New York.
Clement M, Posada D, Crandall KA (2000) TCS: a computer
program to estimate gene genealogies. Molecular Ecology, 9,
1657–1660.
Conceic¸a˜o MB, Levy JA, Marins LF, Marcovaldi MA (1990) Electrophoretic characterization of a hybrid between Eretmochelys
imbricata and Caretta caretta (Cheloniidae). Comparative
Biochemistry and Physiology, B97, 275–278.
DeSalle R (2006) Species discovery versus species identification
in DNA barcoding efforts: response to Rubinoff. Conservation
Biology, 20, 1545–1547.
DeSalle R, Amato G (2004) The expansion of conservation genetics. Nature Reviews Genetics, 5, 702–712.
DeSalle R, Egan MG, Siddall M (2005) The unholy trinity: taxonomy, species delimitation and DNA barcoding. Philosophical
Transactions of the Royal Society of London. Series B: Biological Sciences, 360, 1905–1916.
Dethmers KEM, Broderick D, Moritz C et al. (2006) The genetic
structure of Australasian green turtles (Chelonia mydas):
exploring the geographical scale of genetic exchange. Molecular Ecology, 15, 3931–3946.
Dutton PH, Davis SK, Guerra T, Owens D (1996) Molecular
phylogeny for marine turtles based on sequences of the ND4leucine tRNA and control regions of mitochondrial DNA.
Molecular Phylogenetics and Evolution, 5, 511–521.
Dutton PH, Bowen BW, Owens DW, Barragan A, Davis SK
(1999) Phylogeography of the leatherback turtle (Dermochelys
coriacea). Journal of the Zoological Society of London, 248, 397–409.
Encalada SE, Eckert SA, Bowen BW (1994) Forensic applications
of mitochondrial DNA markers: origin of a confiscated green
turtle. Marine Turtle Newsletter, 66, 1–3.
Encalada SE, Lahanas PN, Bjorndal KA, Bolten AB, Miyamoto
MM, Bowen BW (1996) Phylogeography and population structure of the Atlantic and Mediterranean green turtle Chelonia
mydas: a mitochondrial DNA control region sequence assessment. Molecular Ecology, 5, 473–483.
Encalada SE, Bjorndal KA, Bolten AB et al. (1998) Population
structure of loggerhead turtle (Caretta caretta) nesting colonies
in the Atlantic and Mediterranean as inferred from mitochondrial DNA control region sequences. Marine Biology, 130, 567–
575.
Excoffier L, Laval G, Schneider S (2005) ARLEQUIN version. 3.0: an
integrated software package for population genetics data analysis. Evolutionary Bioinformatics Online, 1, 47–50.
Felsenstein J (2007) PHYLIP (Phylogeny Inference Package) Version
3.67. Distributed by the author. Department of Genome
Sciences, University of Washington, Seattle.
FitzSimmons NN, Moritz C, Moore SS (1995) Conservation and
dynamics of microsatellite loci over 300 million years of
marine turtle evolution. Molecular Biology and Evolution, 12,
432–440.
Formia A, Godley BJ, Dontaine J-F, Bruford MW (2006) Mitochondrial DNA diversity and phylogeography of endangered
green turtle (Chelonia mydas) populations in Africa. Conservation Genetics, 7, 353–369.
Goldstein PZ, DeSalle R, Amato G, Vogler AP (2000) Conservation genetics at the species boundary. Conservation Biology, 14,
120–131.
Hebert PDN, Gregory TR (2005) The promise of DNA barcoding
for taxonomy. Systematic Biology, 54, 852–859.
Hebert PDN, Cywinska A, Ball SL, deWaard JR (2003a) Biological identifications through DNA barcodes. Proceedings of the
Royal Society of London. Series B: Biological Sciences, 270, 313–
321.
Hebert PD, Ratnasingham S, deWaard JR (2003b) Barcoding animal life: cytochrome c oxidase subunit 1 divergences among
closely related species. Proceedings of the Royal Society of
London. Series B: Biological Sciences, 270(Suppl. 1), S96–S99.
Hebert PDN, Penton EH, Burns J, Janzen DJ, Hallwachs W
(2004a) Ten species in one: DNA barcoding reveals cryptic
species in the neotropical skipper butterfly, Astraptes fulgerator.
Proceedings of the National Academy of Sciences, USA, 101,
14812–14817.
Hebert PDN, Stoeckle MY, Zemlak TS, Francis CM (2004b) Identification of birds through DNA barcodes. Public Library of Science, Biology, 2, 1657–1663.
Hirayama R (1998) Oldest known sea turtle. Nature, 392, 705–
708.
Hirth HF (1997) Synopsis of the Biological Data on the Green Turtle
Chelonia mydas (Linnaeus 1758). United States Fish and Wildlife Service, Washington, DC.
IUCN (2008) 2008 Red List of Threatened Species. Available from
(accessed 21 January 2009).
Janzen DH, Hajibabaei M, Burns JM, Hallwachs W, Remigio E,
Hebert PDN (2005) Wedding biodiversity inventory of a large
and complex Lepidoptera fauna with DNA barcoding. Philosophical Transactions of the Royal Society of London. Series B: Biological
Sciences, 360, 1835–1845.
Kamezaki N, Matsui M (1995) Geographic variation in skull
morphology of the green turtle, Chelonia mydas, with a taxonomic discussion. Journal of Herpetology, 29, 51–60.
Ó 2009 Blackwell Publishing Ltd
D N A B A R C O D I N G 263
Karl SA, Bowen BW (1995) Hybridization among the ancient
mariners: characterization of marine turtle hybrids with
molecular genetic assays. Journal of Heredity, 86, 262–268.
Karl SA, Bowen BW (1999) Evolutionary significant units versus
geopolitical taxonomy: molecular systematics of an endangered sea turtle (genus Chelonia). Conservation Biology, 13,
990–999.
Koski LB, Golding GB (2001) The closest BLAST hit is often not the
nearest neighbor. Journal of Molecular Evolution, 52, 540–542.
Lara-Ruiz P, Lopez GG, Santos FR, Soares LS (2006) Extensive
hybridization in hawksbill turtles (Eretmochelys imbricata) nesting in Brazil revealed by mtDNA analyses. Conservation Genetics, 7, 773–781.
Maddison DR, Maddison WP (2002) MacClade: Analysis of phylogeny and character evolution. Sinauer Associates, Sunderland,
MA.
Meyer CP, Paulay G (2005) DNA barcoding: error rates based on
comprehensive sampling. Public Library of Science, Biology, 3,
e422.
Moritz C, Cicero C (2004) DNA barcoding: promise and pitfalls.
Public Library of Science, Biology, 2, e354.
Musick JA, Limpus CJ (1996) Habitat utilization and migration
in juvenile sea turtles. In: The Biology of Sea Turtles Volume II
(eds Lutz PL, Musick JA, Wyneken J), pp. 137–163. CRC Press,
Boca Raton, FL.
Naro-Maciel E, Le M, FitzSimmons NN, Amato G (2008) Evolutionary relationships of marine turtles: a molecular phylogeny
based on nuclear and mitochondrial genes. Molecular Phylogenetics and Evolution, 49, 659–662.
Nei M (1987) Molecular Evolutionary Genetics. Columbia University Press, New York.
Nielsen R, Matz M (2006) Statistical approaches for DNA barcoding. Systematic Biology, 55, 162–169.
Parham JF, Zug GR (1996) Chelonia agassizii—valid or not? Marine Turtle Newsletter, 72, 2–5.
Pritchard PCH (1996) Evolution, phylogeny and current status.
In: The Biology of Sea Turtles Volume II (eds Lutz PL, Musick JA,
Wyneken J), pp. 1–28. CRC Press, Boca Raton, FL.
Rach J, DeSalle R, Sarkar IN, Schierwater B, Hadrys H (2008)
Character-based DNA barcoding allows discrimination of genera, species and populations in Odonata. Proceedings of the
Royal Society of London. Series B: Biological Sciences, 275, 237–247.
Ratnasingham S, Hebert PDN (2007) BOLD: the barcode of life
data system. Molecular Ecology Notes, 7, 355–364.
Sambrook J, Russell DW (2001) Molecular Cloning: A Laboratory
Manual, 3rd edn. Cold Spring Harbor Laboratory Press, Cold
Spring Harbor, NY.
Ó 2009 Blackwell Publishing Ltd
Sarkar IN, Planet PJ, Bael TE et al. (2002a) Characteristic attributes in cancer microarrays. Journal of Biomedical Informatics,
35, 111–122.
Sarkar IN, Thornton JW, Planet PJ, Figurski DH, Schierwater B,
DeSalle R (2002b) An automated phylogenetic key for classifying homeoboxes. Molecular Phylogenetics and Evolution, 24, 388–
399.
Savolainen V, Cowan RS, Vogler AP, Roderick GK, Lane R
(2005) Towards writing the encyclopaedia of life: an introduction to DNA barcoding. Philosophical Transactions of the Royal
Society of London. Series B: Biological Sciences, 360, 1805–1811.
Seminoff JA, Karl SA, Schwartz T, Resendiz A (2003) Hybridization of the green turtle (Chelonia mydas) and hawksbill turtle
(Eretmochelys imbricata) in the Pacific Ocean: indication of an
absence of gender bias in the directionality of crosses. Bulletin
of Marine Science, 73, 643–652.
Shanker K, Ramadevi J, Choudhury BC, Singh L, Aggarwal RK
(2004) Phylogeography of olive ridley turtles (Lepidochelys olivacea) on the east coast of India: implications for conservation
theory. Molecular Ecology, 13, 1899–1909.
Smith MA, Fisher BL, Hebert PDN (2005) Barcoding for effective
biodiversity assessment of a hyperdiverse arthropod group:
the ants of Madagascar. Philosophical Transactions of the Royal
Society of London. Series B: Biological Sciences, 360, 1825–1834.
Steinke D, Vences M, Salzburger W, Meyer A (2005) TaxI—a software for DNA barcoding using distance methods.
Philosophical Transactions of the Royal Society of London. Series
B: Biological Sciences, 360, 1975–1980.
Stuart BL, Parham JF (2004) Molecular phylogeny of the critically
endangered Indochinese box turtle Cuora galbinifrons. Molecular Phylogenetics and Evolution, 31, 164–177.
Tamura K, Nei M, Kumar S (2004) Prospects for inferring very
large phylogenies by using the neighbor-joining method. Proceedings of the National Academy of Sciences, USA, 101, 11030–
11035.
Tamura K, Dudley J, Nei M, Kumar S (2007) MEGA4: molecular
evolutionary genetics analysis (MEGA) software version 4.0.
Molecular Biology and Evolution, 24, 1596–1599.
Velez-Zuazo X, Ramos WD, Van Dam RP, Diez CE, AbreuGrobois A, Mcmillan WO (2008) Dispersal, recruitment and
migratory behaviour in a hawksbill sea turtle aggregation.
Molecular Ecology, 17, 839–853.
Wiemers M, Fiedler K (2007) Does the DNA barcoding gap exist?
A case study in blue butterflies (Lepidoptera: Lycaenidae).
Frontiers in Zoology, 4, 8.