DSpace at VNU: Simulation Research on Hollow Cavities in the Body of Dikes and Dams by Geophysical Methods
Bạn đang xem bản rút gọn của tài liệu. Xem và tải ngay bản đầy đủ của tài liệu tại đây (1.68 MB, 13 trang )
VNU Journal of Mathematics – Physics, Vol. 29, No. 3 (2013) 1-13
Simulation Research on Hollow Cavities
in the Body of Dikes and Dams by Geophysical Methods
Vu Duc Minh1,*, Do Anh Chung2
1
VNU University of Science, 334 Nguyen Trai, Thanh Xuan, Hanoi, Vietnam
Institute for Ecology and Works Protection, Vietnam Academy for Water Resources
2
Received 14 June 2013
Revised 20 June 2013; Accepted 05 July 2013
Abstract: This paper presents the results of simulation study of hollow caves in the body of dikes,
dams through theoretical modeling and calculation based on the knowledge of Mathematics,
Informatics, Physics in general and Geophysics in particular and also the information processed by
the software of EarthImage 2D and Reflex 2D on the methods of multi-electrode electrical
sounding and ground penetrating radar. From there, it is possible to draw conclusions on the
applicability of both methods for finding, identifying hollow cave, and also looking at ways to
conduct field work appropriate to improve the efficiency of the methods mentioned above. These
results will be applied as the basis for the discovery of the hollow cave of dikes and dams in
Vietnam.
Keywords: Simulation, hazard, hollow cave, dike, dam.
1. Rationale*
Hollow cave in the body of dikes, dams is causing subsidence hazards leading to the risk of broken
dikes and dams. There are many reasons for this generation of hollow caves such as earth for dam
embankment is not handled carefully initially leading after the prolonged time to uneven subsidence,
living organisms for their nest in body of dams, culverts or other underground works from the past
which are not used and forgotten, etc. We can only discover and estimate those hollow caves
expressed on the surface or by water seepage from inside to outside and vice versa, then the safety of
the dike, dam is threatened.
The regular inspection and monitoring to ensure the safety of dikes, dams system is a mandatory
requirement, particularly through the survey results by the scientific methods, including the methods
of geophysics. In order to well-do that, it should be studied in order to have preliminary information
on relative precision based on scientific basis for the selection and application of conducting search
_______
*
Corresponding author. Tel.: 84-914658586
Email:
1
2
V. D. Minh, D.A. Chung. / VNU Journal of Mathematics-Physics, Vol. 29, No. 3 (2013) 1-13
methods, determining the hollow caves to increase their efficiency (faster, less expensive, able to
identify the type, location and size of the hollow cave itself in body of dikes, dams). One of the issues
that need to be set is to make simulation studies of hollow cave using geophysical methods as the basis
for the discovery of the hollow cave of dikes and dams in Vietnam.
In this paper we present some new results obtained by simulation study of the hollow cave by
multi-electrode electrical sounding method (MES) [1-3] or improved multi-electrode electrical
sounding method (IMES) [4] (both are called MES method) and ground penetrating radar (GPR) [3, 5],
and assess the ability and effectiveness of the methods in detecting objects.
2. Theoretical basic
2.1. Method of Multi-electrode electrical sounding
Theory of single-line electricity wire is a part of theory of electrodynamics, basic equations of
physics problems about the relationship between the current density distribution in the environment
due to the development of direct current electrical power with capacity of I on the environment with
the conductivity of the environment. It is described by the following basic equation:
− div[σ ( x, y, z ) gradU ( x, y, z )] = Iδ ( x − xs )δ ( y − y s )δ ( z − z s )
Among them: div, grad - the operators;
σ - function describing the distribution of electrical conductivity in the environment according to
the coordinates x, y, z (the actual parameters used for resistivity ρ = 1/σ measured in Ωm);
U - voltage function describing the voltage distribution in the environment according to the
coordinates x, y, z;
I - current intensity development on the environment;
δ - is the Dirac function characterizing the distribution of power environment coordinates xs, ys,
zs;
Equation for the two-dimensional distribution (2D) can be solved by two main methods which are
methods of integral equations and differential equations. However, up till now widely used and most
effective method is finite difference one. With constant current, the equation is written as:
− ∇.[σ ( x, y , z )∇φ ( x, y, z )] = 0
Among them:
φ(x,y,z) - a function that satisfies the conditions of continuous functions with conductivity σ(x,y,z),
constant current density J and Neumann, Dirichlet boundary conditions;
(xs, ys, zs) are the coordinates of the source located in space (x, y, z).
To facilitate the calculation, one solves equations in one variable Fourie space by converting space
index (y) into the frequency domain Ky by transformation forward and reverse Fourie equation we
have:
V. D. Minh, D.A. Chung. / VNU Journal of Mathematics-Physics, Vol. 29, No. 3 (2013) 1-13
[
]
3
2
− ∇. σ ( x, , z )∇φ ( x, K y , z ) + K y σ ( x, y )φ ( x, K y , z ) = Qδ ( xs )δ ( ys )
General form of the above equation can be expressed as differential self-adjoint, strongly
connected and nonseparable elliptic equation:
−
∂
∂φ
∂
∂φ
( Px, y ) ( x, K y , z )) − ( P( x, z )
( x, K y , z ) + σ ( x, z )φ ( x, K y , z ) = f ( x, z )
∂x
∂x
∂z
∂z
(x,z) defined in the domain R - contained, fully and continuously enclosed by boundary Γ
continuous with normal vectors outside; function P and the function f is continuous function in the
domain by R.
To determine the lower boundary of the half-infinite space with any conductivity distribution, R is
set by the domain boundaries instead of assuming away the infinite horizontal (x-axis) and vertical (zaxis). Not limited to the bottom half of this is represented as a discrete grid.
Grid was selected as the rectangle with the edges of any size. The x -axis grid nodes are denoted
by i = 1,2,3,..., N and the z axis grid nodes are denoted by j = 1,2,3,..., M. Left side and the right edge
of the road network is denoted by i = 1 and i = N. Bottom edges of the mesh are denoted by j = M. The
primary source of cause, as well as the secondary due to the heterogeneity induced conductivity in the
lower half space is inversely proportional to the distance (x, y, z) and K0(Ky.r) in transformation space
(here K0 is the modified Bessel function and r is the distance). Thus, by choosing large enough values
for M and N with appropriate discrete grid (i→ 1 and i→N, and j→ M) and applying the appropriate
boundary conditions, the boundary edge can be modeled infinite interview by choosing the limited
number of M and N. From any node (i, j) which is the characteristic equation developed will be
approximately in a region corresponding to an area of ∆Ai,j.
As such, always amperage determined; voltage value U is determined by field measurement
devices. As the conductivity distribution function of the environment is what we need to know σ can
be determined by solving the above equation.
In the example results obtained by simulation studies of the hollow cave by MES method
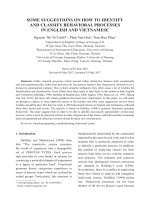
presented in Section 3 below, we use the Wenner- Schlumberger array (Figure 1). Coefficient devices:
K = πan, with n = 1, 2, 3,..., N. The first measure point, the first measurements with n = 1 (C1P1 =
P1P2 = P2C2 = a), the second period with n = 2 (P1P2 = a; C1P1 = P2C2 = 2a); Tuesday
measurements with n = 3 (P1P2 = a; C1P1 = P2C2 = 3a),..., nth measurements with n = N (P1P2 = a;
C1P1 = P2C2 = na).
Then we only measured the first translation of a walk in a measure the second point. Measurement
process is repeated until the end of the measuring line. If the value obtained in the expansion C1C2
P1P2 small, we can expand P1P2 = 2a.
C1
na
P1
a
P2
na
C2
Fig 1. Wenner- Schlumbeger array.
4
V. D. Minh, D.A. Chung. / VNU Journal of Mathematics-Physics, Vol. 29, No. 3 (2013) 1-13
2.2. Method of ground penetrating radar
GPR method is agricultural geophysical method based on the principle of electromagnetic wave
transceiver at ultrasonic frequencies (from 15 ÷ 2400 MHz). When the electromagnetic wave
propagating in the beams emitted from the transmitter and receiver antennas are created from
reflective objects are the boundaries of the geological environment.
The depth of penetration of the method depends on transmitting and receiver antenna frequency
and the physical properties of the geological environment in which the value of relative dielectric
constant and relatively high power authority (εr) and electrical conductivity (σ) are dominant. The
higher the frequency, the conductivity and dielectric constant greater the smaller the depth of the
survey.
The physical quantities characteristic of electromagnetic waves are used in GPR method are: wave
propagation velocity (v), wavelength (λ), reduction coefficient (α), evaluation of the relative power
(εr), magnetic permeability (µ), electrical conductivity (σ)...
The reason GPR method can detect objects above is that in the geological environment in general
there always exists the potential dangers such as karst caves, heterogeneous blocks, tropical caves and
hollow porous, these are the areas with different physical properties than the surrounding geological
environment. At the boundary between the potential dangers and the surrounding environment
electromagnetic wave reflection occurs, the reflection coefficient is calculated using the formula:
R=
ε1 − ε 2
ε 1 + ε 2 with: ε - the relative dielectric constant of the first medium and ε 1
2
relative dielectric constant of the second medium.
Geological environment is considered as a mixture of three components, namely: earth, water and
air. Depending on water levels and air entrapment in the porous layer of the geological environment
which more or less affect the electrical conductivity of the medium. Electrical conductivity of a
geological environment is difficult to be determined accurately. It depends on the conductivity of the
water contained in the pores of the earth. It also depends on the characteristics of components, the
architecture, the structure of the earth environment.
Archie's law describes this relationship as follows:
σ = a. Φm. Sn .σw.σc
with: Φ - porosity of the earth environment (%) S - water saturation, m - empirical constant value
from 1.3 to 2.5, a - empirical constant value from 0.4 to 2.0; n - constant with a value of 2; σw - the
water in the hole; σc - surface conductivity of the earth particle surface geology.
The determination of the electromagnetic parameters to standardize the results measured in GPR
method will increase the accuracy of data processing. The parameters needed to be determined are the
dielectric constant ε, conductivity σ, the wave velocity and attenuation α.
* Dielectric constant ε
Dielectric constant is a scalar, it indicates the ability of positively charged earth environment when
an electromagnetic wave field propagates through. Dielectric constant depends mainly on the amount
V. D. Minh, D.A. Chung. / VNU Journal of Mathematics-Physics, Vol. 29, No. 3 (2013) 1-13
5
of water contained in the geological environment and it takes the value from 1 to 81. The formula for
calculating ε in the earth environment and unsaturated sediments is as follows [6]:
ε = Φ ( 1 − S ) ε a + Φ . S . ε w + (1 − Φ ) ε s
with: Φ - porosity of the earth environment (%); S - water saturation, ε - dielectric constant of
rocks; εa - dielectric constant of air; εw - dielectric constant of water; εs - dielectric constant of particle
composition.
* Electrical conductivity σ
Electrical conductivity is the ability of specific electrical conductivity of the physical environment,
it is inversely proportional to the resistivity ρ and depends mainly on the amount of water and clay
content in the environment. With most earths, electrical conductivity usually get value from 4 to 10-9
S/m. The formula for the electrical conductivity of the not saturated geological environment is as
follows:
σ = Φ (1 − S ) σ
a
+ Φ .S . σ
w
+ (1 − Φ ) σ
s
with: Φ - porosity of the earth environment (%); S - water saturation, σ - conductivity of the
sediments; σa - conductivity of air; σw - electrical conductivity of the water; σs - conductivity of particle
composition.
* Electromagnetic wave propagation velocity v
Electromagnetic wave propagation velocity depends mainly on the value of the dielectric constant
of the wave medium and calculated by the following formula:
v=
c
ε
=
3.10 8
ε
(m / s)
* Attenuation of electromagnetic waves α
Attenuation of electromagnetic wave is proportional to the quantity of medium conductivity and
inversely proportional to the wave and dielectric constant of the medium. Attenuation of
electromagnetic waves is calculated by the formula:
α = 1 .69
σ
( dB / m )
ε
There are many methods of determining the electromagnetic parameters: geometrical ratio method;
common method of deep...
GPR method is based on studies of electromagnetic wave propagation in the ground, especially the
reflected waves generated from the surface of the object boundary in the geological environment. With
the hazards in the dike, dam can be divided into two basic object types: point format (termite nests,
hollow caves, tropical porous, heterogeneous blocks...) and the boundary layer (saturated absorption
line, the boundary layer...).
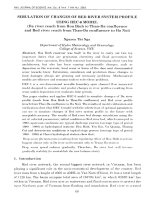
With model, hollow cave is considered as one of the object. When moving the antenna to any
position on the survey line, where the line of sight between the transmitting antenna and the object
form an angle of approximately 450 located in areas with waves reflected from the object, the object to
6
V. D. Minh, D.A. Chung. / VNU Journal of Mathematics-Physics, Vol. 29, No. 3 (2013) 1-13
be probed will be detected. The object's reflectance probe at a point corresponding to a certain time tz
(tz - the time that the wave propagation from the antenna to the object). When the antenna closer to the
object than the time that the waves propagate from the transmitting antenna to the object and
decreasing the time of the wave at the top position of the object is the smallest. Thus the reflected
wave signal obtained from the object has the Hyperbole form. Radar waves on schema objects are
represented in Figure 2.
Object
Reactive surface
As the object of reflection points
as Hyperbola.
Surface boundary
Boundary eye
Fig 2. Radar wave diagram on objects.
Based on the above theory, we have calculated and presented some findings in theoretical hollow
cave models obtained by GPR method in Section 3 below.
3. Some calculation results
3.1. Simulation of the hollow cave by multi-electrode electrical sounding method
Study of physics and geology of dikes and dams reveals that earth resistivity of dikes, dams have
greatly fluctuated. The dikes in the Red River Delta with resistivity of 14-40Ωm, the dam resistance
from 70-300Ωm.
Hollow cave in body of dikes, dams in practice often have very large resistivity, very small width
of several tens of centimeters to several meters, the depth does not look great from the dikes and dams
to 3 - 4m depth compared to surface dikes and dams.
3.1.1. The model of a hollow cave
From the practic, we choose to conduct calculations and theoretical models in which hollow cave
is one-size objects located in a radius of 1m various depths 1m, 2m, 3m and 4m. In the process of
calculation we impose environmental noise of 0% (considered as absolute environment) and of 3%
(considered as real environment).
7
V. D. Minh, D.A. Chung. / VNU Journal of Mathematics-Physics, Vol. 29, No. 3 (2013) 1-13
Here is an example of the results calculated for the theoretical hollow cave model above with
absolute environment and noisy environments.
Results calculated on a theoretical hollow cave model with a depth of objects from the size of the
object to 4 times the depth of objects in the environment without interference standards (Figures 3, 5,
7, 9) show that anomalies of hollow cave are always identified. However, when calculating with the
environmental assumptions of the actual noise of 3% (Figures 4, 6, 8, 10) with depth is 2 times of the
object, the anomaly of the objects is still visible, while increasing depth of 3 times of the object, there
is abnormal expression but anomalies were difficult to be identified. As the depth increased to 4 times
the size of the object, there is no abnormal expression.
The location of anomalies compared to the position of the object in the theoretical model is
completely accurate, but the size of anomaly is much larger than that of the model object even in case
where there is no noise environment. So for the small hollow cave object it is very difficult to use
MES method to assess their size.
a
a
b
b
c
c
Fig 3. The results of theoretical model with noise
environment of 0% and object in depth 1m
a: Measurement results: b: Results processing
c: Model.
Fig 4. The results of theoretical model with noise
environment of 3% and object in depth 1m
a: Measurement results: b: Results processing
c: Model.
a
a
b
b
c
c
Fig 5. The results of theoretical model with noise
environment of 0% and object in depth 2m
a: Measurement results: b: Results processing
c: Model.
Fig 6. The results of theoretical model with noise
environment of 3% and object in depth 2m
a: Measurement results: b: Results processing
c: Model.
8
V. D. Minh, D.A. Chung. / VNU Journal of Mathematics-Physics, Vol. 29, No. 3 (2013) 1-13
a
a
b
b
c
c
Fig 7. The results of theoretical model with 0% noise
environment and object in depth 3m
a: Measurement results: b: Results processing
c: Model.
Fig 8. The results of theoretical model with noise
environment of 3% and object in depth 3m
a: Measurement results: b: Results processing
c: Model.
a
a
b
b
c
c
Fig 9. The results of theoretical models with 0% noise
environment and object in depth 4m
a: Measurement results: b: Results processing
c: Model.
Fig 10. The results of theoretical models with noise
environment of 3% and object in depth 4m
a: Measurement results: b: Results processing
c: Model.
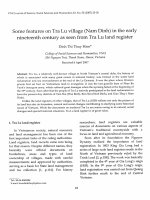
3.1.2. The many hollow caves model
The model has many hollow caves with the same size located at different depths
In order to study and evaluate the mutual influence of multiple objects with the same size but
located at different depths in the same environment, we chose to conduct calculations using the
theoretical model with 5 hollow caves in the same size 1m and located at a depth respectively from left
to right is 1.5 m, 2m, 1m, 4m, and 3m on the 1 measurement line (Figure 11c).
The results of theoretical model with noise environment of 3% with 5 objects the same size (1m)
but located in different depths are shown in Figure 11.
V. D. Minh, D.A. Chung. / VNU Journal of Mathematics-Physics, Vol. 29, No. 3 (2013) 1-13
9
a
b
c
Fig 11. The results of theoretical model with noise environment of 3%
There are 5 different objects the same size (1m) but located in different depths.
Looking at the results we see when there are objects they interact and influence each other, so the
object located at a depth of 1m and 1.5m show obvious anomalies, while the objects located in the
greater depths exhibit no abnormal expression.
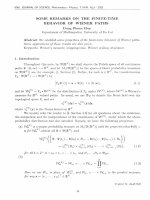
The model has many hollow caves with different size located at different depths
We chose to conduct calculations using the theoretical model with 5 hollow caves in size
respectively from left to right is 1m, 1.5m, 1m, 2.5m and 2m respectively located at a depth of 1,5m,
2m, 1m, 4m and 3m above the 1 measurement line (Figure 12c).
The results of theoretical model with noise environment of 3% with 5 objects of different sizes and
located at different depths are shown in Figure 12.
a
b
c
Fig 12. The results of theoretical model with noise environment of 3%
There are 5 objects of different sizes and located at different depths.
10
V. D. Minh, D.A. Chung. / VNU Journal of Mathematics-Physics, Vol. 29, No. 3 (2013) 1-13
Calculation results show that the objects of model mentioned above show clear relevant anomalies.
It suggests that although there are many environmental hollow caves situated near one another, MES
method can still identify objects located at a depth greater than 1,5 times corresponding to their size
when environmental noise is 3%.
3.2. Simulation of the hollow cave by GPR method
The model has many hollow caves with the same size located at different depths
We chose to conduct calculations and theoretical models with 5 hollow caves in the same size 1m
and located at a depth respectively from left to right is 1.5 m, 2m, 1m, 4m and 3m on the 1
measurement line (like the theoretical model for a MES method - see Figure 13) located in the
environment dielectric constant of the medium of 18, resistors 100Ωm environment.
Fig 13. Theoretical hollow cave model with 5 objects of the same size at different depths
used for GPR method
Results calculated using a theoretical model shows that with the GPR method, the objects of the
same size of 1 meter in different depth show very clear parabolic anomalies (Figure 14) located in
depths coincide with the depths of the corresponding model objects; and treatment by allowing
Migaration shift (Figure 15) gives us the exact size of the objects. However, the GPR method can not
identify the below bottom of the objects that define the peaks and their width.
Fig 14. The results of theoretical model with environmental dielectric constant 18 and 5 hollow caves with a
dielectric constant of 1, the same size at different depths using 200 MHz antenna.
V. D. Minh, D.A. Chung. / VNU Journal of Mathematics-Physics, Vol. 29, No. 3 (2013) 1-13
11
Fig 15. The results of theoretical model with environmental dielectric constant 18 and 5 hollow caves with
dielectric constant of 1, the same size and located at different depths using 200 MHz antenna after treatment by
allowing movement of Migration.
The model has many hollow caves with different size located at different depths
We chose to conduct calculations and theoretical model with 5 hollow caves in size respectively
from left to right is 1m, 1.5m, 1m, 2.5m and 2m respectively located at a depth of 1, 5m, 2m, 1m, 4m,
and 3m on the 1 measurement line (such as theoretical model for MES method - see Figure 16) with a
dielectric constant of 18, environmental resistance 100Ωm and cave is hollow thus we set the air
dielectric constant equal to 1.
Fig 16. Theoretical hollow cave model with 5 different size objects at different depths
used for GPR method.
Fig 17. The results of theoretical model with environmental dielectric constant 18 and 5 hollow caves with a
dielectric constant of 1, different sizes and located at different depths using the 200 MHz antenna.
12
V. D. Minh, D.A. Chung. / VNU Journal of Mathematics-Physics, Vol. 29, No. 3 (2013) 1-13
Fig 18. The results of theoretical model with environmental dielectric constant 18 and 5 hollow caves with a
dielectric constant of 1, different sizes and located at different depths using the 200 MHz antenna after treatment
by allowing movement of Migration.
Results calculated on a theoretical model shows that GPR method completely determine the
location, depth on the surface of the objects of different sizes and located at different depths through
the abnormal expression of the parabola (Figure 17). We are able to determine the width of moving
objects by allowing Migration (Figure 18). However, this method cannot show the bottom of the
object.
4. Conclusion
1. For MES method
- Multi- electrode sounding method can identify the object of hollow cave at a depth greater than
1,5 times the size of our with natural environment noise of 3% even when hollow caves situated close
to each other. And when the environment is only a hollow cave, it is possible to determine the
independent hollow cave situated at depths greater than 2 times their size with environmental noise of
3%.
- Location of anomalies compared to the object's position in the theoretical model is completely
accurate, but the size of the anomaly is much larger than the size of the object even in cases where
there is no environmental interference. Thus, uncertainty about the size of the object obtained is
significant.
2. For GPR method
- With the same theoretical model, GPR method allows to always detect objects even when MES
method does not have the ability.
- In environments with 100 Ωm resistivity, dielectric constant of 18, GPR method accurately
determines earth depth as well as on the size of the object to 4m depth.
- GPR method cannot determine under the bottom of the object.
V. D. Minh, D.A. Chung. / VNU Journal of Mathematics-Physics, Vol. 29, No. 3 (2013) 1-13
13
3. Thus, the study shows that the application of MES method and GPR method completely
effective for the search and detection of objects hidden in body of dikes, dams which are hollow caves.
However, the combined application of these methods is needed to in order to to be able to accurately
determine the depth and size of the object. At the same time, more research is needed to improve
methods for more efficient collecting and processing. This is the direction of our future research and
results will be published elswhere.
Acknowledgements
We would like to convey our most sincere thanks to Vietnam National University, Hanoi for
supporting the project under Group B, VNU-level, Code QG.11.03, through which we can obtain the
results presented in this paper.
References
[1] Advanced Geoscienes, “EarthImager 2D resistivity and IP Invesion”, Advanced Geosciences inc, Austin, Taxas,
2002.
[2] Advanced Geoscienes, “The SuperSting™ with Swift™ automatic resistivity and IP system Instruction Manual”,
Advanced Geosciences inc, Austin, Taxas, 2000-2009.
[3] Vu Duc Minh, Nguyen Ba Duan, “Application of methods of Ground Penetrating Radar and of Multi-electrode
Resistivity Imaging to discover old road foundations around Doan Mon vestige”, VNU Journal of Science, Earth
Sciences, 23(2), 2007,p. 126-135.
[4] Vũ Đức Minh, , “The Improved Multi-electrode Electrical Sounding Method”, VNU. Journal of Science, Natural
Sciences and Technology, 26, 2010, p. 233-241. (Vietnamese)
[5] Stewart N., Griffiths H., Ground Penetrating Radar - 2nd Edition, MPG Books Limited, Bodmin, Cornwall, UK,
2004.
[6] Hara, T. and Sakayoma, T, "The Applicability of Ground Penetrating Radar to Site Investigations", OYO
Corporation, Urawa Research Institute, Urawa, Japan. 1985, p.31.