Spatial interpolation and assimilation methods for satellite and ground meteorological data in Vietnam
Bạn đang xem bản rút gọn của tài liệu. Xem và tải ngay bản đầy đủ của tài liệu tại đây (2.92 MB, 17 trang )
J Inf Process Syst, Vol.11, No.4, pp.556~572, December 2015
/>
ISSN 1976-913X (Print)
ISSN 2092-805X (Electronic)
Spatial Interpolation and Assimilation Methods for
Satellite and Ground Meteorological Data in Vietnam
Khac Phong Do*, Ba Tung Nguyen*, Xuan Thanh Nguyen*, Quang Hung Bui*, Nguyen Le Tran*,
Thi Nhat Thanh Nguyen*, Van Quynh Vuong**, Huy Lai Nguyen***, and Thanh Ha Le*
Abstract
This paper presents the applications of spatial interpolation and assimilation methods for satellite and ground
meteorological data, including temperature, relative humidity, and precipitation in regions of Vietnam. In
this work, Universal Kriging is used for spatially interpolating ground data and its interpolated results are
assimilated with corresponding satellite data to anticipate better gridded data. The input meteorological data
was collected from 98 ground weather stations located all over Vietnam; whereas, the satellite data consists of
the MODIS Atmospheric Profiles product (MOD07), the ASTER Global Digital Elevation Map (ASTER
DEM), and the Tropical Rainfall Measuring Mission (TRMM) in six years. The outputs are gridded fields of
temperature, relative humidity, and precipitation. The empirical results were evaluated by using the Root
mean square error (RMSE) and the mean percent error (MPE), which illustrate that Universal Kriging
interpolation obtains higher accuracy than other forms of Kriging; whereas, the assimilation for precipitation
gradually reduces RMSE and significantly MPE. It also reveals that the accuracy of temperature and humidity
when employing assimilation that is not significantly improved because of low MODIS retrieval due to cloud
contamination.
Keywords
Assimilation, Interpolation, Meteorological Variables, Kriging, Vietnam
1. Introduction
There are increasingly more demands for distributed high-resolution surface meteorological data to
stimulate advances in assessing forest fire risk, water resources, soil sciences, agricultural and ecological
studies [1-4]. The meteorological data required by these applications is usually measured at meteorological
stations, and the data is only valid for the points where it is measured. Spatial interpolation can be used to
estimate meteorological variables at other locations. In addition, the low accuracy of interpolated data at
locations far away from stations can be improved by assimilating with corresponding satellite data.
Various statistical methods have been studied in the literature on climate data interpolation and have
been assimilated to create full-gridded, high-resolution data. The aim is to anticipate values for miss※ This is an Open Access article distributed under the terms of the Creative Commons Attribution Non-Commercial License ( which
permits unrestricted non-commercial use, distribution, and reproduction in any medium, provided the original work is properly cited.
Manuscript received May 26, 2015; accepted June 17, 2015; onlinefirst December 7, 2015.
Corresponding Author: Khac Phong Do ()
* Field Monitoring Center, University of Engineering and Technology, Vietnam National University, Hanoi, Vietnam ({phongdk, tungnb, thanhnx,
hungbq, letn, thanhntn, halt}@fimo.edu.vn)
*** Institute for Forest Ecology and Environment, Vietnam Forestry University, Hanoi, Vietnam ()
*** Faculty of Environmental Engineering and Management, School of Environment and Resources Development, Asian Institute of Technology
(AIT), Pathumthani, Thailand ()
www.kips.or.kr
Copyright© 2015 KIPS
Khac Phong Do, Ba Tung Nguyen, Xuan Thanh Nguyen, Quang Hung Bui, Nguyen Le Tran, Thi Nhat Thanh Nguyen,
Van Quynh Vuong, Huy Lai Nguyen, and Thanh Ha Le
data locations from a limited amount of sample data points which are associated with some possible
ancillary variables. For the purpose of interpolation Kriging has been evaluated as a better interpolation
method with high accuracy and low bias, in comparison to other methods [5,6]. Some work conducting
research Kriging interpolation in their country-level data were reported [7-9]. A total of 922
meteorological stations in the U.S. were interpolated using residual Kriging associated with elevation
data and 12 direction models [6]. In Finland [10], Kriging is applied with external drift (e.g., mean
elevation, sea levels, and lake percentage) on station-based temperature and precipitation. In the
northwest region of Vietnam, some researchers have applied Kriging interpolation to frost and low
temperature data from stations to construct and continuously update a high-resolution, 100 m × 100 m
warning map of frost and low temperatures in some provinces [11,12]. Some optimistic results were
reported in our previous work [13], in which Universal Kriging (UnK) interpolation was employed for
temperature and humidity variables. In this research, we have expanded UnK interpolation for
precipitation variables and have applied an assimilation technique to three meteorological variables,
including temperature, relative humidity, and precipitation, using the MODIS Atmospheric Profiles
product (MOD07) and Tropical Rainfall Measuring Mission (TRMM). This ten-fold cross validation
was used to evaluate the accuracy of our proposed interpolation and assimilation methods with 6-year
worth of meteorological data from 2008 to 2013. In addition, we also compared our results with those
from the Weather Research and Forecasting (WRF) model in August and December 2010.
This paper consists of four main sections: the introduction, datasets and methodology, results, and
conclusion.
2. Datasets and Methodology
2.1 Study Area
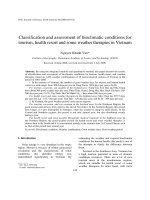
Fig. 1. Meteorological station map in Vietnam.
J Inf Process Syst, Vol.11, No.4, pp.556~572, December 2015 | 557
Spatial Interpolation and Assimilation Methods for Satellite and Ground Meteorological Data in Vietnam
The study area for this research is in Vietnam, which is located at approximately 8°N to 23°N and
100°E to 120°E. Vietnam is a tropical country and spans a land area of almost 33 million ha, including 5
main terrain groups: mountains, karts, valleys and mountainous hollows, sedimentary deltas, and
coasts. Mountains and sedimentary deltas are the most important terrains. Based on geographical
conditions, Vietnam is divided into seven climate regions: Northwest, Northeast, Red River Delta,
North-Central Coast, South-Central Coast, Central Highlands, and South, as shown in Fig. 1.
In the northern regions, the average temperature ranges from 22°C–27.5°C in the summer and from
15°C–20°C in the winter, whereas, the southern areas have more stable average temperatures that range
from 26°C–27°C and 28°C–29°C throughout the year. The annual rainfall in Vietnam ranges from 700–
5,000 mm, and the most common numeric precipitation quantity recorded is about 1,400–2,400 mm in
which the North customarily receives more rainfall than the South. Moreover, the mountain systems
play a vital role in the distribution of annual rainfall. In high mountainous areas with high rainfall, the
annual average relative humidity peaks up to 86%–87%, whilst it is in range of 80%–85% in other
northern areas. However, in the South or Central Highlands, the index of relative humidity only drops
to 77%–78%. The rain mechanism exerts profound impacts on the annual oscillogram of relative
humidity. In the first half of winter, the relative humidity is quite low in the Northeast and North Delta.
It increases during the remaining winter period due to heavy, drizzly rains and then decreases. It
increases again in the summer months. In the North Central and South Central, the relative humidity is
low in the summer and quite high in the winter. Meanwhile, the humidity is quite low in the middle and
end of winter and quite high during the summer in the North West, Central Highlands, and South.
2.2 Datasets
There are five types of data that we collected and used in this study, which are as described below.
Ground station data: all meteorological data was collected from the National Centre for Hydro
Meteorological Forecasting (NCHMF) from 2008 to 2013. Every day, the temperature (GR TEMP) and
relative humidity (GR RH) were measured at 13:00, and precipitation (GR PRECIP) was accumulated
and measured at 13:00 and 24:00 (Vietnam time zone) from 98 stations spread around Vietnam (Fig. 1).
In addition, spatial information, including the location and altitude (GRA), of these ground stations are
also included in the data set. The ground station data was employed to interpolate a full-gridded map of
Vietnam for each meteorological data set.
Satellite atmospheric variables: the MODIS Atmospheric Profile product (MOD07_L2) produces
data during the day and night at 5 × 5 1-km spatial resolution. MOD07_L2 includes the surface
temperature (MOD TEMP) and moisture (MOD RH) at 20 different levels ranging from the surface of
the earth to the top of the atmosphere under cloud-free conditions [14]. MOD TEMP and MOD RH
were assimilated with the interpolation fields of temperature and humidity, respectively, to obtain
better results.
Tropical Rainfall Measuring Mission (TRMM): The TRMM 3B42RT (V7) used in this study is a
global product with 0.25o × 0.25o spatial resolution [15]. This data set is acquired every three hours and
distributed for free by NASA Goddard Earth Sciences Data and Information Services (GESDISC) [16].
TRMM data was assimilated with the interpolation field of rainfall to achieve better results.
Satellite Digital Elevation Map (DEM): The Advanced Spaceborne Thermal Emission and
Reflection Radiometer (ASTER) is a medium-to-high spatial resolution, multispectral imaging system
558 | J Inf Process Syst, Vol.11, No.4, pp.556~572, December 2015
Khac Phong Do, Ba Tung Nguyen, Xuan Thanh Nguyen, Quang Hung Bui, Nguyen Le Tran, Thi Nhat Thanh Nguyen,
Van Quynh Vuong, Huy Lai Nguyen, and Thanh Ha Le
flying onboard the Terra satellite. The imaging system acquires a stereoscopic image at 15 m spatial
resolution for creating the DEM. As a result, the ASTER DEM is a 30-m-elevation dataset created by
stereo-correlating automated techniques [17]. ASTER DEM was used as ancillary data in order to
eliminate the elevation effect of temperature data.
Weather Research and Forecasting model data: The Asian Institute of Technology (AIT) provides
model-based meteorological gridded data (temperature, relative humidity, and rainfall) at a resolution of
12 km × 12 km in two months (August and December 2010). In the northern part of Vietnam, the peak of
rainfall is customarily in August, while the dry season occurs in December in the southern regions. This
data was used to examine the correlation efficient with ground station data and our results.
2.3 Methodology
2.3.1 Kriging spatial interpolation for meteorological data
Interpolation techniques anticipate values for miss-data locations from the curb of a number of
sample data points. There are various statistical methods that have been developed for climate data
interpolation. Some research indicates that Kriging-based interpolation methods have higher accuracy
and lower bias than other geo-statistical methods [18,19]. These methods are a linear combination of
weights determined by the spatial variation structure. In our previous study [13], we applied UnK to
interpolate temperature and relative humidity data based on the outstanding estimation.
The spatial processes record surface trends and drift, which is a variety of the attributes depending on
other variables. The temperature decrease coincides with the altitude increase at nearly 6.5oC per km
[20], whereas, the latitude and longitude impacts temperature according to linear regression [21].
Furthermore, the rainfall is also influenced in orographic regions [22,23]. In addition, according to the
research conducted in [24], the method of decomposing the observation into a surface trend and a
residual value is better than interpolating directly onto the observed data, especially when applying it to
a wide spatial area. Therefore, the UnK algorithm is carried out through three main steps. First, the data
trend is identified and removed from observed meteorological data so that the residual will be more
stationary. Specifically, the trend is estimated by a regression model and the meteorological data in
order. Second, the variogram model can be constructed by using the spatial correlation of the residuals
in order to calculate the weight of the neighbors. Finally, the trend is compensated back to the estimated
residuals to gain the final results.
2.3.2 Assimilation methodology
Data assimilation is a set of technologies for merging model predictions and monitoring data. The
technique’s main target is to obtain a more accurate model from a variety of data sources [25].
Normally, there are two fundamental approaches for data assimilation, namely sequential assimilation
and retrospective assimilation (non-sequential). Clearly, sequential assimilation only considers an
observation made in the past until the time of analysis, while non-sequential assimilation can utilize an
observation from the future. In the 1950s, Cressman proposed the inadequacy of the observation to
modify the assimilated value at a location where we already know its meteorological value, which can be
gained by interpolation. At the grid location , the assimilated value is calculated within a radius as:
J Inf Process Syst, Vol.11, No.4, pp.556~572, December 2015 | 559
Spatial Interpolation and Assimilation Methods for Satellite and Ground Meteorological Data in Vietnam
=
+
( , )(
∑
∑
)
(, )
(1)
where, , are interpolated values from the ground station data at locations , ,respectively; is the
observation from the satellite at location ; and ( , ) is the weight of at location . The weights are
prescribed as:
(, )=
(, )
(, )
0
(, )≤
(2)
(, )>
where, ( , ) is the distance between the location and . However, this method exerts some
detrimental impacts. For example, all of the observations are processed identically without considering
their quality; or if an interpolated value has good quality, it is not necessary to take the place of this
value by poor quality observations.
To deal with the drawbacks of the Cressman method, we carried out a simple statistical method,
along with a direct computation of the best linear unbiased estimation (BLUE). Suppose that each
meteorological value observed at the same position from each source can be presented as: = + ,
where, is the actual value and is the error ( = 1,2 for the data station and data satellite,
respectively). Their errors satisfy the following hypotheses:
- ( ) = 0, unbiased measurements.
( ) = , the accuracy is known.
( , ) = 0, (
) = 0, errors are independent.
Kriging products contain an interpolated Kriging value (KV) field and a Kriging error (KE) field,
while the observation field (MV) was gained directly from satellite data (MODIS MOD07 and TRMM)
and the observation error field (ME) is achieved by calculating the covariance between the station data
and satellite data. Note that, it is essential to correct the MV for the ground station data before
( )
assimilating it by the linear regression function of ( ):
′ (described in the next subsection), in
order to assure unbiased measurement.
We combined two data resources in order to discover an estimator , which is:
- Linear: =∝
+∝
, with ∝ +∝ = 1.
- Unbiased: ( ) = .
( ) is mininal.
- Minimal variance:
To compute the weight ∝ , we used the unbiased hypothesis:
( ̅ ) = (∝ +∝ ) +∝
= (∝ +∝ )
( ) +∝
( )
(3)
The variance of ̅ is calculated as the following equations:
( ̅ ) = (( ̅ − ) )
) )
+∝
= ((∝
=∝ ( )+∝ ( )
)
+2 ∝ ∝ (
=∝
+∝
=∝
+ (1 −∝ )
=( + )∝ −2 ∝ +
560 | J Inf Process Syst, Vol.11, No.4, pp.556~572, December 2015
(4)
Khac Phong Do, Ba Tung Nguyen, Xuan Thanh Nguyen, Quang Hung Bui, Nguyen Le Tran, Thi Nhat Thanh Nguyen,
Van Quynh Vuong, Huy Lai Nguyen, and Thanh Ha Le
Estimator ̅ has to minimize this variance, which is a function of ∝ . That estimator is the minimum
where its derivative with respect to ∝ is zero, so that:
∝ =
(5)
Finally, the value of ̅ is:
̅=
+
(6)
According to Eq. (13), the calculation to assimilate the meteorological value at location s is shown
below as:
=
where,
,
respectively.
′
,
′ +
(7)
stand for data assimilation, corrected satellite data and the KV at location s,
are the satellite data errors and the KE at location .
2.3.3 Meteorological satellite data correction
The fact remains that the biases and errors between satellite and ground meteorological data must be
estimated before assimilation. Particularly, each satellite dataset X has been corrected to its
corresponding meteorological ground data Y using linear regression function
= ( ):
, where and are regression parameters. Every day, we acquired pairs of each
), (
), … , (
) at ground station positions from two sources of the satellite
meteorological data (
and ground station, respectively. The estimation of two parameters, and , is to minimize the sum:
( , ) =∑
(
−
− )
(8)
Using the least mean square minimization to solve (8) we obtained:
=
∑
∑
∑
(9)
∑
∑
and:
=
−
̅=
∑
∑
(10)
2.3.4 Ten-fold cross validation
Ten-fold cross validation is applied to assess and choose the best interpolation and assimilation
methods for each meteorological variable. In detail, 98 ground stations were randomly partitioned into
ten subsets equally, where nine subsets were used as interpolation data and the remainder was
preserved as the validation data for testing. The cross-validation process was then repeated ten times,
called fold, to ensure that each of the ten subsets were used exactly once as the validation data. The
ultimate estimation was averaged ten results of ten folds. The relative precision of these models was
compared with respect to the root mean square error (RMSE) and mean percent error (MPE).
J Inf Process Syst, Vol.11, No.4, pp.556~572, December 2015 | 561
Spatial Interpolation and Assimilation Methods for Satellite and Ground Meteorological Data in Vietnam
3. Results and Discussions
3.1 Spatial Correlation and Variogram Modeling
Overall, the spatial correlation coefficient of precipitation is much lower than temperature and
humidity variables and this coefficient decreases more sharply in the case of further distance and more
surrounding stations. Fig. 2(a) shows the spatial correlation for temperature in terms of distance, in
which the correlation coefficient within 50 km reaches about 0.8. These coefficients for humidity and
precipitation are lower than the temperature, at around 0.6 and 0.35, as seen in Figs. 3(a) and 4(a),
respectively. Similarly, Fig. 2(b) shows the spatial correlation for temperature in terms of the number of
neighbors in which the correlation coefficient with the ten nearest neighbors stands at approximately
0.7. In contrast, humidity and rainfall have quite a low correlation coefficient if calculated with the
ten nearest neighbors, at only 0.55 and 0.3, respectively, as shown in Figs. 3(b) and 4(b).
(a)
(b)
Fig. 2. Spatial correlation coefficient of temperature with respect to distance (a) and to number of neighbor
ground stations (b).
(a)
(b)
Fig. 3. Spatial correlation coefficient of humidity with respect to distance (a) and to number of neighbor
ground stations (b).
562 | J Inf Process Syst, Vol.11, No.4, pp.556~572, December 2015
Khac Phong Do, Ba Tung Nguyen, Xuan Thanh Nguyen, Quang Hung Bui, Nguyen Le Tran, Thi Nhat Thanh Nguyen,
Van Quynh Vuong, Huy Lai Nguyen, and Thanh Ha Le
(a)
(b)
Fig. 4. Spatial correlation coefficient of precipitation with respect to distance (a) and to number of
neighbor ground stations (b).
These differences suggest the distinction in the number of neighbors when constructing the variogram
and selecting its practical range. In this research, we used 10 ( ≈ 0.7), 7 ( ≈ 0.6), and 5 ( ≈ 0.4)
neighbor ground stations for interpolating temperature, humidity, and precipitation variables, respectively.
Meanwhile, the practical range was within 600 km for temperature ( ≈ 0.5), 300 km for humidity
( ≈ 0.3), and 100 km for precipitation ( ≈ 0.28). The results also suggested that the Spherical model
would definitely be the best suited to the variogram for all of the meteorological variables.
3.2 Satellite Data Correction
(a)
(b)
(c)
Fig. 5. Correlation of temperature (a), humidity (b), precipitation (c) in August 10, 2010.
J Inf Process Syst, Vol.11, No.4, pp.556~572, December 2015 | 563
Spatial Interpolation and Assimilation Methods for Satellite and Ground Meteorological Data in Vietnam
Data correction aims at improving satellite data quality before the data assimilation step. Based on the
amount of matching between satellite- and ground-meteorological variables and their correlation
coefficient, it was then decided whether or not to apply the data correction step. We propose two strict
conditions for these parameters, which will be applied on each daily dataset. First, the number of pairs for
each meteorological data were equal to or greater than 30 according to the statistical theory ( ≥ 30).
Second, the correlation coefficient between satellite- and ground-based data was high enough ( = 0.4
and = 0.3 for temperature, precipitation, and humidity, respectively).
The correlation coefficient on August 10, 2010 between the MOD TEMP and GR TEMP was about
0.50, between GR RH and MOD RH it was 0.33, and between the GR PRECIP and TRMM it was 0.56.
In this case, the average number of observed data at each station position per day for MOD RH was 37,
but for MOD TEMP it was 38 because of cloud cover. TRMM is a global product with full data at any
position, so every day, there were 98 pairs of precipitation variables. Data assimilation was applied to all
meteorological variables for this case.
3.3 Interpolation and Assimilation Results
(a)
(c)
(b)
(d)
(e)
Fig. 6. Interpolated error map (a), Interpolated GR_PRECIP (b), TRMM error map (c), corrected TRMM (d),
and assimilated precipitation (e) in Vietnam, August 10, 2010.
564 | J Inf Process Syst, Vol.11, No.4, pp.556~572, December 2015
Khac Phong Do, Ba Tung Nguyen, Xuan Thanh Nguyen, Quang Hung Bui, Nguyen Le Tran, Thi Nhat Thanh Nguyen,
Van Quynh Vuong, Huy Lai Nguyen, and Thanh Ha Le
Fig. 6 illustrates the interpolation and assimilation results on a dataset recorded on August 10, 2010.
The KE map and interpolated map of ground precipitation measurements at 0.1° × 0.1° are shown in
Fig. 6(a) and (b). Meanwhile, the TRMM error map and corrected TRMM map that were calculated
from the satellite TRMM and online ground precipitation measurements are presented in Fig. 6(c) and
(d). The data assimilation technique mentioned in Section 2 is based on four maps to create the final
precipitation result, as shown in Fig. 6(e).
In Vietnam, the rainy seasons in the seven climate regions vary. The biggest drought period is from
January to March in all regions of Vietnam, as shown in Fig. 7(a). Otherwise, high rainfalls occur in the
north of Vietnam in August (see Fig. 7(b)), and for the North Central Coast they happen in November
(see Fig. 7(c)). The replication of rainfall behaviors from assimilated data was confirmed by real
seasonal and regional characteristics. Similarly, temperature and humidity data were processed in the
same way for procedure maps at (0.1° × 0.1°). Fig. 8 presents the average temperature and humidity
throughout Vietnam in January. Cold weather and high humidity occurred in the winter months in the
north and hot temperatures and dry conditions dominated in the south.
(a)
(b)
(c)
Fig. 7. Total precipitation in (a) January, (b) August, and (c) November in Vietnam.
(a)
(b)
Fig. 8. Average temperature (a) and humidity (b) in January over Vietnam.
J Inf Process Syst, Vol.11, No.4, pp.556~572, December 2015 | 565
Spatial Interpolation and Assimilation Methods for Satellite and Ground Meteorological Data in Vietnam
3.4 Ten-Fold Cross Verification Results
In order to evaluate the effectiveness of the interpolation and assimilation methods, we used the
RMSE, which is defined as follows:
= ∙∑
∙∑
− ̅
(11)
∙ 100%
(12)
and the MPE is defined as:
= ∙∑
∙∑
where, is the number of testing stations; is the number of tests in a ten-fold estimation; and ̅
are the observed meteorological variables and their interpolated values, respectively.
Validation for the proposed assimilation techniques were carried out on a dataset collected over the
course of six years. As a result, the number of temperature, humidity, and precipitation images were
526, 120, and 771 days, respectively.
The validation results of different techniques for temperature, relative humidity, and precipitation are
presented in Tables 1–3, respectively. Regarding temperature and humidity, the assimilation technique
(UnK+DEM+Assim / UnK+Assim) did not improve interpolation results. When temperature interpolation
with DEM correction was applied, the RMSE was 1.97K and MPE was 0.532%. Assimilation slightly
increased RMSE and MPE up to 2.056K and 0.569% (Table 1). Similarly, the assimilation for humidity
increased RMSE and MPE from 6.61% and 7.73% to 8.89% and 10.36%, respectively (Table 2). Due to
there being less variant characteristics in space of both temperature and humidity variables and the low
quality of corresponding satellite products, UnK gained better results than the assimilation techniques
could.
Table 1. Temperature models validation results
Model
RMSE (K)
MPE (%)
UnK+DEM
1.97
0.532
UnK+DEM+Assim
2.056
0.569
Model
RMSE (%)
MPE (%)
UnK
6.61
7.73
UnK+Assim
8.89
10.36
Table 2. Relative humidity models validation results
Table 3. Precipitation models validation results
Model
RMSE (mm)
MPE (%)
UnK
15.21
88.40
UnK+Assim
14.12
66.58
566 | J Inf Process Syst, Vol.11, No.4, pp.556~572, December 2015
Khac Phong Do, Ba Tung Nguyen, Xuan Thanh Nguyen, Quang Hung Bui, Nguyen Le Tran, Thi Nhat Thanh Nguyen,
Van Quynh Vuong, Huy Lai Nguyen, and Thanh Ha Le
Table 3 illustrates the evaluation results of precipitation interpolation between the two methods of
UnK and UnK+Assim. The error estimation of MPE in the UnK+Assim model decreased considerably
to 66.58%, compared to 88.40% in UnK. The value of RMSE also indicates that the integration of
ground and satellite precipitation produced better accuracy than only ground data did. The proposed
assimilated technique has shown the strongest effect on precipitation variables, which can be explained
by their large variants in the space of rainfall variables in comparison with temperature and humidity.
3.5 The WRF Assessment
1
20
0.9
18
0.8
16
0.7
14
0.6
12
0.5
10
0.4
8
0.3
6
0.2
4
0.1
2
0
Number of images
Correlation coefficient
We used temperature, humidity, and precipitation maps in August and December 2010 that were
produced by using the WRF model as the third party to assess the quality of our products. Fig. 9 shows
the correlation coefficient between the WRF’s products and our results. Temperature gains strong
correlation in both December and August, which can be explained by the good quality of the
temperature products (see Table 1). Humidity just shows a high relation in December but in August.
Rainfall has the lowest correlation coefficient in both months due to the lower quality of precipitation
products. The trend of correlation coefficients between the WRF and assimilation products can be
explained via relation of the WRF and ground station measurements (Fig. 10).
Dec. 2010
Aug. 2010
Aug. No
Dec. No
0
Temperature
Relative Humidity
Rainfall
Fig. 9. The Weather Research and Forecasting’s products vs. assimilated products.
30.5
Correlation coefficient
1
0.9
30
0.8
29.5
0.7
0.6
29
0.5
28.5
0.4
28
0.3
27.5
0.2
Dec. 2010
Aug. 2010
Dec. No
Aug. No
27
0.1
0
26.5
Temperature
Relative Humidity
Rainfall
Fig. 10. The Weather Research and Forecasting’s products vs. ground station.
J Inf Process Syst, Vol.11, No.4, pp.556~572, December 2015 | 567
Spatial Interpolation and Assimilation Methods for Satellite and Ground Meteorological Data in Vietnam
Fig. 11 illustrates the comparison results between the WRF model and our approach in more detail.
Overall, in two months, the high correlation in terms of temperature occurred in all seven climate
regions, with the number for the Northern Delta being the highest ( ≈ 0.95in August and ≈ 0.75
in December). However, the rainfall correlation in the northern regions was higher than the southern
ones, especially in the Southern Delta, which had a negative correlation. As can be seen in Fig. 11(a),
there were some variations in relative humidity correlation in August and all of them were quite low.
The Northeast had the highest humidity correlation at only 1.5; whereas, the negative humidity
correlation occurred in the Northern Delta, Northwest, and Central Highlands ( ≈ −0.5). In contrast,
the relative humidity in December was high in the Northeast, North-Central Coast, and Northwest
( ≈ 0.7) and this number for the South-Central Coast was just over 0.1.
December 2010
August 2010
1
Temperature
Relative Humidity
0.8
Rainfall
0.6
0.4
0.2
Temperature
0.9
Correlation coefficient
Correlation coefficient
1
Relative Humidity
0.8
Rainfall
0.7
0.6
0.5
0.4
0.3
0.2
0.1
0
0
-0.2
-0.4
-0.6
(a)
(b)
Fig. 11. Correlation coefficient between the Weather Research and Forecasting and assimilation products
in 7 climate regions.
4. Conclusion
We have presented the applications of spatial interpolation and assimilation methods for
meteorological variables including temperature, relative humidity, and precipitation in the regions of
Vietnam. The input meteorological data includes satellite data (MOD TEMP, DEM, TRMM) and
ground data collected over the course of six years (2008–2013) from 98 ground weather stations located
throughout Vietnam. The outputs were interpolated fields and assimilated fields of temperature,
relative humidity and precipitation. Our results show that Kriging interpolation and assimilation with
MODIS surface temperature outperforms when applied to temperature data with the support of a
568 | J Inf Process Syst, Vol.11, No.4, pp.556~572, December 2015
Khac Phong Do, Ba Tung Nguyen, Xuan Thanh Nguyen, Quang Hung Bui, Nguyen Le Tran, Thi Nhat Thanh Nguyen,
Van Quynh Vuong, Huy Lai Nguyen, and Thanh Ha Le
digital elevation model. The assimilation of TRMM precipitation data improved the spatial prediction
of ground precipitation.
Acknowledgement
The authors would like to thank the research projects, "Forest fire information system, QGTD.13.26"
and "Air pollution monitoring and warning system, QGTD.13.27," from Vietnam National University,
Hanoi for their financial support.
References
[1] M. B. Araujo and M. Luoto, “The importance of biotic interactions for modelling species distributions under
climate change,” Global Ecology and Biogeography, vol. 16, no. 6, pp. 743-753, 2007.
[2] J. Miller and J. Franklin, “Modeling the distribution of four vegetation alliances using generalized linear models
and classification trees with spatial dependence,” Ecological Modelling, vol. 157, no. 2, pp. 227-247, 2002.
[3] T. L. Liu, K. W. Juang, and D. Y. Lee, “Interpolating soil properties using kriging combined with categorical
information of soil maps,” Soil Science Society of America Journal, vol. 70, no. 4, pp. 1200-1209, 2006.
[4] R. K. Meentemeyer, N. J. Cunniffe, A. R. Cook, J. A. Filipe, R. D. Hunter, D. M. Rizzo, and C. A. Gilligan,
“Epidemiological modeling of invasion in heterogeneous landscapes: spread of sudden oak death in California
(1990-2030),” Ecosphere, vol. 2, no. 2, pp. 1-24, 2011.
[5] H. Apaydin, F. K. Sonmez, and Y. E. Yildirim, “Spatial interpolation techniques for climate data in the GAP
region in Turkey,” Climate Research, vol. 28, no. 1, pp. 31-40, 2004.
[6] T. Wu and Y. Li, “Spatial interpolation of temperature in the United States using residual kriging,” Applied
Geography, vol. 44, pp. 112-120, 2013.
[7] C. Daly, M. Halbleib, J. I. Smith, W. P. Gibson, M. K. Doggett, G. H. Taylor, J. Curtis, and P. P. Pasteris,
“Physiographically sensitive mapping of climatological temperature and precipitation across the conterminous
United States,” International Journal of Climatology, vol. 28, no. 15, pp. 2031-2064, 2008.
[8] R. Benavides, F. Montes, A. Rubio, and K. Osoro, “Geostatistical modelling of air temperature in a mountainous
region of Northern Spain,” Agricultural and Forest Meteorology, vol. 146, no. 3, pp. 173-188, 2007.
[9] S. P. Serbin and C. J. Kucharik, “Spatiotemporal mapping of temperature and precipitation for the development
of a multidecadal climatic dataset for Wisconsin,” Journal of Applied Meteorology and Climatology, vol. 48, no. 4,
pp. 742-757, 2009.
[10] J. Aalto, P. Pirinen, J. Heikkinen, and A. Venalainen, “Spatial interpolation of monthly climate data for Finland:
comparing the performance of kriging and generalized additive models,” Theoretical and Applied Climatology,
vol. 112, no. 1-2, pp. 99-111, 2013.
[11] V. K. Duong, D. C. Hoang, T. G. Ngo, H. S. Nguyen, and H. Q. Nguyen, “Study for building a frost and low
temperature monitoring and warning model for north west region in Vietnam,” in Proceedings of National
Scientific Conference on Meteorology and Hydrology, Environment and Climate Change, 2012, pp. 161-167.
[12] V. K. Duong, T. T. Tran, H. Q. Nguyen, and H. S. Nguyen, “Method of zoning map of frost and low temperature
in the north west of Vietnam,” in Proceedings of National Scientific Conference on Meteorology and Hydrology,
Environment and Climate Change, 2012, pp. 168-174.
[13] X. T. Nguyen, B. T. Nguyen, K. P. Do, Q. H. Bui, T. N. T. Nguyen, V. Q. Vuong, and T. H. Le, “Spatial
interpolation of meteorologic variables in Vietnam using the Kriging method,” Journal of Information Processing
Systems, vol. 11, no. 1, pp. 134-147, 2015.
J Inf Process Syst, Vol.11, No.4, pp.556~572, December 2015 | 569
Spatial Interpolation and Assimilation Methods for Satellite and Ground Meteorological Data in Vietnam
[14] J. C. Jimenez-Munoz, J. A. Sobrino, C. Mattar, and B. Franch, “Atmospheric correction of optical imagery from
MODIS and reanalysis atmospheric products,” Remote Sensing of Environment, vol. 114, no. 10, pp. 2195-2210,
2010.
[15] A. Shaban, C. Robinson, and F. El-Baz, “Using MODIS images and TRMM data to correlate rainfall peaks and
water discharges from the Lebanese Coastal Rivers,” Journal of Water Resource and Protection, vol. 1, no. 4, pp.
1-10, 2009.
[16] Z. Liu, “Comparison of precipitation estimates between Version 7 3-hourly TRMM Multi-Satellite Precipitation
Analysis (TMPA) near-real-time and research products,” Atmospheric Research, vol. 153, pp. 119-133, 2015.
[17] A. Hirano, R. Welch, and H. Lang, “Mapping from ASTER stereo image data: DEM validation and accuracy
assessment,” ISPRS Journal of Photogrammetry and Remote Sensing, vol. 57, no. 5-6, pp. 356-370, 2003.
[18] X. Li, G. Cheng, and L. Lu, “Spatial analysis of air temperature in the Qinghai-Tibet Plateau,” Arctic, Antarctic,
and Alpine Research, vol. 37, no. 2, pp. 246-252, 2005.
[19] J. S. Yang, Y. Q. Wang, and P. V. August, “Estimation of land surface temperature using spatial interpolation and
satellite-derived surface emissivity,” Journal of Environmental Informatics, vol. 4, no. 1, pp. 37-44, 2004.
[20] C. Rolland, “Spatial and seasonal variations of air temperature lapse rates in Alpine regions,” Journal of
Climate, vol. 16, no. 7, pp. 1032-1046, 2003.
[21] C. Zhao, Z. Nan, and G. Cheng, “Methods for modelling of temporal and spatial distribution of air temperature
at landscape scale in the southern Qilian mountains, China,” Ecological Modelling, vol. 189, no. 1, pp. 209-220,
2005.
[22] S. H. Chua and R. L. Bras, “Optimal estimators of mean areal precipitation in regions of orographic
influence,” Journal of Hydrology, vol. 57, no. 1, pp. 23-48, 1982.
[23] S. L. Dingman, D. M. Seely‐Reynolds, and R. C. Reynolds, “Application of kriging to estimating mean annual
precipitation in a region of orographic influence,” Journal of the American Water Resources Association, vol. 24,
no. 2, pp. 329-339, 1988.
[24] H. Dobesch, P. Dumolard, and I. Dyras, Spatial Interpolation for Climate Data: The Use of GIS in Climatology
and Meteorology. London: ISTE, 2007, pp. 87-96.
[25] M. Rodell, P. R. Houser, U. Jambor, J. Gottschalck, K. Mitchell, C. J. Meng, et al., “The global land data
assimilation system,” Bulletin of the American Meteorological Society, vol. 85, no. 3, pp. 381-394, 2004.
Khac Phong Do
/>
He received the B.S. degree in Computer Science from University of Engineering and
Technology, Vietnam National University, Hanoi (UET–VNU) in 2014. At the
moment, he is enrolling a Master course as a member of Field Monitoring Center at
UET–VNUHN. His current research interests include Satellite Image Processing,
Computer Vision and Meteorological Data Interpolation.
Ba Tung Nguyen
/>
He received the B.S. degree in Computer Science from University of Engineering and
Technology (UET), VNU in 2013. After graduation, he works in Human-Machine
Interaction Lab on a project about Human gestures recognition. And now he is
undertaking a master course as a member of the Multidisciplinary Integrated
Technologies Center For Field Monitoring at UET-VNU. His research interests
include Human Gestures Recognition and Satellite Imagery Processing for Early
Warning in Forest Fire.
570 | J Inf Process Syst, Vol.11, No.4, pp.556~572, December 2015
Khac Phong Do, Ba Tung Nguyen, Xuan Thanh Nguyen, Quang Hung Bui, Nguyen Le Tran, Thi Nhat Thanh Nguyen,
Van Quynh Vuong, Huy Lai Nguyen, and Thanh Ha Le
Xuan Thanh Nguyen
/>
He received the B.S. in Computer Science from University of Engineering and
Technology, Vietnam National University (UET, VNU), Hanoi, Vietnam in 2013.
During 2013–2014, he studied first year of master program at UET, VNU and did
research at Human Machine Interaction Laboratory, UET–VNU. Now, He is
studying second year of master at Japan Advanced Institute of Science and
Technology. His research interests include Computer Vision, Satellite Image
Processing and Video Coding.
Quang Hung Bui
/>
He received his B.Sc. from Vietnam National University in 2001. He received M.E.
and Ph.D. from Division of Systems Science and Applied Informatics, Graduate
School of Engineering Science, Osaka University in 2005 and 2008, respectively.
Currently he is Director of the Multidisciplinary Integrated Technologies Center for
Field Monitoring, Vietnam National University of Engineering and Technology. His
research interests are Spatial Databases, Spatial Data Infrastructure, Spatial Data
Mining and Geographical Information Systems.
Nguyen Le Tran
/>
He received the B.S. degree in Computer Science from University of Engineering and
Technology (UET), VNU in 2012. After graduation, he pursues his passion of
research by enrolling a master course in Computer Science in UET–VNU and he will
complete the master program in the end of 2015. His research interests include Image
Processing and Computer Vision.
Thi Nhat Thanh Nguyen
/>
She received B.S. and M.S. degrees in Information Technology from the College of
Technology, Vietnam National University, Hanoi in 2005. She received a Ph.D. at
University of Ferrara, Italy in 2012. Her research interests are in Satellite Image
Processing, Air Pollution, and Satellite Aerosol. She is now a lecturer and researcher
in University of Engineering and Technology, Vietnam National University.
Van Quynh Vuong
/>
He received a Ph.D. degree in silviculture and forest fire management in 1991 at the
Voronhezo Forestry University in the Republic of the Russian Federation. He has
been a professor at Forestry University of Vietnam since 2012. His research interests
are in the area of forest hydro-meteorology, forest fire management, environmental
protection and disaster prevention. They include topics such as measures to use of
forests to mitigate flooding and water resource stability, valuation of environmental
services of forests, forest fire risk prediction, forest fire prevention, forest resources
monitoring.
J Inf Process Syst, Vol.11, No.4, pp.556~572, December 2015 | 571
Spatial Interpolation and Assimilation Methods for Satellite and Ground Meteorological Data in Vietnam
Huy Lai Nguyen
/>
He received the B.E. degree in Biotechnology from International University–Vietnam
National University, Ho Chi Minh City in 2012. He received the M.E. degree in
Environmental Engineering and Management (EEM)/School of Environment,
Resources & Development (SERD) from Asian Institute of Technology (AIT),
Thailand in 2015. Currently, he is the research associate in faculty of EEM/SERD,
AIT. His research interests are anthropogenic and biogenic emission inventory
development, meteorological/air quality modeling system.
Thanh Ha Le
/>
Thanh Ha Le received B.S. and M.S. degrees in Information Technology from the
College of Technology, Vietnam National University, Hanoi in 2005. He received a
Ph.D. at the Department of Electronics Engineering at Korea University. In 2010, he
joined the Faculty of Information Technology, University of Engineering and
Technology, Vietnam National University, Hanoi as a lecturer and researcher. His
research interests are multimedia processing, coding satellite image processing and
computer vision. He is now doing research on forest fire using remote sensing
approach as well as high efficient and multiview video coding.
572 | J Inf Process Syst, Vol.11, No.4, pp.556~572, December 2015