DSpace at VNU: Structural and Physical Properies of Y- doped BiFeO3 Material Prepared by Sol-gel Method
Bạn đang xem bản rút gọn của tài liệu. Xem và tải ngay bản đầy đủ của tài liệu tại đây (295.79 KB, 7 trang )
VNU Journal of Mathematics – Physics, Vol. 29, No. 3 (2013) 63-69
Structural and Physical Properies of Y- doped BiFeO3
Material Prepared by Sol-gel Method
Dao Viet Thang1,2,*, Du Thi Xuan Thao2, Nguyen Van Minh1
1
Center for Nano science and Technology, Hanoi National University of Education,
136 Xuan Thuy, Hanoi, Vietnam
2
Department of Physics, University of Mining - Geology, Dong Ngac, Tu Liem, Hanoi, Vietnam
Received 19 July 2013
Revised 23 August 2013; Accepted 20 September 2013
Abstract: Y - doped BiFeO3 materials were prepared by a sol – gel method. X-ray diffraction
(XRD) meansurement has been carried out to characterize crystal structure and to detect the
impurities existing in these materials. The results showed that both lattice constants a and c of
the unit cell of BiFeO3 substance become smaller as the Y3+ content is increased. The effect of
introducing Y3+ was to decrease the optical band gap for doped samples Bi1−xYxFeO3 (x = 0.00
0.20). Magnetic properties of Y-doped BiFeO3 were investigated by vibrating sample
magnetometer (VSM) measurements at room temperature, using maximum magnetic field of about
10 kOe. These materials exhibited a weak ferromagnetic behavior and magnetization of the
sample was improved as presence of Y3+ ions. When x = 0.15, 0.20, structural and magnetic
properties change sharply. Y doping BiFeO3 material modifies its physical properties.
1. Introduction*
Ferroelectromagnetic materials, multiferroics, exhibit ferroelectric properties in combination with
the ferromagnetic properties [1]. Additionally they exhibit the phenomenon called magnetoelectric
coupling, magnetization induced by an electric field and electric polarization in a magnetic field.
Recently, partial substitution of Bi3+ ions by lanthanides has been shown to improve ferroelectric
properties and magnetization [2–3]. Zhang et al. [4] and Das et al. [3] suggested that La3+ substitution
for Bi3+ eliminates impurity phases and destroys the cycloidal spin structure resulting in uniform
canted antiferromagnetic ordering. Zhang also reported that the structure changes from rhombohedral
to orthorhombic at 30 mol% La. In the studies on dopant effects of Sm reported by Nalwa et al. [2]
and Yuan [5] and those of Nd reported by Yuan et al. [6] in BiFeO3, changes in the crystal structure of
the materials were observed, which resulted in improving piezoelectric properties, long-range
_______
*
Corresponding author. Tel.: 84-985811377
Email:
63
64
D.V. Thang et al. / VNU Journal of Mathematics-Physics, Vol. 29, No. 3 (2013) 63-69
ferroelectric and canted antiferromagnetic orders. On the other hand, Uniyal and Yadav [7] claimed
that 10 mol% Gd substituted for bismuth in the sample compound did not change the crystal structure
but only reduced the volume fraction of impurity phases, while decreasing the Neel temperature TN
from 370 0C to 150 0C, and enhancing the magnetization to the extent of allowing the generation of the
ferroelectric hysteresis loops [7]. The report of Hou Zhi – Ling et al. [8] shown that demonstrates the
lattice contraction and magnetic propertties improved due to 5 mol% Y substiuted for bismuth. Our
report shows effect of Y - doping on structure and physical properties of Bi1-xYxFeO3 (x = 0.00
0.20) materials. In this paper, we choose Y-content from x = 0.00 to x = 0.20 because of two reasons
(i) with x small, the properties of Y doping have no significant changes; (ii) with x > 0.20, it may
attribute to structural transition from rhombohedral (R3c) to orthorhombic (Pnma) by Y substitution [9]
2. Experimental
Mutilferroic Bi1-xYxFeO3 (x = 0.00
0.20) powders have been synthesized by a sol – gel method.
The chemicals used to create the samples are ferric nitrate Fe(NO3)3.9H2O, bismuth nitrate
Bi(NO3)3.5H2O, yttrium nitrate Y(NO3)3.6H2O, citric acid and ethylene glycol. In the first step, these
chemicals were mixed in correct weight contribution and an aqueous solution of citric acid was
prepared in distilled water. Then ferric nitrate, bismuth nitrate and ytrium nitrate were added in turn with
constant stirring at temperature 50 – 60 0C to avoid precipitation and obtain a homogeneous mixture. Now
ethylene glycol was added into the solution with citric acid/ethylene glycol ratio of 70/30. After that
water was evaporated at temperatures 100 0C to obtain colloidal gel bath. Finally, the gel was
heated at temperatures of 700 0C for 6 hours to remove organics in the samples.
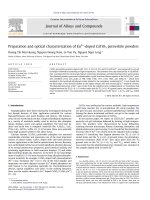
The samples were characterized by using different techniques. X-ray diffraction diagrams was
used for phase identification and crystal structural analysis. The optical properties and electrical
properties were determined by the absorption spectra. Vibrating sample magnetometer was used
to measure the magnetic properties of the samples.
3. Results and discussion
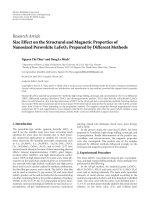
Figure 1a shows the X-ray diffraction patterns of Bi1−x YxFeO3 samples (x = 0.05
0.20). The
XRD patterns are in excellent accordance with the powder data of JCPDS Card No. 71-2494 for
BiFeO3 crystals. Generally, for all samples, the second phase peaks attributed to Fe or Bi rich phases
Bi2Fe4O9 and Bi25FeO40 (asterisk in Fig. 1a) were routinely observed as shown inprevious results [10].
While Y substituted at the Bi site, the phase impurities can not be observed. However, with increasing
Y content, another phase Y3Fe5O12 appears in the x = 0.10, 0.15 and 0.20 powder samples [11]. For
Y-doped BiFeO3, all peaks are indexed according to the R3C cell of BiFeO3. The lattice parameters
deduced for pure BiFeO3 rhombohedral unit cell were found to have values a = 5.587 Å and c =
13.872 Å. The results showed that both lattice constants a and c of the unit cell of BiFeO3 substance
become smaller as the Y3+ content is increased in the figure 1b. It is because the Y3+ ion radius (1.02
65
D.V. Thang et al. / VNU Journal of Mathematics-Physics, No. 29, No. 3 (2013) 63-69
) is smaller than that of Bi3+ ion (1.17
[12]. Crystallite size (d) was evaluated using the well-
known Sherrer formula d = 0.94 / (β cosθ ) [12, 13], where β is the full width at half-maximum of the
chosen diffraction line (here we have chosen (012), (104), (110) and (024) intense peaks), θ the Bragg
diffraction angle and λ the wavelength of CuKα radiantion (1.5406 Å). The result is shown in figure
1b. The crystalline size is about 46 nm for pure sample and decreases as Y-doping is increased from
x = 0.00 to 0.20, which is attributed to the smaller ion radius of Y3+ than that of Bi3+ [8].
(b)
5.58
0.05
0.10
0.15
5.56
(c)
45
5.54
5.52
40
30
40
50
2-theta(degree)
60
13.50
35
30
25
20
0.00
0.05
0.10
0.15
0.20
13.35
Y - Content
0.20
20
13.65
50
22.5
31.5
33.0
0.00
0.05
0.10
Parameter c (Å)
0.00
13.80
Size grain (nm)
Parameter a (Å)
(024)
Y3Fe5O12
(116)
(122)
(018)
(300)
(104)
(110)
Bi25Fe2O40/Bi2FeO9
(006)
(202)
Intensity (a.u.)
(012)
(a)
0.15
0.20
Y- Content
Figure 1. (a) XRD patterns of Bi1−xYxFeO3 powders; (b) a, c structure parameters depend on the Y content; and
the insert showns average crystallite size depend on the Y content.
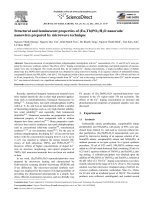
Figure 2 shows the Raman scattering spectroscopy of Bi1-xYxFeO3 samples (x = 0.00
0.20)
measured at room temperature. The previous report has shown that the Raman active modes of the
rhombohedral (R3c) BiFeO3 can be summarized using the following irreducible representation: Γ =
4A1+ 9E [12-14]. In present study we have observed 4A1 modes (at wavenumbers of 170, 210, 464,
and 549 cm−1) and 6E modes (at wavenumbers of 134, 256, 281, 340, 368, and 517 cm−1). The
intensities of E modes are greater than that of A1 modes in the present study. Since Raman scattering
spectroscopy is sensitive to atomic displacements, the evolvement of Raman normal modes with
increasing Y content can provide valuable information about ionic substitution and electric
polarization. The stereochemical activity of the Bi electron pair plays major role in the change, both in
Bi–O covalent bonds and characteristic modes observed at 170, 210, 256, 281, 340 and 368 cm−1 for
pure BiFeO3. These modes are supposedly believed to be responsible for the ferroelectric nature of the
bismuth ferrite samples [15-16]. With increasing in substitution ions, there is a change of Bi–O
covalent bonds as a result of the decline in the stereochemical activity of the Bi lone electron pair and
thus in long range ferroelectric order. If the mode frequency is governed by local factors, such as the
force constant and ionic mass it will be proportional to (k/M)1/2, where k is the force constant and M is
the reduced mass [13]. Since ionic radius of Bi3+ is similar to Y3+, k is assumed to be independent of
substitution ions. However, the shifting of Raman modes at higher frequencies, attrition of the
prominent modes and the change in crystal structure is likely due to the A-site disorder created by Y
substitution, having lower atomic weight 88.9 g as compared to Bi 209.0 g.
66
D.V. Thang et al. / VNU Journal of Mathematics-Physics, Vol. 29, No. 3 (2013) 63-69
A1(LO)
E(TO)
A1(TO)
E(TO)
E(TO)
E(TO)
intensity (a.u.)
A1(LO)
E(TO)
E(TO)
0.00
0.05
0.10
0.15
0.20
100
200
300
400
500
600
Wavenumber (cm-1)
Figure 2. Raman scattering spectra of Bi1-xYxFeO3 materials (x = 0.00
0.20) at room temperature.
The UV–Vis absorption spectra of the Bi1-xYxFeO3 materials were showed in Fig. 3a. In the
previous research, using chemical methods Zhike Liu et al. reported particle size of 150 ÷ 200
nm and the optical band gap (Eg) material of about 2.10 eV for BiFeO3 [17]; approximate values of
optical band gap were observed on BiFeO3 thin films [18-19]; Theoretical calculations of Fan et al.
showed BiFeO3 material have the optical band gap to 2.5 eV [20]. By analyzing the absorption
spectra (in Fig. 3a), we can obtain the values of optical band gap in the range of 2.01 2.08 eV. In the
guide to eyes, Eg decreases with increasing the Y-doped content. The insert in Fig. 3b shows a plot of
(αhν)2 as a function of photon energy. Analysis of the density of states indicated that the valence band
was consisted with Fe-d and O-p states, and the conduction band was composed of Fe-d and Bi-p
states [17]. Outside the absorption spectrum also shows the absorbance at 700 nm position
receptors. This may be related to minor absorption happens when the electron is excited from t2g
bands to eg bands [20].
2.10
8
(a.u.)
(b)
(a)
(α .hν )2
Absorption (a.u)
2.08
6
x = 0.20
4
x = 0.00
x = 0.10
x = 0.15
500
550
2.0
2.5
3.0
3.5
hν (eV)
2.04
2.02
x = 0.05
450
E g (eV)
2
2.06
600
x = 0.20
650
700
750
2.00
0.00
Wavelength (nm)
0.05
0.10
0.15
0.20
Y content
Figure 3. (a) UV–Vis absorption spectra of the Bi1-xYxFeO3 (x = 0.00
2
0.20) materials; (b) the optical band gap
of samples and insert shows a plot of (αh ) as a function of photon energy.
67
D.V. Thang et al. / VNU Journal of Mathematics-Physics, No. 29, No. 3 (2013) 63-69
0.4
0.2
0.0
0.40
Mr
Ms
0.32
M (emu/g)
M (emu/g)
0.2
x = 0.00
(b)
(a)
-0.2
0.0
0.04
M (emu/g)
0.00
0.05
0.10
0.15
0.20
M (emu/g)
0.4
-0.2
0.24
0.16
0.08
0.00
-0.02
-0.04
-800
0.00
0.00
-0.4
0.05
0.10
0.15
0.20
0
-8000
8000
x = 0.05
(c)
0.4
0
8000
x = 0.10
(d)
0.04
-0.2
x = 0.05
(c)
0.02
0.0
0.04
M (emu/g)
0.0
M (emu/g)
0.2
M (emu/g)
M (emu/g)
0.2
0.00
-0.2
-0.02
-0.04
-800
-0.4
0
0
0.00
-0.02
-800
8000
0
800
Magnetic field (Oe)
-0.4
-8000
Magnetic field (Oe)
0.4
x = 0.10
(d)
0.02
-0.04
800
Magnetic field (Oe)
-8000
0
8000
Magnetic field (Oe)
0.4
x = 0.15
(e)
0.2
(f)
x = 0.20
0.0
0.06
-0.2
(e)
x = 0.15
0.03
0.0
(f)
-0.2
0.00
x = 0.20
0.2
M (emu/g)
M (emu/g)
0.2
M (emu/g)
M (emu/g)
800
Magnetic field (Oe)
Magnetic field (Oe)
0.4
0
Magnetic field (Oe)
-0.4
Y - Content
-8000
x = 0.00
(b)
0.02
-0.03
0.0
-0.2
-0.06
-800
0
800
Magnetic field (Oe)
-0.4
-8000
0
Magnetic field (Oe)
8000
-800
-0.4
0
800
Magnetic field (Oe)
-8000
0
8000
Magnetic field (Oe)
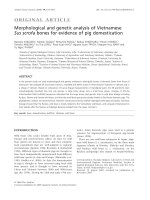
Figure 4. Room-temperature magnetization hysteresis loops of Bi1-xFexO3 powders with x = 0.00 ÷ 0.20 for (b) –
(f) and the insert saturation magnetization (Ms) and remnant magnetization (Mr) versus x value (a).
68
D.V. Thang et al. / VNU Journal of Mathematics-Physics, Vol. 29, No. 3 (2013) 63-69
The magnetization-magnetic field (M-H) curves of Bi1-xYxFeO3 powders measured with a
maximum magnetic field of 10 kOe, as shown in Fig. 4. The partly enlarged curves are shown in the
corresponding insert. In fact, BiFeO3 is known to be antiferromagnetic having a G-type magnetic
structure [21], but has a residual magnetic moment due to a canted spin structure (weak ferromagnetic)
[22]. However, the Y-doped specimens exhibited a magnetic hysteresis loops, referring to a
ferromagnetic behavior. As shown in Fig. 4, the curves are clearly not colinear. The saturation
magnetization (Ms) are 0.052, 0.045, 0.106, 0.172 and 0.349 emu/g for samples x = 0.00, 0.05, 0.10,
0.15 and 0.20, respectively. The remnant magnetizations (Mr) are 0.010, 0.007, 0.011, 0.007 and
0.035 emu/g, respectively. The Ms and Mr values as the function of x are plotted in the insert of Fig.
4a. A relevant research [23] reported that the Y-substitution could suppresses the spin cycloid of
BiYFeO3. Further analysis reveals that the Ms and Mr values of Bi1-xYxFeO3 with x = 0.15 and 0.20
are significantly bigger than those of others, suggesting that with smaller value of x = 0.10. The Ysubstitution can only suppress but can not destruct the spin cycloid, which is responsible for the
limited and smooth increase of the Ms and Mr values. However, when x ≥ 0.10, the Y substitution
results spin cycloid, so that the latent magnetization locked the cycloid may be released, and a
significant increasing of Ms and Mr value is observed. Another phase, such as Y3Fe5O12 can also be
found evidently, which may contribute to the increasing of magnetization value, it is consistent with
predictions in reports of Feng et al. [11]. The reports of Hou Zhi-Ling et al. [8] had shown the Y
ions, occupying the lattice sites, resulted in the changes of Fe-O-Fe bond angles which affected the
super exchange Fe-O-Fe interactions. Although the Y-doping element does not contain 4f electrons, a
small amount of doping can induce a strong magnetization [8]. In reports of Luo et al. [24] Bi1.04xYxFeO3 (0.00 < x < 0.30) ceramics were synthesized by method, results showed that with x < 0.20
remnant magnetization and saturate magnetization have no significant changes. With increasing x up
to 0.30, a clear hysteresis loop can be observed, indicating the ferromagnetic properties. The saturate
magnetization (Ms = 0.31 emu/g) of Bi0.74Y0.30FeO3 increases significantly compared to those values
of BiFeO3 and has been attributed to structural transition from rhombohedral (R3c) to orthorhombic
(Pnma) [24]. The difference in our report, with increasing x up 0.20 no structural transition, the
saturate magnetization (Ms = 0.349 emu/g). This results are good for the application of Y-doped
BiFeO3 materials. For Y-substitution can improve the saturation magnetization so much should be
discussed more and another effective analytical method should be introduced to assist.
4. Conclusion
We have successfully fabricated the Bi1-xYxFeO3 materials with different Y doping concentration
in the range from x = 0.00 to 0.20 by sol-gel method. The presence of BiFeO3 rhombohedral phase in
cell parameters a and c
all the samples was confirmed by XRD results. The values of unit
were found to decrease with increase in Y-doping. Crystallite size, which was in agreement
with the XRD results, decreases as Y-doing is increased. The optical band gap of Bi1−xYxFeO3
samples deduced from the UV–vis spectra decrease with increasing Y-content. Magnetic analysis
reveals ferromagnetic nature of all samples at room temperature. The remanent magnetization and the
D.V. Thang et al. / VNU Journal of Mathematics-Physics, No. 29, No. 3 (2013) 63-69
69
saturation magnetization increase with increasing Y-doping concentrations. It can be concluded that
the sample with 20% Y-doping has emhanced multiferroic properties with larger magnetization.
Acknowledgement
This work was supported by the National Foundation for Science and Technology Development
(NAFOSTED) of Vietnam and the Research Foundation – Flanders (FWO) of Belgium
(Code.FWO.2011.23). We would like to thank D.M.Thanh for some absorption measurements.
References
[1] W. Eerenstein, N.D. Mathur, and J.F. Scott, Nature 442, (2006) 759 - 765.
[2] K.S. Nalwa, A. Grag, and A. Upadhyaya, Mater. Lett. 62, (2008) 878.
[3] S.T. Zhang, Y. Zhang, M.H. Lu, C.L. Du, Y.F. Chen, Z.G. Liu, Y.Y. Zhu, N.B. Ming, and X. Q. Pan, Appl. Phys.
Lett. Vol. 88, (2006) 162901.
[4] S. R. Das, R. N. P. Choudhary, P. Bhattacharya, R. S. Katiyar, P. Dutta, A. Manivannan, and M. S. Seehra, J.
Appl. Phys. 101, (2007) 034104.
[5] G.L. Yuan, and S.W. Or, J. Appl. Phys. 100, (2006) 024109.
[6] G.L. Yuan, W. Siu, J.M. Liu, and Z.G. Liu, Appl. Phys. Lett. 89, (2006) 052905.
[7] P. Uniyal, and K.L. Yadav, Mater. Lett. 62, (2008) 2858.
[8] Hou Z.L., Zhou H.F., Yuan J., Kang Y.Q., Yang H.J., Jin H.B., and Cao M.S., Chin. Phys. Lett. 28, (2011)
037702.
[9] X. Zhang, Y. Sui, X. Wang, and Y. Wang, J. Alloys Compd. 507, (2010) 157.
[10] J. Xu, G. Wang, H. Wang, D. Ding, and Y. He, Mater. Lett. 63, (2009) 855-857.
[11] Feng B.L., Xue H., and Xiong Z.X., Mater. Sci. 55, (2010) 452−456.
[12] A. Gaur, P. Singh, N. Choudhary, D. Kumar, M. Shariq, K. Singh, N. Kaur, and D. Kaurn, Phys. B406, (2011)
1877–1882.
[13] Singh MK, Jang HM, Ryu S, and Jo MH, Appl. Phys. Lett. 88, (2006) 042907.
[14] H. Fukumura, H. Harima, K. Kisoda, M. Tamada, Y. Noguchi, and M. Miyayama, J. Magn. Magn. Mater. 310,
(2007) 367.
[15] A. Gautam, K. Singh, K. Sen, R.K. Kotnala, and M. Singh, Mater. Lett. 65, (2011) 591-594.
[16]
[17]
[18]
[19]
[20]
[21]
[22]
[23]
[24]
M. Cazayous, D. Malka, D. Lebeugle, and D. Colson, Appl. Phys. Lett., 91, (2007) 071910.
Z. Liu, Y. Qi, and C. Lu, Mater. Electron. 21, (2010) 380 - 384.
J. Wei, D. Xue, and Y. Xu, Scripta Mater. 58, (2008) 45 - 48.
M. Kumar, K.L. Yadav, and G.D. Varma, 2008. Mater. Lett. 62, (2008) 1159 - 1161.
K. Liu, H. Fan, P. Ren, and C. Yang, J. Alloys Compd. 509, (2011) 1901–1905.
A.J. Jacobson, and B.E.F. Fender, J. Phys. C: Solid State Phys. 8, (1975) 844.
S.V. Kiselev, R.P. Ozerov, and G.S. Zhdanov, Sov. Phys. Dokl. 7, (1963) 742.
Mishra R.K., Pradhan D.K., and Choudhary R N.P., J. Phys. Condens Matter. 20, (2008) 045218.
L. Luo, W. Wei, X. Yuan, K. Shen, M. Xu, and Q. Xu, J. Alloys Compd. 540, (2012) 36–38.