DSpace at VNU: Evaluating the User’s Satisfaction of Applying Information System Based on EDUSOFT in Managing Students’ Data at Da Lat University
Bạn đang xem bản rút gọn của tài liệu. Xem và tải ngay bản đầy đủ của tài liệu tại đây (135.57 KB, 8 trang )
VNU Journal of Science: Education Research, Vol. 30, No. 2 (2014) 36-43
DISCUSSION
Evaluating the User’s Satisfaction of Applying Information
System Based on EDUSOFT in Managing Students’ Data
at Đà Lạt University
Phan Thanh Đồng*
*
Faculty of Pedagogy, Dalat University,
No.1 Phù Đổng Thiên Vương, Đà Lạt, Lâm Đồng, Vietnam
Received 24 March 2014
Revised 15 May 2014; Accepted 25 Jun 2014
Abstract: In recent years, in Vietnam the application of the Information Systems (IS) has become
increasingly important in the educational management, especially in the secondary schools as well
as in the universities and the management of students’ data. The user’s satisfaction is an
indispensable element in the use of the IS in an effective way in the educational institutions. This
article assesses the degree of the user’s satisfaction with the IS based on the EDUSOFT
information system currently applied at Dalat University to manage students’ data. By the
quantitative study method with the successful model via 270 staff members and students, it is
possible to see the satisfaction degree towards the use of the IS in data management. The study
results show that all the factors under examination in this study including system quality,
information quality, service quality, and quality of LAN network have positive impact on the
user’s satisfaction.
Keywords: Information system, the user satisfaction, Information system in education, EDUSOFT, IS
Success Model, DaLat University.
1. Introduction *
(1993) also indicated that electronic computers
and related software programs are the technical
foundation, the tools and materials, and the
modern information systems.
Information system (IS), according to Laudon
and Laudon (1993), as "a set of procedures that
collects, processes, stores, and disseminates
information to support decision making and
control". In most cases, information systems are
formal computer-based systems that play an
integral role in organizations. Laudon and Laudon
The evidence in Vietnam shows that
information system data has played a
significant role in supporting the planning
process and the process of decentralization
process have become more committed to
support localized information system. As a
result, many educational organizations are using
data to prepare education plans and develop
_______
*
Tel.: 84-983840978
Email:
36
P.T. Đồng / VNU Journal of Science: Education Research, Vol. 30, No. 2 (2014) 36-43
their budgets. Educational institutions, besides
using information system to support decision
making, coordination, and control, also help
teachers, staff and students search necessary
information, especially in analyzing and
managing students’ data.
Information system has kept an effective
role in managing students' data at the University
of Dalat. With the slogan “To change is to
survive”, universities in Vietnam manage to
build their strategies for responding to
challenges. Consequently, staff at these
institutions must train themselves, know how to
operate, perform comprehensive cooperation
between employees, help each other in their
work, and share necessary data and experiences.
EDUSOFT, the information system currently
applied at Dalat University, has shown its
usefulness for both staff and students in getting
necessary information from the database. The
systems can help the staff to access all students’
data quickly. Students can also use the
information system to perform their course
registration every semester, and know their
tuition fees, studying results and even their
weekly timetable. To meet its demands, the
number of computers at the University of Dalat
has newly installed year by year. All students’
data has been transformed into the information
system by the information processor.
Since applying information system in 1994,
the University of Dalat has stored all its
students’ data into the system so managers and
staff can manage students more effectively. Up
to now there hasn’t been any evaluation to
users’ satisfaction with the information system,
so this study can help to understand staff and
students’ feelings, desires and expectations in
the currently applied information system.This
also helps to improve working and studying
quality through managing students’ data at the
University of Dalat.
Tolley and Shulruf (2009) stated that most
schools,
universities
and
educational
37
organizations across the world collect data in
some form or another; however,others agree
that few of them effectively utilize their data to
improve the quality of education. Hua and
Herstein (2003) argued that a successful
information system can powerfully highlight
the interdependencies that exist within different
elements of the education system as well as
between education and other sectors of society.
Universities’ data occur in many forms such as
student records which include demographic
data, achievement, behavior and attendance
data, students’ CV, course registration, tuition
fees, curricular materials, lesson plans;
programmers’ data; administrative and financial
records, human resource management, and so
on. These kinds of data used to be manually
stored in many locations using a variety of
storage methods including handwritten notes in
teachers’ workbooks. Collecting and organizing
such an array of data show several complex
challenges for school management councils
intending to address the application of data to
decision-making processes.
According to Deleon and McLean (1992),
user satisfaction is a key measure of computer
system success. They consist of lists of factors.
Respondents were asked to rate on one or more
multiple point scales of every variables. Deleon
and McLean discovered that the items that their
informants rated as the most importance include
accuracy, reliability, timeliness, relevancy and
confidence in the system. The factors of least
importance were feelings of control, volume of
output,
vendor
support,
degree
of
training,organizational position of the electronic
data processing, or computing department.
2. Research method
This study applied DeLone and McLean IS
Success Model (1992, The D&M IS Success
Model) extensively proposing the six
38
P.T. Đồng / VNU Journal of Science: Education Research, Vol. 30, No. 2 (2014) 36-43
dimensions of IS success. These include system
quality, information quality, user satisfaction,
IS use, individual impact and organizational
impact. The D&M IS Success Model is based
on the communications and the information
influence theory of the previous researchers.
Information Quality: this component
isused to evaluate content variety, complete
information,
detail
information,
timely
information on managing students’ data. The
variables of this component concern
Information Quality. Information Quality
measures are items assessing ease of use and
user friendliness following Larcker and
Lessig(1980)’s guidelinesin developingthe sixquestionnaire items to measure the perceived
importance and information utility.
System Quality: specific measures
concerning the use of IS in managing students
are added to evaluate technical support as a
component of System Quality. They are good
design, easy to use, response times are the sub
factors used for measuring System Quality.
Hamilton and Chervany (1981) proposed data
currency, response time, turnaround time, data
accuracy, reliability, completeness, system
flexibility, and ease of use among others as part
of a "formative evaluation" scheme to measure
system quality.
In measuring Service Quality, all kind of
support offered to users is emphasized to adopt
the measures to be used in managing students’
data and focused on support given by the
experts and students. Variables of service
quality
measure
informationsearching,
confidentiality and suitability.
Local Area Network (LAN) is a computer
network connecting computers and devices in a
limited geographical area such as home, school,
university, computer laboratory, office, etc.
LANs may have connections with other LANs
via leased lines, leased services, or by tunneling
across the Internet using virtual private network
technologies. Quality of LAN is very important
for experts and especially for students who use
IS for working and studying.
User Satisfaction: User Satisfaction is seen
as staff and students’ attitude towards managing
students’ data. The respondents are generally
satisfied with the IS in managing students’ data.
They have enjoyable experience when using the
IS and this indicates that the application of IS is
successful. According to Doll and Torkzadeh
(1988), user satisfaction is defined as the
attitude of the users towards a specific
computer application.
Quantitative research approaches with the
survey questionnaires are employed in this
study. The survey questionnaires, after
designing, were tested for their content validity
and reliability. Eighteen administrative staff and
students from several different departments at
University of Dalat were asked to check the
content of the questionnaire to see whether they
are appropriate.
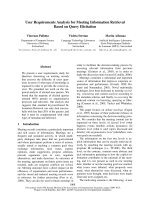
As the study attempts to evaluate four
dimensions of fairness and quality influencing
the user satisfaction with IS, the basic
assumption is that user satisfaction is
determined by systems quality, service quality,
information quality and quality of LAN. Figure
1 states the theoretical model proposed to
address this issue.
System quality in the information system
measures the desired characteristics of online
community including system reliability,
convenient access, ease of use and system
flexibility. These variables indicate the system
qualities valued by online community members.
Information
quality
measures
online
community output, includes information
accuracy, timeliness, usefulness, completeness
and customized information presentation.
Service Quality represents overall user
assessment and service delivery assessment in
the virtual marketplace.
P.T. Đồng / VNU Journal of Science: Education Research, Vol. 30, No. 2 (2014) 36-43
39
f
Figure 1. Research Model - An Revised IS Success Model.
The hypotheses tested in this study are:
H1: There is a positive relationship between
system quality of EDUSOFT and the user
satisfaction in managing students’ data.
H2: There is a positive relationship between
system service quality of EDUSOFT and the
user satisfaction in managing students’ data.
H3: There is a positive relationship between
information quality of EDUSOFT and the user
satisfaction in managing students’ data.
H4: There is a positive relationship between
quality of LAN and user satisfaction in
managing students’ data.
The survey questionnaires applied in this study
were adapted from the review of literature based on
the objectives of the researchshown in Table 1.
Table 1: Variables and their measurement items
Variables
System
quality
Information
Quality
Service
Quality
•
Measures
Design
•
Easy to use
•
Help students
•
Help staff
•
•
•
•
•
•
•
•
•
Response time
Content variety
Complete information
Detail information
Timely information
Up-to-date
Searching Information
Confidentiality
Suitability
Questions
SQ1: The designed system (currently, appropriately) has
impact to students use of credit selecting and accumulating.
SQ2: The designed system (appropriately, currently) is easyto- use.
SQ3: The EDUSOFT can help students in course registration
and in paying tuition fees.
SQ4: The EDUSOFT can help staff in managing students’
marks.
SQ5: The EDUSOFT can help to provide quick response.
IQ1:
IQ2:
IQ3:
IQ4:
IQ5:
The EDUSOFT provides content variety.
The EDUSOFT provides complete information.
The EDUSOFT provides detailed information.
The EDUSOFT provides timely information.
The system information is up-to-date regularly.
SSQ1: The EDUSOFT can help to search for information.
SSQ2: The EDUSOFT can help to keep confidentiality.
SSQ3: The EDUSOFT is suitable with user.
P.T. Đồng / VNU Journal of Science: Education Research, Vol. 30, No. 2 (2014) 36-43
40
Quality of transmittance QL1: Quality of transmittance has positive impact to use IS
QL2: Quality of facilities (computers…) has positive impact
Quality of facilities
to use IS
QL3: The connections with other LANs via leased lines across
•
Connections across
Website
on the Internet influences positively to the users
Website on the Internet
satisfaction
US1: Most of users have a positive attitude evaluation towards
•
Positive attitude
the Information System function.
evaluation
•
Satisfied and ready to US2: Most of users are satisfied with the Information System
and they are always ready to use Information System in
use
working or in the learning process.
US3: Most of users believe that using Information System is
•
Useful
useful for all staff and students.
•
•
Quality of
LAN
Users
Satisfaction
f
3. Data analysis
The survey yielded 270 responses, among
them, 250 were usable for analysis representing
a response rate of 92.5 percent. The personal
characteristics of sample are detailed in Table 2
representingthe number of administrative staff
and students at University of Dalat using IS for
their working or studying.
Tablet 2: Sample profile
Measure
Gender
Age
Position
Majors at University
Item
Male
Female
From 18 to 25
From 25 to 40
Over 40
Staff
Student
IT
Natural science
Social sciences & humanities
Others
Frequency
96
154
174
65
11
70
180
40
62
101
47
Percentage (%)
38.4
61.6
69.6
26.0
4.4
28.0
72.0
16.0
24.8
40.4
18.8
d
For
the
descriptive
statistics
on
measurement items, the criteria forsystem
quality assessment are through the Information
System SQ1, SQ2, SQ3, SQ4, SQ5. The user
satisfaction on the system quality component is
relatively high with the average scores from
3.53 to 3.65 on 5-point Likert scale items. The
standard deviation is in a range from 0.829 to
0.878 which is acceptable.
The criteria for assessing information
quality by indicators IQ1, IQ2, IQ3, IQ4, IQ5
have shown its average score from 3.54 to 3.60
on 5-point Likert scale items which indicate the
relative satisfaction. Standard deviation values
are from 0.866 to 0.960. This means the highest
value is 0.960 for the difference between the
highest point and the lowest point of the
participant.
The criteria for assessing service quality of
the information system shown by indicators
SSQ1, SSQ2, SSQ3 are also at high average
score with the lowest at 3.73 points on 5-point
Likert scale items, which indicate that the users
are generally satisfied with the service quality.
The standard deviations of these variablescome
P.T. Đồng / VNU Journal of Science: Education Research, Vol. 30, No. 2 (2014) 36-43
41
from 0.795 to 0.831 indicating an acceptable
difference in the rating of the informants.
could be seen as measuring the same construct
and the structure is highly reliable.
The criteria for quality assessment system
through the Quality of LAN: QL1, QL2, QL3
are relatively high with average scores from
3.51 to 3.60 on 5-point Likert scale items.
Standard deviationsare from 0.872 to 0.915
which is generally good.
Hypothesis test: In this study, using
regression analysis to examine the relationship
between independent variables and dependent
variable aims to test the hypothesis of our
research.
Factor analysis was used to determine the
structure of the relationship between the
responses by examining the correlation between
the answers. With factor analysis, we can
determine the specific size of the structure and
then determine the extent to which each
variable is explained by size.Once the size and
explanation of each variable is determined, we
can reduce the synthesis and processing data.
According to Hair et al. (1998)a target is an
important factor if the load is greater than 0.5.
In the result of the research all 19 targets have
their load factor > 0.5 so we see that the effect
of construction and structural indicators of
these factors will ensure the validity and high
reliability.
4. Findings
To check the reliability of the structure of
the targets, to ensure that the measurement scale
for the design of our questions was appreciated
and it is representative of each variable, using
Cronbach α. And these are the results: System
Quality: 0.737, System Service Quality: 0.723,
Information Quality: 0.783, Quality of LAN:
0.712, User Satisfaction: 0.716. Therefore all of
the values of Cronbach showed a value above
the threshold point of 0.7. It means that the
building the five averaging constructs from the
19 original items is acceptable (Hair et al.,
1998). In other words, the items in each group
In the correlation model linear regression to
test H1 hypothesis of research at the test, user
satisfaction is the dependent variable and systems
quality is the independent variables. Model is:
US = b0 +b1* SQ =>
0.448*SQ
US = 3.160 +
In the correlation model linear regression to
test H2 hypothesis of research at the test, user
satisfaction is the dependent variable and
systems service quality is the independent
variables. Model is:
US = b0 +b1* SSQ => US = 0.995*SSQ
In the correlation model linear regression to
test H3 hypothesis of research at the test, user
satisfaction is the dependent variable and
information quality is the independent
variables. Model is:
US = b0 +b1* IQ =>
0.453*IQ
US = 3.170 +
In the correlation model linear
regression to test H4 hypothesis of research
at the test, user satisfaction is the dependent
variable and quality of LAN is the
independent variables. Model is:
US = b0 +b1* LQ =>
0.724*LQ
US = 3.511 +
With the significancelevel is under 0.05, the
hypotheses H1, H2, H3 and H4 were accepted
and all factors namely system quality,
information quality, service quality and quality
of LAN have positive impact to the user
satisfaction shown inTable 3.
P.T. Đồng / VNU Journal of Science: Education Research, Vol. 30, No. 2 (2014) 36-43
42
Table 3: Testing results of hypotheses by regression analys
Construct
Unstandardized
coefficients β
Standardized
coefficients β
t value
R2
Adjust
R2
F value
System Quality
0.448***
0.681***
14.634
0.463
0.461
214.158***
Information Quality
Service Quality
Quality of LAN
0.453***
0.995***
0.724***
0.766***
0.995***
0.799***
18.779
154.475
19.594
0.587
0.990
0.608
0.585
0.990
0.606
352.655***
23862.642***
383.930***
***P < 0.001
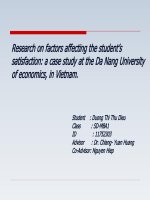
5. Conclusion and implication
The study attempts to examine the user
satisfaction of EDUSOFT information system
appliedto manage students’ data at the
University of Dalat via exploring the factors
contributing to users’ satisfaction with the
information system and applying IS success
model. The findings show that all the factors
including
system
quality,
information
quality,service quality, and quality of LAN
have positive impact to the user satisfaction
indicated in Figure 2. Furthermore, the research
findings accepted the four hypotheses proposed
regarding the positive attitude of users towards
the system quality, information quality, service
quality, and quality of LAN.
j
Figure 2: Summary of Estimation Results by Regression Analysis.
Therefore, research result is one of special
interest for academic administrative managers,
professional training management staffs who
are experiencing and supporting to institution to
accepting a newly way to use IS in managing
data, more over there showed that IS support
organizations satisfactions to users (staff or
students) and technology
business are approved.
satisfactions
to
This study can help to understand staff and
students’ feelings, desires and expectations in
the information system currently applied at the
University of Dalat. Improving user satisfaction
will bring benefits to staff, students, and the
P.T. Đồng / VNU Journal of Science: Education Research, Vol. 30, No. 2 (2014) 36-43
working environment of the university. It helps
to build a more effective andfriendly working
environment. This helps to improve working
and studying quality through managing
students’ data.
[5]
Reference
[6]
[1]
[2]
[3]
[4]
DeLone, W. H., & McLean, E. R, Information
systems success: the quest for the dependent
variable, Information systems research, 3(1),
(1992) 60.
DeLone, W.H., and Mclean, E.R, “The DeLone
and McLean Model of Information Systems
Success: A Ten-Year Update”, Journal of
Mantif, (2003) 9.
Doll, W.J., and Torkzadeh, G., “Developing a
multidimensional measure of systems use in an
organizational context”, Information SL
Management, (1998) 171.
Hamilton. S and Chervany. N. L, “Evaluating
Information System Effectiveness - Part I:
[7]
[8]
[9]
43
Comparing Evaluation Approaches”, MIS
Quarterly, Vol. 5, No. 3, (1981) 55.
Hua, H., and Herstein, J. “Education
management information system (EMIS):
Integrated data and information systems and
their implications in educational management”.
Paper presented at the annual conference of
comparative and International Education
Society, 2003.
Laudon, Kenneth C., and Laudon J.P.
Management
Information
Systems:
A
Contemporary Perspective. 2nd ed. New York:
Macmillan, 1991.
Larcker, D.F. and Lessig, V.P. “Perceived
usefulness of information: a psychometric
examination”, Decision Science, (1980) 121.
Tolley. H, and Shulruf. B. “From data to
knowledge: The interaction between data
management systems in educational institutions
and the delivery of quality education”, Computers
& Education, Vol. 53, N. 4 (2009) 1199.
Hair, J. F., Anderson, R. E., Tatham, R. L., &
William, C., Black, W. C., Multivariate data
analysis. Hall; New Jersey, 1998.
Đánh giá sự hài lòng của người sử dụng
về hệ thống thông tin Edusoft trong quản lý dữ liệu sinh viên
ở Trường Đại học Đà Lạt
Phan Thanh Đồng *
Khoa Sư Phạm - Trường Đại học Đà Lạt,
Số 1 Phù Đổng Thiên Vương, Đà Lạt, Lâm Đồng, Việt Nam
Tóm tắt: Ở Việt Nam trong những năm gần ñây, việc ứng dụng hệ thống thông tin trong quản lý
giáo dục, ñặc biệt ở các trường phổ thông cũng như các trường ñại học việc quản lý dữ liệu của học
sinh, sinh viên ñã trở nên ngày càng quan trọng. Sự hài lòng của người sử dụng là một yếu tố không
thể thiếu trong việc ứng dụng hệ thống thông tin một cách có hiệu quả ở các tổ chức giáo dục. Bài viết
này ñánh giá mức ñộ hài lòng của người sử dụng về hệ thống thông tin dựa trên hệ thống EDUSOFT
ñã ñược ứng dụng trong việc quản lý dữ liệu sinh viên tại Trường Đại học Đà Lạt. Bằng phương pháp
nghiên cứu ñịnh lượng với mô hình thành công qua 270 nhân viên và sinh viên ñể xem xét mức ñộ hài lòng
ñối với việc sử dụng hệ thống thông tin trong quản lý dữ liệu. Các kết quả nghiên cứu cho thấy rằng tất cả
các yếu tố xem xét trong nghiên cứu này bao gồm chất lượng hệ thống, chất lượng thông tin, chất lượng
dịch vụ và chất lượng của mạng LAN có tác ñộng tích cực ñến sự hài lòng của người sử dụng.
Từ khóa: Hệ thống thông tin, sự hài lòng của người sử dụng, hệ thống thông tin trong giáo dục,
EDUSOFT, mô hình thành công hệ thống thông tin, Trường Đại học Đà Lạt.