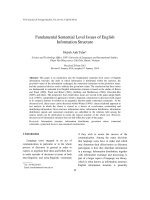
DSpace at VNU: 3-D finite element modeling of SAW sensing system for liquids
Bạn đang xem bản rút gọn của tài liệu. Xem và tải ngay bản đầy đủ của tài liệu tại đây (2.29 MB, 6 trang )
The 2012 IEEE/ASME International Conference on
Advanced Intelligent Mechatronics
July 11-14, 2012, Kaohsiung, Taiwan
3-D Finite Element Modeling of SAW sensing system for liquids
Thu-Hang Bui, Dat Nguyen Tien, Tung Bui Duc, and Trinh Chu Duc
ua qu
Abstract—Like emerging devices, surface acoustic wave
(SAW) sensors received considerable interest towards their
integration within lab-on-chip and microfluidic structures.
Rayleigh wave sensors are highly sensitive in detecting
properties of gas in contact with their surface including mass
change, viscosity, density, velocity and electrical conductivity.
In this paper, primarily, a novel structure of Rayleigh surface
acoustic wave (R-SAW) sensors for charactering a liquid is
presented and sensitivities of the different liquids deposited in
the well are compared. The fundamentals of the sensing system
using R-SAW sensor on X-cut, Y-propagation Lithium Niobate
substrate are described. The numerical simulation results of the
wave propagation indicated the important role of the fluid
density whereas the viscosity influence is very low.
Keywords: Acoustic wave sensor, SAW sensor, R-SAW
sensor.
I. INTRODUCTION
I
N the recent years, acoustic wave devices are used in a
wide applications as resonators, filters, actuators and
especially sensors. There are several types of acoustic wave
sensors depending on vibrations, wave modes and sensed
objects. Based on the mechanism detecting the mechanical
and electrical perturbations, current sensing systems sense
density, viscosity products, conductivity and dielectric
constant of liquid [1]. Therefore, they have the potential to
be used in fields such as military, automotive, industrial and
environmental, food industry, medical science, meteorology
and specially biosensor applications.
In 1887, Lord Rayleigh discovered propagation modes,
properties of the surface acoustic waves which was named
Rayleigh surface acoustic wave [2]. R-SAWs have
longitudinal and vertical shear components propagating in
the surface piezoelectric substrate. This coupling strongly
affects the amplitude and velocity of the wave. The feature
enables to directly sense mass and mechanical properties.
The surface motion also allows the devices to be used as
microactuators. So, for gas sensors, R-SAW devices are
usually utilized and very sensitivity to mechanical and
electrical perturbations occurring on the surface. For
mechanical properties, they are sensitive to mass loading and
viscosity-elastic changes like stiffening and softening. For
electrical properties, the devices can be suitable for any
property that interacts with the electrical field when it is
Manuscript received January 15 rd, 2012
Authors are with the Department of MicroElectroMechanical Systems
and Microsystems, Faculty of Electronics and Telecommunications,
University of Engineering and Technology, Vietnam National University,
Hanoi, Vietnam.
T. Chu Duc also is with Nano and Energy Center, Vietnam National
University, Hanoi, Vietnam. (corresponding author to provide phone: +84 4
3754 9338; fax: +84 4 7547460; e-mail: trinhcd@ vnu.edu.vn).
978-1-4673-2576-9/12/$31.00 ©2012 IEEE
coupled to the propagating acoustic wave. This effect is
known as the term electro-acoustic interactions. However,
for liquid phase applications, most acoustic sensors were
proposed using the shear horizontal acoustic plate mode
(SH-APM), the thickness-shear mode (TSM), the Lamb
wave or the flexural plate wave (FPW) and Love wave
instead of Rayleigh wave [3]. Because when SAWs are in
contact with the liquid, leaky SAWs, which are converted
from SAW, are excited and consequently its energy radiates
into liquid. On the other hand, because of surface-normal
waves, they cause an excessive attenuation of the surface
waves in the liquid [4]. It is difficult to realize a liquid-phase
by the Rayleigh wave devices when liquid is put on the
piezoelectric. However, one advantage of these devices is
that Rayleigh waves can readily radiate a longitudinal wave
in contact between the piezoelectric substrate and liquid.
This mode conversation can be utilized for generation and
detection of underwater longitudinal waves.
This work proposes a novel structure for the liquid sensing
applications based on Rayleigh waves. The attenuation and
delay of R-SAWs in the liquid sensing system is
investigated. In addition, the fundamental characteristics of
R-SAW sensors are reported.
II. FUNDAMENTALS OF RAYLEIGH WAVES
(a)
(b)
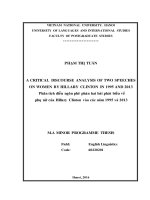
Figure 1. (a) The structure of a SAW sensing system for liquid
(b) Ultrasonic radiation into water by SAW.
As an alternating electrical signal is applied in the input
Interdigital Transducer (IDT), SAW, a mechanic wave, can
be generated and travel across the piezoelectric surface. It
can be picked up and converted back into electrical signal at
output IDT placed in the wave propagation path. When
782
Rayleigh wave propagates on the piezoelectric crystal
surface, it is influenced by perturbation from physical and
chemical changes at the surface or the adjacent medium as
shown in Figure 1a. The existence fluid medium between the
two IDTs will cause certain amount of wave attenuation and
delay.
It is assumed that there exists a liquid medium positioning
in the propagation path. When SAWs propagate along the
boundary between the solid and liquid medium, leaky waves
appear and excite the longitudinal waves into liquid at
Rayleigh angle R. Figure 1b shows ultrasonic radiation
mechanism. Surface waves are assumed to travel in the X1
direction along the surface whose normal is in the X2
direction. The particle displacement and potential are
considered to be independent of the X3 coordinate.
Travelling wave solutions can be calculated by extending
the method of Campell and Jones in the solid–liquid
structure [5]. Hence, travelling wave solutions can be put in
the following form:
(1)
where
is the particle displacement,
the fluid, k = / is the wave number,
is the potential of
is the velocity of
is the decay constant of the wave
the wave,
in the X2 direction and
is the relation
coefficient. f is the fluid density and cf is the elastic
constant of the fluid.
The fluid viscosity is ignored in Eq. (1). Following the Eq.
(1), these surface waveforms depend on the liquid density.
Hence, with different materials, the amplitude and phase of
particle displacement of leaky wave are changed.
III. SENSING SYSTEM
In this section, we focus on the R-SAW sensor
configuration on X-cut, Y-propagation Lithium Niobate
substrate and the measurement method.
A. Sensor configuration
The R-SAW liquid sensing system consists of two
channels: a reference channel (Channel 1) and a sensing
channel (Channel 2). Figure 2 shows the top view and crosssection of the R-SAW sensor. IDTs for input and output are
covered by aluminum. Changes in attenuation and velocity
of surface acoustic waves depend on the square of the
electromechanical coupling coefficient of substrate, K2, thus
Lithium Niobate is approximate substrate to choose [2].
Therefore, the wave propagation path is sheltered by X-cut
Y-propagation Lithium Niobate. The well pierces through
the centre of the Channel 2. Sample liquids are poured onto
well.
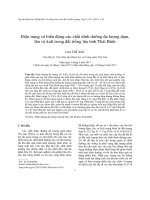
Figure 2. Schematic illustration of two-channel R-SAW sensor and
liquid well position.
Channels are constructed so that the sensor can
simultaneously measure the changeable electrical and
mechanical properties of sample liquids. The density
products are obtained from the differential phase shift
between the reference channel and the sensing channel and
amplitudes of both channels are detected.
B. Materials and Design of System
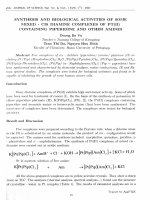
Design parameters of Channel 2 are as follows in Figure 3.
Each channel includes two-port and a delay line. The
substrate was made of piezoelectric Lithium Niobate
material in class 3m symmetry. The stiffness, piezoelectric
constant and permittivity of material are shown fully in the
appendix. To build a 3D model of X-cut and Y-propagation
Lithium Niobate substrate, a 3D domain of size 240 µm
along X-axis, 120 µm along Y-axis and 30 µm along Z-axis
is created. There are two IDTs added on the top of this
piezoelectric substrate. Each of these IDTs has two pairs of
interdigitated fingers with each finger being 10 μm wide and
100 μm long. A long spacing which is present between the
neighboring fingers is 10 μm. The aperture of IDT (W) is 82
μm. The SAW velocity is found from V = f0 where the
transducers period or the acoustic wavelength is 40 µm.
According to the literature, the velocity of acoustic wave
propagation in an X-Y Lithium Niobate substrate is about
3485 m/s [12]. The interaction length of the particle
displacement (L) between the input and output IDT was 80
μm. Using this velocity number, the estimated minimum
time for the acoustic wave to propagate the specified
distance between the input and output IDTs in the model is
23 ns.
783
Figure 3. Design parameters of Channel 2 and well size
For the surface acoustic wave delay path, a cylinder well
with a diameter of 20 µm and height 30 µm is placed in the
center of delay line between input and output IDTs. The
used liquids are classified into two groups: Group 1
including deionized water, water/glycerol mixtures (W/G),
and Group 2 consisting of propylene, bromine and mercury
which physical properties at 20 0C are given in Table 1 [15].
Glycerol percent weight was from 50 to 70 to increase the
viscosity by a factor of up to 11, whereas the density stayed
close to that of water. The density of bromine and mercury is
much higher than that of propylene.
(a)
TABLE I
PHYSICAL PROPERTIES OF LIQUID
Liquid
Water
W/G. mix 1
W/G. mix 2
Propylene
Bromine
Mercury
Viscosity
(mm2/s)
1.00
5.6
11.50
0.09
0.31
1.55
Density
(g/cm3)
1.00
1.126
1.161
0.514
3.123
13.579
After building this first model, a second model of the
Channel 1 with the same dimensions is created. An electrical
potential in the form of a sinusoidal wave was applied to two
of the fingers (alternate ones) of the input IDT, while the
other two fingers were grounded.
The piezoelectric surfaces of the developed models were
meshed with maximum element size of 11.2 µm and the IDT
boundaries were meshed with a maximum element size of
6.4 μm. These parameters provided a much denser mesh at
the top of the model which is essential to achieve a high
accuracy in simulating the SAW propagation.
A sinusoidal voltage 10 V of frequency 100 MHz is
applied to the input IDT to generate the needed SAWs. The
output voltages in both cases were acquired at the alternating
fingers of the output IDT.
(b)
Figure 5. (a) Point positions and (b) Total displacement of point
groups before and after well of the 3D SAW model.
IV. RESULTS AND DISCUSSION
A. Corresponding point comparison in two channels
Figure 6. Total displacement of corresponding points in two
channels.
Figure 4. Total displacement of corresponding points in two
channels.
Figure 7. Total displacement of corresponding points in Channel 1
and Channel 2 with doubled well diameter.
784
In the first stage of the simulation, two R-SAW channels
were run within 130 nsec and a time step is 0.09 nsec. The
contour plot for the total particle displacement of two
channels was shown in Figure 4. The fluid well which was
deposited in the delay path of the device resulted in a
perturbation.
Figure 5 illustrates the contour plot for the particle
displacement of two point groups placed before and after the
well. Each group includes a well closely neighboring point X
and a point Y on the boundary of liquid–solid medium.
Distance between two points of each group is 1 µm.
The amplitude and phase variance of these explored pairs
of points are not shifted. Consequently, instead of
investigating adjacent points on the piezoelectric surface, it
is possible to choose points in the boundary between the
liquid and solid medium.
To obverse clearly displacement changes, two points with
the corresponding positions in the two channels are
compared and shown in Figure 6. A solid line shows
displacement of the point behind the well of Channel 2 and a
dashed line illustrates that of the corresponding point of
Channel 1. Attenuation of R-SAW was observed as a result
of propagating across the liquid medium. As the distance
which waves were propagated is too short, it is difficult to
detect its phase shift. Hence, the well diameter was increased
from 20 µm to 40 µm as following in Figure 7.
However, the size of well can not be too large for
achieving large enough signals in the output of SAW device
due to the decay constant of Lithium Niobate is lower than
that of liquid.
(a)
(b)
B. Sensing different liquid in well
(c)
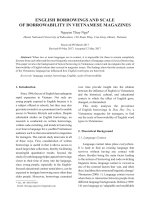
Figure 9. Output voltage of Group 1 from the 3-D SAW model with
and without deposited well from 0 to 130 nsec.
(a) Water well, (b) W/G. mix 1 well and (c) W/G. mix 2 well
Figure 8. Total displacement of the well behind points with three
liquid types.
The total displacements of points placed in the liquid–
solid boundary in all three cases of two groups in Figure 8
were plotted. The solid line illustrates that of water, the
dashed line is for that of water/glycerol mixtures 2 in the
Group 1 and the dash-dot line is for that of bromine in the
Group 2.
The output voltages in all cases obtained at the alternating
fingers of the output IDT were plotted as functions of time
as shown in Figures 9 and 10. To determine the delay value
between output voltages, one of the time delay estimation
(TDE) methods which is commonly used is a cross
covariance [17]. It is normalized by the root of the autocovariance and based on the estimation of the time lag at
which the cross-correlation function (CCF) estimation
reaches its maximum value [18]. Therefore, as compared to
the device without well, a time delay of 0.09 nsec was
calculated as a result of water and that of 1.08 nsec was for
the W/G. mix 2 well whereas that of bromine was 2.16 nsec.
Comparing the output voltages and the total displacements
of the channels containing water, W/G. mix 1 and W/G. mix
2 well, it can be seen that Rayleigh wave was less influenced
by the viscosity of material although their densities are
approximately the same. As a result, the influence of
viscosity can be dropped from the equation of travelling
solution of waveform. To the contrary, it was affected much
by the density. Moreover, when the density material is low,
the needed time for acoustic wave propagating the distance
785
the benefit of positioning the liquid well in the middle of the
two-port SAW delay-line device for enhancing liquid
sensing capacity. This study provides a strong meaning for
manufacturing and designing R-SAW sensor in practice.
APPENDIX
(a)
Material constants for Lithium Niobate piezoelectric class
3m symmetry in simulation:
(b)
where C11 = 20.3×10¹⁰ Nm-2, C33 = 24.5 ×10¹⁰ Nm-2, C44 =
6.0×10¹⁰ Nm-2, C12 = 5.3×10¹⁰ Nm-2, C13 = 7.5×10¹⁰ Nm-2,
C14 = 0.9×10¹⁰ Nm-2, e15 = 3.7 Cm-2, e22 = 2.5 Cm-2, e31 = 0.2
Cm-2, e33 = 1.3 Cm-2, ε11 = 44, ε33 = 29, and ρ = 4600 Kgm-3.
ACKNOWLEDGMENT
(c)
Figure 10. Output voltage of Group 2 from the 3-D SAW model
with and without deposited well from 0 to 130 nsec.
(a) Propylene well, (b) Bromine well and (c) Mercury well
between input and output IDTs is lower because of the low
phase shift.
As the transverse waves are generated from SAW devices,
noises appear and lead to the inhomogeneous output signals.
In future work, more efficient ways of increasing the mesh
density and the investigation time, restraining noise from
transverse waves as well as decreasing the error tolerance
levels may provide more accurate analysis of the
performance of the SAW sensors.
The authors would like to acknowledge the support of Dr.
Le Quang Hieu of the Faculty of Information Technology,
UET, VNU.
Special thanks are due to Dr. Tran Duc Tan of the Faculty
of Electronics and Telecommunications, UET, VNU and Dr.
Bui Thanh Tung of the National Institute of Advanced
Industrial Science and Technology (AIST), Japan for their
suggestions and discussions.
This work is partly supported by the VNU project
QG.B.11.30 and National Foundation for Science &
Technology Development (Nafosted).
REFERENCES
[1]
[2]
[3]
[4]
V. CONCLUSION
This paper reports a design of the sensing system using
Rayleigh waves for liquid. They are influenced much by the
liquid density whereas the viscosity can be neglected. The
3D finite element analysis was performed to investigate the
performance of R-SAW sensor for liquid. The response of
SAW devices under alternating-current excitation showed
[5]
[6]
786
J. Kondoh, Y. Okiyama, S. Mikuni and Y. Matsui, “Development of
SH-SAW sensing system for liquid”, IEEE, 1-4244-0647-1, 2007.
D. S. Ballantine, R. M. White, S. J. Martin, A. J. Ricco and E. T.
Zellers, “Acoustic wave sensors”, Academic Press, 1997.
M. I. Rocha-Gaso, C. March-Iborra, A. Montoya-Baides and A.
Armau-Vices, “Surface generated acoustic wave biosensors for the
detection of pathogens: A review”, Sensors 2009, 9, 5740-5769.
S. Shiokawa, Y. Matsui and T. Moriizumi, “Experimental study on
liquid streaming by SAW”, Jpn. J. Appl. Phys.28, Suppl. 28-1, 126128, 1989.
J. J. Campell and W. R. Jones, “A method for estimating optimal
crystal cuts and propagation directions for excitation of piezoelectric
substrate waves”, IEEE Trans. on Sonics and Ultrasonics, vol. SU-15,
No. 4, 1968.
S. Shiokawa, Y. Matsui and T. Ueda, “Liquid streaming and droplet
formation caused by leaky Rayleigh waves”, IEEE Ultrasonics
Symposium – 643, 1989.
[7]
[8]
[9]
[10]
[11]
[12]
[13]
[14]
[15]
[16]
[17]
[18]
[19]
[20]
N. G. Suraji, “Progation of plate acoustic waves in contact with fluid
medium”, Master dissertation, Faculty of the Graduate School,
Marquette University, 2009.
Y. Jiashi, “An introduction to the theory of piezoelectricity”, Dept.
Engineering Mechanics, University of Nebraska-Lincoln, USA,
eBook ISBN: 0-387-23546-9, , 2005.
S. Shikawa and J. Kondo, “Surface acoustic wave sensor for liquidphase application”, IEEE Ultrasonics Symposium–445, 0-7803-5722,
1999.
W. Richard Smith, H. M. Gerard, J. H. Collins and T. M. Reeder,
“Analysis of Interdigital surface acoustic wave transducers by use of
an equivalent circuit model”, IEEE Tran. on Microwave theory and
Techniques, vol. MIT-17, No. 11, 1969.
J. G. Gualtiei, J. A. Kosinski and A. Ballato, “Piezoelectric materials
for acoustic wave applications”, IEEE Tran. on Ultrasonics,
Ferroelectrics and Frequency control, vol. 41, No. 1, 1994.
K. K. Wong, “Lithium Niobate”, No. 28, INSPEC, 2002.
G. Bu, D. Ciplys and M. S. Shur, “Leaky surface acoustic waves in
single-crystal AlN substrate”, International Journal of High Speed
Electronics and Systems, Vol. 14, No. 3837-846, 2004.
J.C. Andle and J.F. Vetelino, “Acoustic Wave Biosensors”,
Proceedings IEEE Ultrasonics Symposium, pp. 451-460, 1995.
B. E. Poling, J. M. Prausnitz and J. P. O’connell, “The properties of
gases and liquids”, McGRAW-HILL, DOI: 10.1036/0070116822.
J. W. Gardner, et al, “Microsensors MEMS and Smart Devices”, 307325, John Wiley & sons, Inc.. New York, 2002.
J. Semmlow, “Signals and systems for bioengineers”, Elsevier Inc.
ISBN: 978-0-12-384982-3, , 2nd
Edition, 2011.
K. Shin and J. K. Hammond, “Fundamentals of signal processing for
sound and vibration engineers”, John Wiley & Sons Ltd, ISBN-13
978-0470-51188-6, 2008.
COMSOL Multiphysics Reference Guide, Ver 3.5a, 2008.
COMSOL Multiphysics Matlab interface Guide, Ver. 3.5a, 2008.
787