A Social Network Analysis of Face Tracking in News Video
Bạn đang xem bản rút gọn của tài liệu. Xem và tải ngay bản đầy đủ của tài liệu tại đây (1.28 MB, 8 trang )
2015 11th International Conference on Signal-Image Technology & Internet-Based Systems
A Social Network Analysis of Face Tracking in News Videos
Benjamin Renoust
National Institute of Informatics
and JFLI CNRS UMI 3527
Tokyo, Japan
Email:
Thanh Duc Ngo
University of Information Technology
Vietnam National University
Ho Chi Minh City, Vietnam
Email:
Abstract—In the age of data processing, news videos are
rich mines of information. After all, the news are essentially
created to convey information to the public. But can we go
beyond what is directly presented to us and see a wider picture? Many works already focus on what we can discover and
understand from the analysis of years of news broadcasting.
These analysis bring monitoring and understanding of the
activity of public figures, political strategies, explanation and
even prediction of critical media events. Such tools can help
public figures in managing their public image, as well as
support the work of journalists, social scientists and other
media experts. News analysis can be also seen from the lens of
complex systems, gathering many types of entities, attributes
and interactions over time. As many public figures intervene
in different news stories, a first interesting task is to observe
the social interactions between these actors. Towards this
goal, we propose to use video analysis to automatise the
process of constructing social networks directly from news
video archives. In this paper we are introducing a system
deriving multiple social networks from face detections in
news video. We present preliminary results obtained from
analysis of these networks monitoring of the activity of more
than a hundred public figures over a decade of the NHK news
archives.
Keywords-social networks; face detection and tracking;
complex networks; multiplex; dynamic; politics; japan;
I. I NTRODUCTION
In the recent years, the publication of news information
has migrated from the traditional means of newspapers,
radio, and television to the wider audience offered by the
Internet. With the rise of the data-intensive science [1] the
analysis and monitoring of news information has given
birth to the discipline called topic detection and tracking
[2] which aims at segmenting, identifying, and following
information, mainly from raw textual information. News
analysis is now going beyond and image information is
also investigated across all varieties of media [3].
The analysis of news information is key to a wide
variety of tasks, from sociology and journalism to politics
and economy [4]. It could help the comprehension of users
behaviors such as what information a category of users can
be exposed to [5]. It could also bring new quantitative tools
to overcome the limitations of technocratic measures in the
investigation of freedom of information [6]. Even if we
know that media competition can lead to a lower quality
of information [4], we can hope that public broadcasting
services tend to convey an official character, and be a
reliable baseline for social analysis.
Social networks analysis directly delivered from video
content analysis is the contribution of this paper. The
social networks are constructed from face detection and
978-1-4673-9721-6/15 $31.00 © 2015 IEEE
DOI 10.1109/SITIS.2015.30
474474
Duy Dinh Le
and Shin’Ichi Satoh
National Institute of Informatics
Tokyo, Japan
Email:{ledduy, satoh}@nii.ac.jp
tracking of video content from the NHK News 7 broadcast,
and enriched with segmentation and domain knowledge.
After discussing the related works in the next section, we
will present our data in Section III, with characteristics and
preprocessing. Section IV will then present the networks
we have extracted, with insights in Section V. Because
this paper presents preliminary results, we will discuss
our observations and future works in Section VI before
concluding.
II. R ELATED
WORKS
Our system focuses on faces detected in news video,
and new deep learning approaches are very promising: [7]
even reaches better-than-human levels of precision in face
recognition. We use a simpler approach inherited from [8]
but provide face tracking in return.
Many interesting works approache news analysis in a
data intensive way, from text analysis. One of the most
impressive approach on exploiting news data comes from
[9] in which the authors combine news topic threads
and demoscopic information to retrieve videos and generate a new summary video to explain prime ministers’
resignations. An NLP framework is designed in [10] to
characterize news providers, programs, and newsmakers
over many channels. The work from [11] is a notable effort
in creating networks from news data. They generate actoraction-object networks over years of news, with great
potential for building narrations and understanding of a
news landscape.
The relevancy of network modeling for social and
political studies does not need to be proven anymore
[12], and beyond classical metrics [13], networks have
been shown efficient for topics and concept analysis [14]
and multiplex networks have been explored to analyse
news data [15]. Particularly character networks have been
broadly analyzed from literature [16], from TV dramas
[17], and even a website is dedicated to the social analysis
of Game of Thrones [18].
News data has been one main target for visual analytics
applications. Although we do not yet address visualization
in this paper, the following examples are all inspiring
model to orient our analysis. It is brought to help exploring
large trans-media news as in [3] and [19] from which
not only text but also visual information is used. Faces
are also used in the case of [20], which fuses many
criteria and modalities to support user’s exploration of
stories in the corpus, and introduces a network of topics,
similarly to [21]. Analysis derived from large scale data
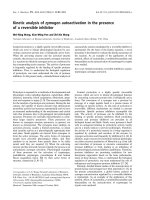
(a) duration per video
(b) #topics per day
(c) topic coverage
(d) gap duration
Figure 1. (a) - Most of the programs dure 30 minutes, but some of them may be longer or shorter due to some events like commemorative dates.
(b) - We average around 13 topics per day. (c) - Topic segmentation is statistically determined, but most of the news are well covered; only a few
topics show large gaps between segmentation (d) so we can expect a good overlap with face tracking.
[22] also includes political figures co-occurrence analysis,
represented as networks.
III. FACE DETECTION AND TRACKING
To understand well the interpretation we can make of
the data, we need to draw an accurate picture of what
we are looking at. This section details all preprocessing
that is done before computing any social network. After
describing the data, we introduce the segmentation of
news, the face detection and tracking, a some domain
knowledge.
A. Description of the data
Our video dataset consists in the daily-collected NIITVRECS archive from [23]. The capture covers a period
between March 17, 2001 and February 27, 2013; of the
4,366-day long period, 4,259 news programs have been
collected cumulating about 2,102 hours (6.7TB of video)
from the NHK channel’s daily News 7 broadcast. The few
missing captures concerning mostly the beginning of the
time period are due to system setup. Most of the programs
usually dure 30mn and only a few of them fall below
or beyond this format (news programs may be shorter
on Sundays, or longer during commemorative events, see
Figure 1(a)).
B. News segmentation
News are specific programs that can be segmented in
different news topics. We thank the authors of [24] for
lending us data in which news topics are derived from
textual information (captions) synchronized with the news.
To summarize the process, a topic boundary corresponds
to a point between sentences where the keyword distribution is distinct between preceding and following windows
of sentences.
As a result, we have a segmentation of the news by
topic, based on semantics analysis (segments in red in Fig.
2-1). Although we do not have the semantic information of
these topics (yet), this gives us time boundaries which will
turn useful for analyzing people’s apparition on screen.
Overall, taking into account the differences of lengths
among programs, this summarizes in a distribution of an
average 13.7 topics per day (σ = 4.3) as illustrated in Fig.
1(b). However, this segmentation implies that topics are
not consecutively segmented, and gaps may occur between
two topic detections. So topic detections cover in average
72.6% of the shows (σ = 0.10), because the beginning
(head news summary) and end of the news (weather
reports) are ignored by the topic segmentation (Fig. 1(c)).
475475
In addition gaps between news topic average 5.1 seconds
(σ = 2.4) and can stretch up to 20,7 seconds (see Fig.
1(d)), in which faces may still be detected. Additionally, a
standard shot segmentation derived from color histograms
thresholds is provided to help the face-tracking process
(segments in blue in Fig. 2-1). This is a contiguous
segmentation, without gap in-between corresponding to
video cut editing.
C. Face-track extraction
Now we can extract faces from the video shots as in
[25], roughly decomposed in the following steps (illustrated in Figure 2, steps 2 to 5):
Detection. We first apply a detection of faces in all
images, using off-the-shelves techniques such as the ViolaJones face detector [8] (available from openCV [26]).
This incidentally results in a feature space describing each
detected face. To reduce the number of false positive
results (detected faces that are not actually faces) we set
the minimum size of a face at 60 × 60 pixels.
Tracking. We now need to group together the detected
faces of a same individual into one single face-track. This
is done with by generating tracking points within detected
faces – a tracking point is a same point identified across
different frames, we generated them using the KLT point
tracker [27]). Tracking points can belong to one detected
face, or to (at least) two faces, or to the background.
Based on a confidence grouping measure, these points are
differentiated and matched from a starting image with the
following image given their temporal order. The process
has also been made robust against distortions such as flash
lights and occlusions [25]. This results in multiple face
instances regrouped in face-tracks. There can be multiple
face-tracks across a same video.
Sampling the face-tracks. For each face-track, we
create a mean face that is a representative face in the
image feature space, based on the k-Faces method [25].
To do so, the face-track is divided in k sub-tracks of
equal size. For each the (temporal) middle face is taken,
altogether forming a set of k-Faces. The mean face is
then a mean point in the feature space described by the
k-Faces. Hence, k influences sampling, with a larger k for
better representativeness (i.e. the average distance between
a mean face representing a face-track and all faces in the
track). To ensure a best quality of the output, we use
k = 20.
Matching the face-tracks. Face-tracks can finally be
matched based on their mean face euclidian distance in
the feature space.
Figure 2. The overall framework of a news video analysis. (1) The video is segmented into topics (red) and shots (blue). (2) Faces are detected in
each frame. (3) Track points are inserted and matched across faces creating tracks. (4) Tracks are sampled and clustered to obtain the final face-tracks
for each individual (5).
The whole process has detected over 30 million faces
and 174,778 face-tracks were extracted. We need now to
identify and recognize groups of face-tracks, and clustering appears as the natural following step. However,
clustering implies many new issues that we have not yet
addressed this work (but we include this goal as par our
our future works section VI). Yet, we can still use a
different approach to construct our networks, that is of
face retrieval.
The faces of 139 characters have been annotated during
the evaluation campaign of [25] giving a ground truth
for retrieving matching face-tracks. These faces are the
faces of well known people among the Japanese media
scene, including celebrities and politicians (Japanese and
international), for which we had the highest precision of
retrieval and identification. In total, over 5 thousands facetracks were annotated, and 16,714 face-tracks of the 139
different characters were retrieved. This corresponds to
2,984 days of news program over the whole archive having
matching persons, covering a total of 36 hours of face
tracks.
The coverage of the face-tracks averages 2.4% of a
program (σ = 2.6), reaching the maximum of 38.9% of
a program. The ground truth has been provided during
the 2010 period, for which the face-tracks appear slightly
denser (3.3% on average). The average screen apparition
per person is 15.7 min (σ = 32.5) but there is a lot
of variation between people (actually it fits a lognormal
distribution Fig. 3(a)), and a few people seem to hold most
of the screen time (Table I).
As a result, the tracks work as follows: everyday, we
have a news broadcast, and every broadcast contains news
segments (topics) and face-tracks of different people. We
then observe an average of 23.8 seconds of cumulated
detections per topics (σ = 28.9, with a maximum of 383.0
- Fig. 3(b)), with in average 1.28 persons detected per topic
(σ = 0.66, with a maximum of 7 - Fig. 3(c)). Thankfully,
this shows that we can reasonably expect people to overlap
across topics, although 80% of our topics do not show
more than one person detected (see Figure 3(c)). Looking
closer at the distribution of inter-day occurrences of people
in topics, we can see that most of them appear on screen
mostly on a daily basis, with bigger gaps then (Fig. 3(d) is
an example). This is sometimes referred as a characteristic
of “bursty” data [28], meaning that over the whole period
of time, the is a lower probability for two persons to be
476476
detected together than by random, making these links very
interesting. We can also notice that most of the people we
are tracking seem to take part in similar topics during the
2008-2011 period.
D. About the 139 persons
Some background information is necessary for a good
understanding of this news data. With a little domain
knowledge, we have classified the 139 characters identified
into 9 categories depending on what brought them under
the light of news: Politics (71), Sports (27), Culture (11),
Business (7), Imperial family (5), Journalism (4), Religion
(3), Law (3), and Other (5). Additionally, we have enriched
them with their country: 96 individuals are from Japan,
among which 39 political figures and 22 athletes.
Incidentally, the Politics class includes 23 international
leaders (presidents, prime ministers...). The Japanese
prime ministers – hereafter referred as PM – governing during the whole period of capture are of course
represented, allowing us to create time frames covering
their cabinet(s). Yoshiro Mori was the first PM in the
timeline, but his mandate only covers a few weeks from
the beginning of the capture, so himself is not included
in the persons subset. Finally, we obtain 11 time periods
(Fig. 9 details them in chronological order, note that
the numbers following a PM’s name represent different
cabinets formed by the same PM). The different time
bar charts we present in this paper reflect these different
periods as colored backgrounds, as for example in the
timelines of the different PM in Figure 5
Although Pearson’s correlations between the three measures (Screentime S, #days D, and #topics T – per person)
are very high (S − D = 0.95, S − T = 0.96, and
D − T = 0.97), we can use the ranking of the top 10
percentile to extract persons of interest (as presented in
Table I).
A background checking gives us supplemental information explaining their occupation of screen space. Out of
the obvious known figures and the aforementioned PM,
I. Ozawa,S. Maehara, K. Shii, and K. Okada are famous
politicians. S. Takeda and S. Nakarai are two presenters
from NHK. T. Horie is a businessman, H. Matsui is a
baseball player, and W. Abe is active on the music scene.
IV. D IFFERENT NETWORKS
In this section we will define and present our different
networks with their preliminary analysis. From this point
(a) Screen time per person
(b) Screen time per topic
(c) #persons per topic
(d) Inter-day distribution of I. Ozawa
Figure 3. (a) - The distribution of screen time per person fits a log-normal distribution and shows a few people actually holds most of the total
screen time.
(b) - Face detections in a topic usually average a total of about 24s. (c) - 80% of the topics detect only one person. (d) - The distribution of time (in
days) between two appearances of I. Ozawa, which is of one day most of the time, is characteristic of the “bursty” behavior of the data.
Figure 4. (Top) The daily track averages 2.4% of a program (line in red)
and shows a bit more coverage during the 2008-2011 period. (Bottom)
Even if a lot of topics detect one person only, the maximum detections
in a topic per day shows many topics going beyond, especially during
the 2008-2011 pperiod.
Figure 5. The different time lines for each of the PM reflects well their
mandate (as presented in the background colors). Notice the differences
in patterns of time apparition for each PM, particularly Y. Noda who
only appeared during his cabinet.
on, we will mostly focus our interpretations on the political
scene, and use the networks as its mean of understanding.
Most of the following networks use the persons as the
same set of nodes, but with different families of ties.
Person
Junichiro KOIZUMI
Yukio HATOYAMA
Ichiro OZAWA
Naoto KAN
Shinichi TAKEDA
Shinzo ABE
Yoshihiko NODA
Taro ASO
Yasuo FUKUDA
Seiji MAEHARA
Takafumi HORIE
George BUSH
Kazuo SHII
Sae NAKARAI
Katsuya OKADA
Hideki MATSUI
Wataru ABE
Screentime
215
179
138
118
110
103
97
87
60
55
52
45
42
40
37
26
22
#Days
516
330
294
243
337
281
195
181
144
116
116
86
116
317
115
126
84
#Topics
523
368
304
249
491
298
245
187
139
126
121
93
98
190
109
73
104
Table I
T HE TOP 10% PEOPLE AMONG THE DIFFERENT CRITERIA ( IN BOLD ,
THE PM S , AND TOP 5 SCORES OF EACH CRITERION ). I CHIRO O ZAWA
IS THE ONLY PERSON TAKING A TOP POSITION WHO HAS NEITHER
BEEN A PM, NOR IS A NEWS PRESENTER .
main connected component of 29/41 (Fig. 6, left). This
connected component is only composed of politicians,
with one business person (M. Shirakawa, connected to
Y. Hatoyama). It’s worth noting that J. Koizumi, the top
individual among all other metrics, only presents here a
degree of 2. Four nodes stand out in terms of betweenness
centrality (S. Abe:0.16, I. Ozawa:0.14, Y. Hatoyama:0.18,
and Y. Noda:0.15, with the rest of the dataset below 0.09),
and 2 nodes in terms of degree (Y. Hatoyama:10 and Y.
Noda:7), however no clear convincing cut of communities
is shown by Louvain’s algorithm [29].
A few links stand out in terms of screen duration (over
1000), connecting: Y. Noda and S. Tanigaki, in 2012, I.
Ozawa and N. Kan in 2003, 2006, and 2010, Y. Hatoyama
and I. Ozawa in 2006, 2010, and 2012, Y. Hatoyama and
B. Obama in 2009, J. Koizumi and Kim Jong Il 2002,
V. Puttin and S. Abe in 2012, T. Aso and Y. Fukuda in
2009. When looking at the number of days in which two
different persons appear together, we can notice stronger
links between: S. Tanigaki and T. Aso in 2006, J. Koizumi
and S. Abe in 2002, and H. Clinton and B. Obama in 2008.
B. Network of people appearing in a same shot
A. Network of people overlapping on screen
Our first network connects two persons when two facetracks overlap in time. This means that we create a
link between two persons when they have been detected
simultaneously on screen. These links are enriched with
the screen duration of the overlapping of tracks as weights.
This network presents 35 nodes and 44 edges, with a
477477
This second family of ties defines links between people
appearing in a same shot (i.e. an uncut segment of video).
This network roughly extends the previous network, with
the difference that people do not need to appear on screen
together. Because shot duration greatly varies depending
on the cut of the video, we cannot use it as a meaningful
metric to weigh edges, instead, we will consider the
Figure 6. The pictures better seen zoomed. Green: politicians,brown: businessmen, yellow: journalists, pink: athletes, purple: imperial family. Circled
in red are world leaders and PM. The size of the node reflects its betweenness centrality. From light yellow to dark orange, the edges color and
width encode their weight. (Left) The network of persons overlapping on screen. (Center) The network of persons appearing on a same shot, with
two communities in the colored areas. (Right) The maximum k-core community (k = 3).
number of different days that include these shots.
The network (Fig. 6, center) presents 49 nodes for 75
edges with a main component of 41/71. The maximum
k-core (k = 3) [30] presents a very intricate subnetwork
of 18 nodes (Fig. 6, right). It includes the PM, and the
main anchorman (S. Takeda), later referred as the ‘main
actors’. All the other nodes are politicians, including I.
Ozawa. Getting their full list and description may go
beyond the scope of this paper, but it is interesting to
notice that N. Yamaguchi stands out as the only politician
not directly connected to any of the PM. The main
component presents a wider range of types of people,
including 3 athletes, 3 business persons, and O. Bin Laden.
A Louvain segmentation does not present a clear cut of
denser subgroups in this network. If we remove the ‘main
actors’, we can interestingly observe two communities
of politicians (the colored areas in Fig. 6, center), one
centered on M. Fukushima and N. Yamaguchi, and the
other one on K. Okada. However one should carefully
interpret the meaning of these links given the low amount
of common shots (at most three).
Three edges stand out with links displaying between
5 and 8 days of connections, T. Aso and S. Tanigaki, N.
Kan and Y. Hatoyama, J. Koizumi and Kim Jong Il. If we
consider links connecting two persons over one day only
as ‘casual’ and discard them, we can reveal a network
of stronger ties of persons with ‘recurrent’ interactions
(23/26). In this network, I. Ozawa displays the highest
betweenness centrality, followed then by the different PM.
C. Networks of people appearing during a same topic
Figure 7. Pictures better seen zoomed. Same encoding as in Fig. 6.
Edge weight corresponds to the number of common topics. (Left) The
network of persons detected during a same topic. (Right) The k-core
(k = 13) of this network.
The following network connects individuals when they
have been detected during a same topic, based on the
478478
segmentation described in Section III-B. This means that
two persons are connected when they took part of a same
media event. The graph connects 107 people over 507
links with a main connected component of 96/499 (Fig. 7,
left). This graph presents characteristics closer to complex
networks with a long tail distribution of node degrees
(actually fitting a lognormal distribution).
Figure 8.
Details readable on zoom. The network derived after
filtering nodes from Fig. 7. Edges width encode the number of common
topics. Red edges represent connections between Japanese and foreign
politicians (otherwise blue). Node scolor correspond to the different
Louvain clusters, from which we notice the Japanese (center in orange)
and the international politicians (top in green). National politicians with
strong ‘foreign’ links are circled in purple, and foreign politicians with
strong ‘national’ links in dark red.
Knowing that co-detection during a news topic is the
reason linking nodes, we should first remove the journalists – occurring a lot in the dataset, in order to focus on
other people’s interactions. The resulting graph presents a
maximal k-core (k = 12) gathering 15 Japanese politicians
and the 7 PM in a subgraph Gk=12 with a density
DGk=12 = 0.79 (Fig. 7, right).
A degree and a centrality analysis will bring focus
to the same people identified in the previous networks.
To go beyond, we will look at the graph without the
‘main actors’, leaving 67 nodes for 221 edges. This graph
clearly presents community structures, and by running a
Louvain algorithm, we obtain a very interesting clustering
result. The two main partitions (in light green and orange
in Fig. 8) clearly present international politicians and
national politicians (respectively). We are now able to
spot the non-PM Japanese politicians who payed an active
role in international matters by highlighting them (circled
in purple in the Fig. 8, mostly at the right frontier of
the orange community). We do so by counting the ratio
by counting the number of their ties with international
representatives and threshold them based on their cumulative probability distribution [31]. As a result, we find
Y. Edano, S. Tanigaki, S. Maehara, M. Fukushima, Y.
Sengoku, I. Ozawa, T. Kanzaki, M. Khomura. With the
same process on the other side, we can identify (circled in
red) Yu Jiang, Jiabao Wen, and Lee Myung-bak as having
redundant apparition on topics with national politicians.
The case of Lee Myung-Bak seems to have particularly
raised a great interest among national politicians, totalizing
5 connections.
D. Time slicing the topic network
Thanks to well defined periods of time corresponding to
PM cabinets, we can use topic segmentation as a support
to observe not the overall network but each slice involving
the persons’ interactions over the different cabinets (Fig.
9).
To compare the political landscapes of each cabinet, we
pick out the top 2 or 3 Japanese politicians in ranking of
centrality and number of topics, who are neither a PM nor
have been detected during the preceding cabinets. We then
scan through all cabinets to verify in which cabinet the
person has been detected or not. As a measure of ‘political
interaction’, we can count the number of topics of each
politician in which they have been detected with others
during the cabinet. In total we have collected 21 prominent
politicians, which will be used to compare cabinets one to
another.
Based on this subset of 21 + 7 PM we can finally
estimate a rough (Jaccard) proximity between cabinets as
shown in Fig. 9(l). The periods from Abe 1 to Noda known
for the series of resigning PM, shows the highest proximity
one to another, and interestingly to Koizumi 1. However,
Koizumi’s two following cabinets appear very different,
suggesting that he set a very different media/politics scene
during this time.
V. S OME OBSERVATIONS
This exploration led us to some understanding of the
media/politics scene presented by NHK News 7. Based
on this data, together with the knowledge we provide,
the different PM stand out like no one else. They can be
directly identified in all aspects of the data: first, purely
quantitatively speaking, they occupy most of the media
scene during their own cabinets; then, in the different networks, they also occupy a very central place; the different
time-related analysis makes it especially obvious during
their cabinets. We also learn by looking at individual PM:
most of them show some level of activity before their
mandate and we can observe two opposite cases. On one
side, Abe is actually more central than Koizumi himself
during Koizumi 3 (Fig. 9(d)). On the other side, Noda came
‘out of nowhere’ before becoming PM (Fig. 5). Despite
of Hatoyama and Aso appearing quite strong nodes in
the different networks, they never appeared on screen
479479
together (Fig. 6) even if they were heading two consecutive
cabinets in period of time where the media/politics scene
of consecutive cabinets is very similar – maybe because
they are the leaders of two opposite parties.
A person by person analysis would be too long to detail
in this paper, but the network exploration allows us to
draw hypothesis on the important figures of the Japanese
media scene at the different periods of time, then enabling
a quick inspection of the individual video segments that
qualify nodes and edges, to get the precise story.
Strikingly, one very particular politician comes out all
along this study, I. Ozawa, who is (in)famously known as
the “Shadow Shogun”. Getting into details into Ozawa’s
role in the Japanese politics is a fascinating work on
its own [32], but put in short, he is known for all the
connections and roles he has played behind the scene,
building alliances and often changing side – although
never he became PM. To delve into this kind of details, the
domain knowledge should be more precise, e.g. encoding
the politicians’ affiliations at time t. Nevertheless, we
cannot get pass the fact that Ozawa is utterly present in
the media. He is connected to different politicians through
so many topics, making him a central figure over the 12
years observed.
Another very interesting point which is worth noting
concerns the Imperial family. The Japanese Constitution
forbids the Imperial family to take any part in politics,
and observing the links surrounding the members of the
family are of high interest to survey their actions. Our
system finds very little connections (purple nodes in Fig.
9(c), (d), and (h)): they mostly concern the revision of the
Imperial Household Law because of the issue concerning
the succession to the Imperial Throne.
VI. D ISCUSSION AND FUTURE WORK
The different network views provide a powerful tool
to understand the media situation, but we also need to
draw the limits of the definition of these networks. As
for now, the topic association brings the most meaningful
construction of links, even if no actual semantics has yet
been introduced in the system. It is equally important
to understand how the different pre-processing parts may
have strong influences in later interpretations.
The screen overlap network has the strongest family
of links in terms of social ties, but it is also the most
subject to controversy in two ways. First, because of the
bursty characteristics of our data, the limited but reliable
subset of people, and parameters of our face-detections
make the amount of screen co-detections limited. Then,
because many detections concern split screens, which in
in turn often means an opposition of ideas on a same
subject, hence defining a sort of negative link – something
we would like to investigate in the future. We want to
distinguish this case from the screen co-occurence, which
holds the different meaning of people standing in the same
room at the same time (Fig. 10).
The same comment may also be made on the shot cooccurrence network, which finally extends the latter with
a lighter meaning. For example, some shots occur behind
the anchorman switching from one topic to another, sometimes leading to false positive links. Besides the system
(a) Mori 2
2000/7/4 – 2001/4/26
(b) Koizumi 1
2001/4/26 – 2003/11/19
(c) Koizumi 2
2003/11/19 – 2005/09/21
(d) Koizumi 3
2005/09/21 – 2006/09/26
(e) Abe 1
2006/09/26 – 2007/09/26
(f) Fukuda
2007/09/26 – 2008/09/24
(g) Aso
2008/09/24 – 2009/09/16
(h) Hatoyama
2009/09/16 – 2010/06/08
(i) Kan
2010/06/08 – 2011/09/02
(j) Noda
2011/09/02 – 2012/12/26
(k) Abe 2
2012/12/26 – 2014/12/24
(l) Comparison of all cabinets
Figure 9. The networks are better seen zoomed. From Mori 2 (a) to Abe 2 (k), the topic networks during the different cabinets with the same
encoding as in Fig. 6. (l) This network shows the (Jaccard) proximity between cabinets given their most visible politicians on the NHK’s scene. The
size of nodes encodes the number of persons detected during a cabinet. The edges color and size encode the Jaccard proximity (the darker, the closer).
We can notice how things have slowly changed from one cabinet to another during the 2006-2011 game of musical PM chairs.
Figure 10. The difference between screen co-occurence on a ‘split
screen’ (Left) or within a same picture (Right) – Image courtesy of the
NHK.
showing a good accuracy [25], some face occurrences may
remain untracked, but we can still draw our conclusions
thanks to the large period of time we observe.
Since we are discussing the data itself, our future work
will extend the set of people to all faces detected in the
dataset, not limited to the tagged individuals. We also put
effort in enhancing the precision of the detection; and the
addition of semantic information derived from the topic
detection will be a great improvement.
This paper only scratches the surface, but the analysis of
news data craves for application of many network analysis
techniques. For example, the different overlaying families
of links (screen, shot, topics) also form a multiplex network as in [33]. We can draw multiplex networks as in [15]
with people interacting through cabinets and hopefully find
cohesive groups of politicians. The dynamic of links is also
of great interest and Δ-cliques [34] (cliques over time in a
stream of links) is a promising lead. In addition to finding
outliers, we will be interested in groups of political actors
who regularly appear together among similar topics.
480480
VII. C ONCLUSION
This work has introduced the production and analysis
of face detection and tracking data over twelve years of
news broadcast. We have detailed the data’s characteristics
and brought a few outliers. Together with the use of topic
segmentation and some limited domain knowledge, we
have derived many networks, each presenting a different
point of view on the data.
The combined views of these networks shows interesting insights on the story behind the data, an arguably clear
picture of the media/politics landscape during the different
cabinets, also isolating key players at different levels. That
is what the general reader may take away: thanks to the
networks, even those knowing nothing of the Japanese
media landscape can quickly get an idea of who are the
main actors in the Japanese media landscape and their
relative importance. Of course, the level of comprehension
will increase as we improve the precision of our detectors,
and the semantics of our links.
Rather different to the classical topic detection and
tracking approaches of news data, this work brings up if
not confirms the relevance of network analysis derived
from news data. By itself, this is also an interesting
framework for many potential contributions to the current
challenges of social network analysis – including, but not
limited to, multiplex and multi-attributed network analysis,
dynamic networks, and their combination.
Finally, this work has given us useful directions that
will help us design visualization tools, which we wish to
put as quickly as possible in the hands of domain experts,
sociologists and journalists, for an in-depth analysis of
over 12 years of news.
[18] B. Mish, “Game of Nodes: A Social Network Analysis
of Game of Thrones,” 2015. [Online]. Available:
/>
R EFERENCES
[19] M. Itoh, M. Toyoda, C. Z. Zhu, S. Satoh, and M. Kitsuregawa, “Image flows visualization for inter-media comparison,” in Pacific Visualization Symposium (PacificVis), 2014
IEEE. IEEE, 2014, pp. 129–136.
[1] A. J. Hey, S. Tansley, K. M. Tolle et al., The fourth
paradigm: data-intensive scientific discovery. Microsoft
Research Redmond, WA, 2009.
[2] J. Allan, Topic detection and tracking: event-based information organization. Springer Science & Business Media,
2002, vol. 12.
[3] N. Herv´e, M.-L. Viaud, J. Thi`evre, A. Saulnier, J. Champ,
P. Letessier, O. Buisson, and A. Joly, “Otmedia: the french
transmedia news observatory,” in Proceedings of the 21st
ACM international conference on Multimedia.
ACM,
2013, pp. 441–442.
[4] J. Cag´e, “Media competition, information provision and
political participation,” Unpublished manuscript, Harvard
University, 2014.
[5] P. Resnick, R. K. Garrett, T. Kriplean, S. A. Munson,
and N. J. Stroud, “Bursting your (filter) bubble: Strategies
for promoting diverse exposure,” in Proceedings of the
ACM 2013 Conference on Computer Supported Cooperative Work Companion, 2013, pp. 95–100.
[6] R. Hazell and B. Worthy, “Assessing the performance of
freedom of information,” Government Information Quarterly, vol. 27, no. 4, pp. 352–359, 2010.
[7] F. Schroff, D. Kalenichenko, and J. Philbin, “Facenet: A
unified embedding for face recognition and clustering,”
arXiv preprint arXiv:1503.03832, 2015.
[8] P. Viola and M. J. Jones, “Robust real-time face detection,”
International journal of computer vision, vol. 57, no. 2, pp.
137–154, 2004.
[9] I. Ide and F. Nack, “Explain this to me!” ITE Transactions
on Media Technology and Applications, vol. 1, no. 2, pp.
101–117, 2013.
[10] C. Castillo, G. De Francisci Morales, M. Mendoza, and
N. Khan, “Says who?: automatic text-based content analysis of television news,” in Proceedings of the 2013 international workshop on Mining unstructured big data using
natural language processing. ACM, 2013, pp. 53–60.
[11] S. Sudhahar, R. Franzosi, and N. Cristianini, “Automating
quantitative narrative analysis of news data.” in WAPA,
2011, pp. 63–71.
[12] D. Lazer, “Networks in political science: Back to the
future,” PS: Political Science & Politics, vol. 44, no. 01,
pp. 61–68, 2011.
[13] L. A. Adamic and N. Glance, “The political blogosphere
and the 2004 us election: divided they blog,” in Proceedings of the 3rd international workshop on Link discovery.
ACM, 2005, pp. 36–43.
[14] M. K. Martin, J. Pfeffer, and K. M. Carley, “Network text
analysis of conceptual overlap in interviews, newspaper articles and keywords,” Social Network Analysis and Mining,
vol. 3, no. 4, pp. 1165–1177, 2013.
[15] B. Renoust, G. Melanc¸on, and M.-L. Viaud, “Entanglement
in multiplex networks: understanding group cohesion in homophily networks,” in Social Network Analysis-Community
Detection and Evolution. Springer, 2014, pp. 89–117.
[16] M. C. Waumans, T. Nicod`eme, and H. Bersini, “Topology
analysis of social networks extracted from literature,” PloS
one, vol. 10, no. 6, p. e0126470, 2015.
[17] C.-J. Nan, K.-M. Kim, and B.-T. Zhang, “Social network
analysis of tv drama characters via deep concept hierarchies,” in Proceedings of ASONAM 2015, 2015.
481481
[20] H. Luo, J. Fan, J. Yang, W. Ribarsky, and S. Satoh,
“Analyzing large-scale news video databases to support
knowledge visualization and intuitive retrieval,” in Visual
Analytics Science and Technology, 2007. VAST 2007. IEEE
Symposium on. IEEE, 2007, pp. 107–114.
[21] M.-L. Viaud, J. Thi`evre, H. Go¨eau, A. Saulnier, and
O. Buisson, “Interactive components for visual exploration
of multimedia archives,” in Proceedings of the 2008 international conference on Content-based image and video
retrieval. ACM, 2008, pp. 609–616.
[22] C. Seifert, V. Sabol, W. Kienreich, E. Lex, and M. Granitzer, “Visual analysis and knowledge discovery for text,” in
Large-Scale Data Analytics. Springer, 2014, pp. 189–218.
[23] N. Katayama, H. Mo, I. Ide, and S. Satoh, “Mining largescale broadcast video archives towards inter-video structuring,” in Advances in Multimedia Information ProcessingPCM 2004. Springer, 2005, pp. 489–496.
[24] I. Ide, H. Mo, N. Katayama, and S. Satoh, “Topic threading
for structuring a large-scale news video archive,” in Image
and Video Retrieval. Springer, 2004, pp. 123–131.
[25] T. D. Ngo, H. T. Vu, L. Duy-Dinh, and S. Satoh, “Face
retrieval in large-scale news video datasets,” IEICE TRANSACTIONS on Information and Systems, vol. 96, no. 8, pp.
1811–1825, 2013.
[26] G. Bradski et al., “The opencv library,” Doctor Dobbs
Journal, vol. 25, no. 11, pp. 120–126, 2000.
[27] J. Shi and C. Tomasi, “Good features to track,” in Computer Vision and Pattern Recognition, 1994. Proceedings
CVPR’94., 1994 IEEE Computer Society Conference on.
IEEE, 1994, pp. 593–600.
[28] X. Wang, C. Zhai, X. Hu, and R. Sproat, “Mining correlated
bursty topic patterns from coordinated text streams,” in
Proceedings of the 13th ACM SIGKDD international conference on Knowledge discovery and data mining. ACM,
2007, pp. 784–793.
[29] V. D. Blondel, J.-L. Guillaume, R. Lambiotte, and E. Lefebvre, “Fast unfolding of communities in large networks,”
Journal of Statistical Mechanics: Theory and Experiment,
vol. 2008, no. 10, p. P10008, 2008.
[30] S. B. Seidman, “Network structure and minimum degree,”
Social networks, vol. 5, no. 3, pp. 269–287, 1983.
[31] I. Herman, M. S. Marshall, and G. Melanc¸on, “Density
functions for visual attributes and effective partitioning in
graph visualization,” in Information Visualization, 2000.
InfoVis 2000. IEEE Symposium on. IEEE, 2000, pp. 49–
56.
[32] I. Meyer, “The History of Japan podcast, Episode 82:
The Shadow Shogun, Redux,” 2014. [Online]. Available:
/>[33] M. Kivel¨a, A. Arenas, M. Barthelemy, J. P. Gleeson,
Y. Moreno, and M. A. Porter, “Multilayer networks,” Journal of Complex Networks, vol. 2, no. 3, pp. 203–271, 2014.
[34] J. Viard, M. Latapy, and C. Magnien, “Computing maximal
cliques in link streams,” arXiv preprint arXiv:1502.00993,
2015.