DSpace at VNU: Arsenic contamination in groundwater and its possible sources in Hanam, Vietnam
Bạn đang xem bản rút gọn của tài liệu. Xem và tải ngay bản đầy đủ của tài liệu tại đây (2.45 MB, 15 trang )
Environ Monit Assess (2012) 184:4501–4515
DOI 10.1007/s10661-011-2281-6
Arsenic contamination in groundwater and its possible
sources in Hanam, Vietnam
Nguyen Minh Phuong & Yumei Kang & Katsutoshi Sakurai & Miyuki Sugihara &
Chu Ngoc Kien & Nguyen Dinh Bang & Ha Minh Ngoc
Received: 3 November 2010 / Accepted: 27 July 2011 / Published online: 10 August 2011
# Springer Science+Business Media B.V. 2011
Abstract This study investigated the arsenic (As)
level in groundwater, and the characteristics of aquifer
sediment as related to the occurrence of As in
groundwater in Hanam, Vietnam. The deposition and
transport of As-containing substances through rivers
were also examined. Arsenic concentrations in 88%
of the groundwater samples exceeded the As limit for
drinking water based on the WHO standards. The
dominating form of arsenic was As(III). The maximum total As content in bore core sediment was
found in a peat horizon of the profiles and generally,
elevated levels of As were also found in other organic
matter-rich horizons. Total As contents of the bore
core sediments were significantly correlated with
crystalline iron oxide, silt and clay contents, suggesting that As in aquifer sediment was mainly associated
with iron (hydr)oxides and clay mineral. In the
groundwater, As concentration showed significant
correlations with the total concentrations of Fe and
HCO 3 − . Significant correlations between HClextractable As and non-crystalline Fe oxide, total C,
N, and S were also observed in the profiles. The
results support the hypothesis that under favorable
reductive conditions established by the degradation of
organic matter, the dissolution of iron (hydr)oxides
releases adsorbed As into the groundwater. The
deposition of As in the sediments from the Red River
were significantly higher than that in the Chau Giang
River, suggesting that the Red River is the main
source of As-containing substances deposited in the
study area.
Keywords Arsenic . Bore core . Groundwater . River .
Sediment . Vietnam
N. M. Phuong : C. N. Kien
United Graduate School of Agricultural Sciences,
Ehime University,
Matsuyama 790-8566, Japan
Y. Kang : K. Sakurai : M. Sugihara
Faculty of Agriculture, Kochi University,
Monobe, Nankoku,
Kochi 783-8502, Japan
N. M. Phuong (*) : N. D. Bang : H. M. Ngoc
Faculty of Chemistry, Hanoi University of Science,
Hanoi, Vietnam
e-mail:
Introduction
Arsenic is unique among the heavy metalloids and
oxyanion-forming elements (e.g., As, Se, Mo) in its
susceptibility to mobilization under the pH conditions
typically found in groundwater (pH=6.5–8.5) and over
a wide range of redox conditions (Hossain 2006). Tens
of millions of people in South and Southeast Asia
routinely consume groundwater that has unsafe As
levels (Smith et al. 2000; Chowdhury et al. 2000; Berg
et al. 2001, 2007; Hossain 2006). As a main water
4502
source for local communities, groundwater has been
exploited in Vietnam since the 1900s. The first
publication on As contaminations in groundwater of
Hanoi, Vietnam, in 2001 reported contamination levels
from 1 to 3,050 μg l−1 (average 159 μg l−1) (Berg et al.
2001). Such elevated As concentrations were found in
numerous regions throughout Vietnam (Berg et al.
2001; Chander et al. 2004; Agusa et al. 2006; Nguyen
et al. 2009). A random survey of As levels in tube well
water from 12 Vietnamese provinces indicated that
Hanam is one of the most seriously As-contaminated
area in the Red River Delta. In this area, As
concentrations exceeded the WHO guideline for As
in drinking water (10 μg l−1) (Chander et al. 2004) in
52% of the tube wells surveyed.
Arsenic-bearing groundwater in Vietnam has been
noted because of the geological similarity with the
Ganges–Brahmaputra, Mekong, and Red River basins
which are built up with alluvium from the rapidly
weathering Himalayas and are characterized by
complex lithological structures of the aquifers which
do not show a full separation between upper and
lower aquifers (Laurent and David 2006). Some
researchers have argued that oxidation of As-rich
sulfide minerals is one possible mechanism for the
release of As into groundwater. Others have suggested
that reductive dissolution of iron oxyhydroxides or
arsenate sorbed by detrital organic carbon is another
possible mechanism of As mobilization (Nickson et
al. 1998; Smedley and Kinniburgh 2002). However,
the dissolution of iron oxide is regarded the primary
process responsible for high As concentrations in the
groundwater in some areas. Arsenic is naturally
derived from eroded Himalayan sediments, and is
believed to become mobile following reductive
release from solid phases under anaerobic conditions
(Polizzotto et al. 2008). A study of the hydrological
and sedimentary conditions of river bank deposits in
the Hanoi area indicated that elevated groundwater
levels of As are caused by reductive dissolution under
iron-reducing conditions (Berg et al. 2008).
Hanam Province with a total area of 849.5 km2 and
a population of 820,100 is a productive agricultural
region located in the lower part of the Red River
Delta. The topography is dominated by limestone
mountains, hills, and forests with some sloping areas
in the west (10–15% of the total area), whereas the
east is a plain that mainly consists of alluvium from
the Red River (85–90% of the total area). About 38.6
Environ Monit Assess (2012) 184:4501–4515
km of the Red River form the eastern border of the
province. The Red River plays an important role in
the fertility and irrigation of the roughly 10,000 ha of
agricultural land. However, there is little information
on the characteristics and degree of As contamination,
and the causes of As release to the groundwater in this
area. In this study, we examined As concentrations in
groundwater and the geochemical parameters of
aquifer sediment related to the occurrence of As in
the groundwater. Our study area in the Lynhan district
of Hanam Province represents alluvium from two
rivers, the Red River and the Chau Giang River.
Therefore, we also investigated the deposition and
transport of pollutants through these streams.
Materials and methods
Sample collection and preparation
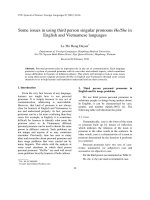
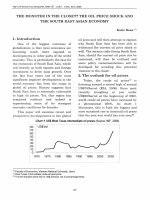
This survey was conducted in the Xuan Khe (XK),
Hop Ly (HL) and Chan Ly (CL) communes of the
Lynhan district, Hanam Province, in November 2006
(dry season) (Fig. 1). Hop Ly and Xuan Khe are
located near the Chau Giang River, while Chan Ly is
located near the Red River.
Groundwater samples were taken from 31 randomly chosen tube wells in the three communes (Hop Ly,
n=12; Xuan Khe, n=11; Chan Ly, n=8). Prior to
sampling, water from tube wells was flushed away
until crystal clear water was obtained (Berg et al.
2001). Immediately after collection, pH, electrical
conductivity (EC), oxidation–reduction potential (Eh),
and dissolved oxygen (DO) were measured. The
samples were passed through small disposable ion
exchange cartridges packed with 2.5 g selective
aluminosilicate adsorbent (Metalsoft Center, Highland
Park, NJ; Meng and Wang 1998). This adsorbent
retained As(V) but not As(III). The filtrates then were
acidified with 1% (volume) concentrated HCl for As
(III) analysis. The cartridges have been widely used in
the field to separate As(V) from As(III) in water
samples because of their convenience and reliability.
The average recovery of As(III) in the filtrates was
98% (Meng and Wang 1998). Water samples for the
analysis of total As, Fe, and Mn were acidified with 1
ml concentrated HCl acid and preserved in 100-ml
polypropylene bottles. For major ions analysis,
polypropylene bottles were filled completely with
Environ Monit Assess (2012) 184:4501–4515
Fig. 1 The study area, Ly
Nhan district, Ha Nam
province, Vietnam. Further
details of the location of
sampling sites (bore core,
groundwater, river water,
and river sediment sampled
site) are as in Figs. 2, 3, 4,
8, and 9
4503
106o05'
106o00'
Lynhan
106o10'
106o15'
106o20'
Hop Ly
Chan Ly
20o60'
Hanam
20o55'
Hanoi
0
2 km
Chau Giang River
Legend
Xuan
Khe
20o50'
river, canal
commune border
Vietnam
sampled water, all bubbles were removed, and the
bottles were tightly capped. A set of 50-ml samples
was used to determine HCO3− in the laboratory (see
below for details). Another set of 50-ml samples were
filtered through 0.45-μm membrane filters to remove
suspended organic matter and acidified to pH<2 with
concentrated HCl for DOC analysis conducted
according to Standard Methods 5310 (see below for
details). All water samples were kept at 4°C until
analysis.
To clarify the origin of As contaminations in tube
well water, bore cores were obtained in the XK and
HL communes to depths of about 20 m, the common
depth of household tube wells in the study area. The
pre-survey was conducted to select the location of the
bore cores. The locations of the bores were selected
based on first, the As levels we had examined in 15
tube wells using the Hach As test kit (the data is not
shown), and second, on observations of dark peat
horizons made by local people when they drilled their
wells. Samples from the same, clearly differentiated
horizon were combined for analysis. Water samples
were collected from the bore holes after 1 h pumping.
In addition, sediment and water samples from 5
points along the Red River and 6 points along the
Chau Giang River were sampled. The sediments were
air-dried, ground with a ceramic pestle, passed
through a 2.0-mm sieve, and stored in plastic bottles
until analysis. The water samples were filtered
through filter paper, acidified with 1% (volume)
concentrated HCl, and kept at 4°C until analysis.
Analysis
Water
EC and pH were measured on-site by potable EC/pH
meter (WM-22EP, DKK-TOA, Japan). Redox potential (Eh) was also recorded on-site with an ORP meter
(RM-20P, DKK-TOA), and DO was measured with a
portable DO meter (YSI 55, YSI, USA). In the
laboratory, water samples were analyzed for total
concentration of As using an inductively coupled
plasma atomic emission spectrometer (ICP-AES;
ICPS-1000 IV, Shimadzu, Kyoto, Japan) equipped
with a hydride vapor generator (HVG-1; Shimadzu).
The total concentrations of Fe and Mn were determined using an atomic absorption spectrometer
(AAS; AA-6800, Shimadzu). In order to assure the
precision of the measurement, reference standard
solution with a known concentration of each measured element, which was prepared from the different
source of the stock standard solution used for
calibration standard, were used as a control sample.
After every ten samples during analysis, the control
sample was analyzed to check the accuracy of
analysis. All samples were measured at least two
times in order to assess the repeatability of the
measurement. Samples were reanalyzed if the error
of the control sample exceeded 10% or the relative
standard deviation of the measurement exceeded 5%.
Dilution was made with 2% nitric acid, when the
concentration of the sample was over the upper
4504
limitation of the standard range. HCO3− was measured by titration method using methyl orange and
bromcresol green indicators, and DOC was analyzed
with a TOC analyzer (TOC-VCPH/TNM; Shimadzu).
The concentrations of Cl−, NO3−, SO42−, PO43−,
NH4+, Na+, K+, Mg2+, and Ca2+ ions were determined
by ion chromatography (IA −300, DKK-TOA, Japan).
Sediment
For the analysis of total As, P, and S contents, a 0.15-g
soil sample was digested at 100°C in a Teflon vessel
containing a mixture of 2 ml 60% HClO4, 3 ml conc.
HNO3, 5 ml concentrated HF, and 2 ml of a 20 gl–1
KMnO4 solution. If the purple color of the KMnO4 had
disappeared after 20 min of heating, 1 ml of the
KMnO4 solution was added, and this procedure was
repeated until the mixture remained colored (Terashima
1984). The concentrations of As in the digests were
determined by using an ICP-AES (ICPS-1000 IV;
Shimadzu) equipped with HVG-1 (Shimadzu). For
the determination of P and S, the ICP-AES system was
used. The standard reference materials (JSO-1 and
JSO-2 from the Geological Survey of Japan) were used
to verify the accuracy of As determination. The
recovery rates of As were within 95–105%. Bore core
sediments were extracted with 1 M HCl over 30 min to
determine HCl-extractable As. Physicochemical properties of the bore core sediments including particle size
distribution, total carbon (TC), total nitrogen (TN),
dithionite–citrate–bicarbonate (DCB)-extractable and
ammonium oxalate-extractable Fe oxides and hydroxides (Fed and Feo, respectively) were examined by the
methods described by Phuong et al. (2008).
Results
Chemistry of groundwater
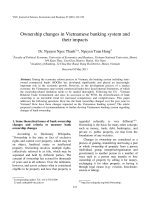
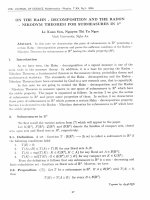
Arsenic concentrations in the groundwater samples
ranged from <5 to 703 μg l−1 (178±170 μg l−1); the
geographic distribution of As in the three communes
is shown in Figs. 2, 3, and 4. The average As
concentrations in the groundwater of HL, XK and CL
were 196, 256, and 43 μg l−1, respectively; the value
for CL was significantly lower than those for HL and
XK. On average, about 76% of the total As in the
groundwater existed in the As(III) form.
Environ Monit Assess (2012) 184:4501–4515
The groundwater was characterized by a neutral
pH and high EC (Table 1). The low Eh values (−157
to 11.0 mV) demonstrated the reducing nature of the
aquifer (Table 1). Concentrations of total Fe in the
water samples ranged from 1.17 to 41.6 mg l−1
(average, 15.0 mg l−1). The total Mn concentration
varied from <0.1 to 2.82 mg l −1 (average,
0.66 mg l−1). A wide range of NH4+ concentration
was found in the groundwater (<0.2–76.0 mg l−1;
average, 20.7 mg l−1). The concentrations of NO3−
and SO42− in most samples were lower than the
detection limit. Except for one sample, the concentrations of PO43− were lower than 2.4 mg l−1. The DO
values were lower than 1.76 mg l−1. Major ion
composition was dominated by HCO 3 − (56.1–
683 mg l−1; average, 474 mg l−1), followed by Na+
(14.7–816 mg l−1; average, 202 mg l−1) and Ca2+
(37.9–175 mg l−1; average, 97.4 mg l−1). The average
concentrations of HCO3− and Ca2+ in the groundwater
of CL were significantly lower, and the average
values of Eh and total Mn were significantly higher
than at the other two sites. Compared to HL and CL,
significantly higher levels of EC, DOC, NH4+, K+ and
Mg2+ were observed in XK. Concentrations of Cl−
and Na+ were significantly lower in HL than in XK
and CL. Furthermore, the concentration of As
correlated significantly with the concentrations of Fe
(r=0.678; p≤0.01); HCO3− (r=0.426; p≤0.05); pH
(r=0.460; p<0.01); while it was negatively correlated
with Eh values (r=−0.550; p≤0.01) (Fig. 5).
Geochemical characteristics of aquifer sediments
Description of the bore cores
In XK bore core, brown to brownish grey clay, muddy
clay and silty clay layers were observed from the
surface horizon to 4.7 m. A sequence of grey or dark
grey silty sand and fine grained sand were collected
from 4.7 to 20 m, interrupted by some plant remains
and shells or snails (Fig. 6a).
The drilling site of HL bore core is overlain by a 2m-thick brown clay layer. Below this layer, grey silty
sand and fine grained sand layers were observed to a
depth of 23 m. A thin and dark grey peat layer
enriched with plant residuals and organic matter was
collected at 6.6–7.0 m depth. A lot of shells and snails
were found in a fine grained sand horizon at 19–23 m
(Fig. 7a).
Environ Monit Assess (2012) 184:4501–4515
Fig. 2 As concentrations
in the groundwater in Xuan
Khe. Filled star, bore core;
empty circle, As level
lower than 10 μg l−1;
shaded circle, As level 10–
100 μg l−1; diagonally
striped circle, As level 100–
300 μg l−1; filled circle, As
level greater than 300 μg l−1
4505
Arsenic (µ
µ g L-1)
< 10
10 -100
100 -300
> 300
500 m
Legend
paddy field
river, lake, canal
ChauGiangRiver
commune border
bore core sampling location
Chemistry of aquifer sediments
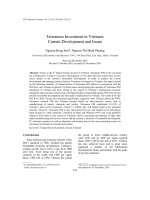
The total As contents in the sediments of the XK and
HL bore cores ranged from 5.51 to 20.1 and from
7.37 to 25.1 mg kg−1, respectively. In the XK profile,
elevated levels of total As were detected in clay layers
from the surface to 3.7 m, at 4.0–4.7 m, and in a
horizon containing plant residuals (14.0–14.8 m). On
the other hand, the highest total As content (25.1 mg
kg−1) in the HL profile was found in a peat horizon
(6.6–7.0 m) (Figs. 6b and 7b).
In the XK profile, high proportions of HClextractable As were observed in the layers containing
plant residuals or organic matters (Fig. 6b). A high
proportion of HCl-extractable As was detected in a
peat horizon of the HL profile (Fig. 7b).
In XK profile, the distribution of Fed showed
similar trends as the total As content throughout the
XK profile (Fig. 6b). Except for the surface horizon
(0–1 m), the distribution of P and Feo roughly
paralleled the total As in the profile (Fig. 6b). In
parts of the profile, total As also correlated with
HCl-extractable As (6.8–20 m), total C (6.8–20 m),
and clay (0–12 m) (Fig. 6). Furthermore, the
distribution of HCl-extractable As and total S
content were quite similar throughout the profile
(Fig. 6b).
In HL profile, the P distribution in the HL profile
resembled that of total As contents (Fig. 7b). Except
for 0–3 m depth, the distributions of HCl-extractable
As, total S, C, and N contents were similar to that of
total As (Fig. 7b). At 8–22 m, a correlation between
clay or silt and total As distribution was observed
(Fig. 7b). In addition, HCl-extractable As, total S, C,
and N showed parallel trends (Fig. 7b). Highest total
P, S, C and N contents were detected in a peat
horizon, where the highest total and HCl-extractable
As contents were detected.
4506
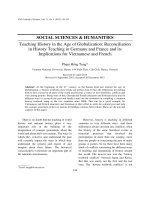
Fig. 3 As concentrations
in the groundwater in Hop
Ly. Further details as in
Fig. 2
Environ Monit Assess (2012) 184:4501–4515
Arsenic (µg L-1)
< 10
10 -100
100 -300
> 300
500 m
Legend
river, lake, canal
paddy field
bore core sampling location
Results of the correlation analysis between As and
other parameters of the XK and HL bore core
sediments (except for the peat horizon) are shown in
Tables 2 and 3. In the XK bore core, the total As
contents of the sediments were positively correlated
with Fed, N, P, clay, silt contents, and were correlated
negatively with sand contents (p≤0.01). A significant
correlation at a level of 5% was also obtained between
the total As and Feo contents. On the other hand, the
HCl-extractable As contents were significantly correlated with total C and N at a level of 1%, and with Feo
and total S at a level of 5% (Table 2). In the HL bore
core, the total As contents were significantly correlated with Fed, P, clay, silt and sand contents (p≤0.01).
HCl-extractable As contents showed significant correlations with Feo, total C, S at a level of 1%, and
with total N at a level of 5% (Table 3).
commune border
Levels of As in river water and sediments
River water
The level of As in the river water ranged from <5 to
13 μg l−1 (Fig. 8). The highest As concentration was
observed in the sample W6 from the Hop Ly area, but
the levels decreased downstream along the Chau
Giang River. In the Red River, no unambiguous
trends were observed along the stream. The differences in As concentration between the two river
branches were not significant (paired t-test, p≤0.05).
Sediments
The content of As in the river sediments ranged from
15.2 to 92.1 mg kg−1 (average, 47.3 mg kg−1)
Environ Monit Assess (2012) 184:4501–4515
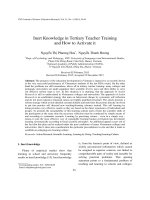
Fig. 4 As concentrations in
the groundwater in Chan Ly.
Further details as in Fig. 2
4507
Arsenic (µg L-1)
< 10
10 -100
100 -300
> 300
500 m
Legend
paddy field
river, lake, canal
commune border
(Fig. 9). The highest accumulation of As (92.1 mg
kg−1) was found in the S5 sample from the intersec-
tion of the two rivers. Contrary to the river water data,
the lowest sediment content of As (15.2 mg kg−1) was
Table 1 General chemical properties of the groundwater
Water compositions
Xuan Khe (n=11)
Hop Ly (n=12)
Chan Ly (n=8)
Range
Mean
SD
Range
Mean
SD
Range
Mean
SD
pH
6.37 to 7.44
6.83
0.30
6.64 to 7.06
6.84
0.15
6.32 to 7.35
6.72
0.32
Eh (mV)
−154 to −102
−134
15.4
−153 to −101
−135
16.1
−157 to 11.0
−68.0
68.7
EC (mS m−1)
94.6 to 596
342
196
72.8 to 108
90.7
11.9
87.5 to 435
198
108
DO (mg l−1)
0.41 to 1.30
0.83
0.25
0.35 to 1.46
0.86
0.30
0.38 to 1.76
0.93
0.49
DOC (mg l−1)
2.97 to 18.9
9.32
5.14
0.09 to 4.62
2.15
1.26
0.43 to 12.9
2.81
4.25
−1
Fe (mg l )
8.55 to 41.6
20.6
10.3
4.37 to 34.5
13.8
10.4
1.17 to 26.9
9.26
10.1
Mn (mg l−1)
nd to 1.93
0.32
0.55
nd to 1.79
0.57
0.48
0.00 to 2.82
1.26
1.08
HCO3− (mg l−1)
211 to 980
541
257
459 to 683
578
73.5
56.1 to 564
225
211
Cl− (mg l−1)
24.2 to 2,980
924
911
9.16 to 69.8
35.7
18.3
6.70 to 1,310
552
410
NO3− (mg l−1)
nd to 8.11
1.21
2.33
nd to 8.13
1.96
3.06
nd
nd
–
SO42− (mg l−1)
PO43− (mg l−1)
NH4+ (mg l−1)
+
−1
nd to 0.08
0.01
0.03
nd to 3.5
0.73
1.20
nd
nd
–
0.44 to 9.09
1.81
2.48
0.20 to 2.52
0.90
0.66
0.10 to 0.65
0.31
0.22
9.40 to 76.0
46.2
22.0
nd to 18.3
4.75
7.00
nd to 48.4
14.8
14.8
Na (mg l )
17.1 to 816
406
287
9.03 to 38.7
19.8
8.14
14.7 to 567
194
171
K+ (mg l−1)`
8.45 to 36.4
16.2
10.0
2.23 to 17.0
5.34
3.94
4.28 to 20.6
8.31
5.17
2+
−1
(mg l )
25.7 to 93.5
62.1
23.8
20.8 to 38.4
28.8
5.04
28.6 to 58.8
41.8
12.8
Ca2+ (mg l−1)
76.5 to 175
121
33.3
89.0 to 132
102
11.8
37.9 to 109
58.6
26.3
Mg
nd none detected (<0.1 mg l−1 for Mn, <0.01 mg l−1 for NO3− , <0.03 mg l−1 for SO42− , <0.2 mg l−1 for NH4+ )
4508
Environ Monit Assess (2012) 184:4501–4515
(a)
600
r = 0.68**
400
(b)
800
Total As (mg L-1)
200
600
400
r = 0.43*
200
0
0
0
10
20
30
40
0
50
200
400
(c)
Total As (mg L-1)
800
600
800
1,000
HCO3- (mg L-1)
Total Fe (mg L-1)
(d)
800
600
Total As (mg L-1)
Total As (mg L-1)
800
600
400
400
r = 0.46**
r = - 0.55**
200
200
0
6
6.4
6.8
7.2
7.6
8
-160
-120
-80
pH
0
-40
0
40
Eh (mV)
Fig. 5 Relation between As concentration and a Fe, b HCO3−, c pH, c Eh in groundwater
observed in the S6 sample from the Hop Ly area,
locating at the upper Chau Giang River. In the Red
River, the S3 sample from the Chan Ly area contained
the lowest As level (39.8 mg kg−1). Statistically, the
average content of As in the Red River sediments was
significantly higher than that in the Chau Giang River
sediments (paired t-test, p≤0.05).
Discussion
Arsenic concentration in groundwater
The present results lead to similar conclusions as a
previous study on groundwater in Hanam Province
(Nguyen et al. 2009): the groundwater in the studied
(a)
(b)
Medium to coarse
grained sand
0
Fine grained sand
-4
Total As (mg kg-1) DCB extractable Fe (g kg-1)
P (g kg-1)
0
10
20
30 0 5 10 15 20 25 0.0 0.2 0.4 0.6 0.8 0
1
C (%)
2 3
4
Clay/Silt (%)
5 0 10 20 30 40 50 60
C
N
Shell or snail
-16
P
S
-12
Silty sand
Clay
Silt
Sand
Fed
Feo
Silty clay
-8
Total As
HCl ex. As
Clay
Depth (m)
Muddy clay
Organic matter
-20
0 3 6 9 12 15 0 3 6 9 12 15
Tamm extractable Fe
HCl extractable As
(g kg-1)
(mg kg-1)
0
1
2
3
S (g kg-1)
4 0.00
Fig. 6 Description of a the Xuan Khe bore core and b the geochemistry of bore core sediments
0.06
0.12
N (%)
0 20 40 60 80 100
Sand (%)
Environ Monit Assess (2012) 184:4501–4515
4509
(a)
(b)
Medium to coarse
grained sand
0
Fine grained sand
-4
Silty sand
8
10 0
Clay/Silt (%)
10 20 30
40
-12
-16
Shell or snail
-20
Clay
Silt
Sand
P
S
Silty clay
C (%)
4 6
-8
Fed
Feo
Clay
2
C
N
Total As
HCl ex. As
Depth (m)
Muddy clay
P (g kg-1)
Total As (mg kg-1) DCB extractable Fe (g kg-1)
0
10
20
30 0 2 4 6 8 10 12 14 0.0 0.2 0.4 0.6 0.8 1.0 0
Organic matter
0
3
6
9
12 15
HCl extractable As
(mg kg-1)
0
2
4
6
8
10
0
Tamm extractable Fe
(g kg-1)
1
2 3 4
S (g kg-1)
5 0.0
0.1
0.2
N (%)
0 20 40 60 80 100
Sand (%)
Fig. 7 Description of a the Hop Ly bore core and b the geochemistry of bore core sediments
area is seriously contaminated with As, Fe, Mn
and NH4+. The concentration of Fe in all samples
exceeded the Vietnamese standard limit of 0.5 mg l−1
for drinking water (Ministry of Science, Technology
and Environment 2002). As concentrations (average,
178 mg kg −1 ) in the majority (88%) of the
groundwater samples exceeded the WHO guideline
as well as the Vietnamese standard limit for drinking
water (10 μg l−1). Similar levels of As in groundwater (159 μg l−1 in average) were reported from the
Hanoi area, where 72% of the tube wells contained
As levels higher than 10 μg l−1 (Berg et al. 2001).
Comparable levels of As contamination were observed
in Bangladesh, India, and Taiwan (Chowdhury et al.
2000; Nath et al. 2008; Wang et al. 2007). We detected
much lower As levels in the groundwater at sites close
to the Red River than at sites located on the banks of
the Chau Giang River; this has also been observed by
Nguyen et al. (2009).
Sixty eight and 32% of the samples, respectively,
contained NH4+ and Mn concentrations above the
Vietnamese standard limit for drinking water (4.0 and
0.5 mg l−1, respectively). The WHO guidelines for
Mn concentrations in drinking water is 0.4 mg l−1,
and the threshold of NH4+ in water is 1.5 mg l−1
(WHO 2008).
The high level of NH4+, low Eh and DO values,
negligible levels of NO3− and SO42−, and the
Table 2 Correlation between As and other chemical parameters in Xuan Khe bore core sediments
Total As
Total As
HClFed
extractable As
Feo
C
N
P
S
Clay
Silt
Sand
1
HCl0.320
extractable As
Fed
0.873**
1
0.114
1
Feo
0.514*
0.536*
0.514*
1
C
0.238
0.611**
0.010
0.383
N
0.642**
0.698**
0.637**
0.680** 0.439
1
P
0.874**
0.264
0.929**
0.580*
0.151
0.595*
S
0.230
0.562*
−0.021
0.435
0.834** 0.516*
−0.014
1
Clay
0.816**
0.005
0.941**
0.473
−0.172
0.508*
0.903**
−0.208 1
Silt
0.842**
−0.016
0.957**
0.514*
−0.079
0.526*
0.907**
−0.100 0.978**
Sand
−0.861** −0.038
*p≤0.05; **p≤0.01
1
−0.963** −0.536* 0.035
1
−0.561* −0.926** 0.072
1
−0.982** −0.997** 1
4510
Environ Monit Assess (2012) 184:4501–4515
Table 3 Correlation between As and other chemical parameters in Hop Ly bore core sediments
Total As
Total As
HClFed
extractable As
Feo
C
N
P
S
Clay
Silt
Sand
1
HCl−0.213
extractable As
Fed
0.879**
1
−0.094
1
Feo
−0.525
0.832**
−0.504
1
C
0.108
0.824**
0.255
0.632*
1
N
0.413
0.682*
0.588
0.305
0.892** 1
P
0.888**
−0.210
0.926**
−0.508
0.158
S
−0.098
0.806**
0.017
0.736** 0.955** 0.762** −0.019
Clay
0.825**
−0.083
0.974**
−0.504
0.233
0.599
0.956**
0.018
Silt
0.857**
−0.113
0.973**
−0.538
0.176
0.548
0.954**
−0.042 0.993**
Sand
−0.847** 0.077
−0.225
−0.589
−0.955** −0.008 −0.997** −0.998** 1
−0.977** 0.504
0.520
1
1
1
1
*p≤0.05; **p≤0.01
dominance of As(III) represented typical characteristics of groundwater under reductive conditions.
Anoxic conditions of groundwater were also observed
in Hanoi and some areas of the Red River Delta (Berg
et al. 2001, 2007; Postma et al. 2007). On the other
hand, compared to the data obtained in this study,
higher levels of sulfate and slightly lower Fe concen-
Fig. 8 Distribution of As
in river water. Bars in the
map indicate As contents
(As µg L-1)
15
10
5
0
Hop Ly
trations in the groundwater were reported from the
Mekong Delta, southern Vietnam, where acid, sulfaterich soils are abundant (Nguyen and Itoi 2009).
Moreover, the chemical features of the groundwater
observed in the present study are quite similar to
those in Bangladesh and West Bengal, India (Nickson
et al. 2000; Anawar et al. 2003; Nath et al. 2008).
0
W1
W2
W6
1
W3
Chan Ly
W7
W4
W8
W9
Xuan Khe
W10
W5
Legend
river, canal
commune border
W11
2 km
Environ Monit Assess (2012) 184:4501–4515
4511
Fig. 9 Distribution of As in
river sediments. Bars in the
map indicate As contents
S1
S6
Hop Ly
0
S3
1
2 km
S2
Chan Ly
S4
S7
S8
(As mg kg-1)
100
80
S9
60
40
S10
20
0
Legend
S5
river, canal
commune border
Occurrence of As in aquifer sediments
The contents of As in the solid phase of the XK and
HL sediment profiles were higher than the average As
content of sediments (7.7 mg kg−1) reported by
Bowen (1979), and were comparable with the As
content (2–20 mg kg−1) in alluvial sediments from
As-contaminated regions in Bangladesh (Hossain
2006). Similar degrees of As enrichment (0.85–37.7
mg As kg−1) were observed in vertical profiles of
down to 36 depth of the Ganges and Meghna flood
plains (Tareq et al. 2003). However, the As content in
the sediments of the XK and HL bore cores (5.51–25.1
mg kg−1) was higher than in the groundwater of
contaminated areas of Bangladesh (0.08–12.8 mg kg−1)
(Anawar et al. 2003). Swartz et al. (2004) and
Horneman et al. (2004) also reported lower total As
levels (≤10 mg kg−1) in bore core sediments from areas
influenced by As-contaminated groundwater in Bangladesh. A slightly higher total As content (4–45 mg
kg−1) was found in core samples taken in the Mekong
Delta, Vietnam (Nguyen and Itoi 2009).
The highest total As content (25.1 mg kg−1) in the
HL profile was found in a peat horizon (6.6–7.0 m),
which also contained the maximum amounts of C
(9.4%) and N (0.2%). Similar to these results, Root et
al. (2005) found the highest As content (21 mg kg−1) in
S11
an organic matter-rich horizon at a depth of 262 m at
an As-contaminated site in Wisconsin, USA. Meharg et
al. (2006) also discussed the co-deposition of organic
carbon and As in Bengal Delta aquifers. Peat was
found extensively in As-affected areas in south and
southwestern Bangladesh at depths of about 10 m
(Ishiga et al. 2000). Sediments containing 6.0 and
7.8% total organic carbon have been reported from
depths of 2.1 m at Gopalganj (southwestern Dhaka)
and 23 m at Tepakhola (Faridpur municipality, Bangladesh) (Nickson et al. 1998; McArthur et al. 2004).
Possible sources of As contamination in groundwater
Oxidation of As-rich sulfide minerals; reductive
dissolution of As-rich iron oxyhydroxides; and exchange of adsorbed As with other competitive anions
(phosphate, bicarbonate, and silicate) are supposed to
be main processes releasing As into groundwater
(Nickson et al. 2000; Root et al. 2005).
In our study, no relation between the contents of
total As and S could be found throughout the bore
cores. In addition, the low concentrations of SO42− as
well as the negative correlation between concentrations of As and Eh values in the groundwater
indicated that oxidation of As-rich sulfide minerals
might not occur in the study area.
4512
On the other hand, the similarities in the distributions of total As and Fe oxides in the XK and HL
sediment profiles suggested that As in the solid phase
was strongly adsorbed by iron (hydr)oxide. Given the
anaerobic condition of the studied groundwater, the
good correlations between As concentrations and the
levels of Fe, HCO3−, and pH values are some
evidences supporting the hypothesis that the dissolution of arseniferous iron oxyhydroxide may occurred
and releases the As sorbed on Fe oxyhydroxide
(Ahmed et al. 2004), according to:
4FeOOH þ CH2 O þ 7H2 CO3 ¼ 4Fe2þ þ 8HCO3 À þ 6H2 O
The hypothesis that As is released to groundwater
through the reduction of arseniferous iron oxyhydroxides under anoxic conditions has been widely
accepted for Bangladesh and West Bengal (Nickson
et al. 1998, 2000; Acharyya et al. 1999; Harvey et al.
2002; Anawar et al. 2003). Some evidence for the
association of As with iron oxyhydroxides in aquifer
sediments was also found in certain areas of the Red
River Delta (Berg et al. 2001, 2008; Postma et al.
2007).
Reduction of (hydr)oxides is often coupled to
microbial oxidation of organic matter (Nickson et al.
2000). In our study, the good correlations between the
content HCl-extractable As and total C, N, S and Feo
were observed, indicating the importance of organic
matter in mobilization of As. The total S significantly
correlated with total C and N in HL and XK bore core
sediments, and noncrystalline Fe oxides (Feo) in HL
bore core sediments, suggesting that the occurrence of
S in the solid phases may not in association with
mineral lattice. In addition, similar to the abundance
of total S in the organic matter-rich solid aquifers of
sedimentary basins of West Bengal (McArthur et al.
2004), we observed the highest accumulation of total
S in the peat horizon of the HL bore core. Reduction
of SO42− is supposed to be driven by microbial
metabolism of organic matter. Therefore, S is almost
absent from aquifer sands but is relatively abundant in
horizons that contain organic matter, where SO42− is
reduced and early diagenetic Fe sulfides are formed
(McArthur et al. 2004). The high proportion of HClextractable As, which accounted for 38% of the total
As content was detected in the peat horizon; and
relatively high As contents were also found in some
organic matter-rich horizons of the XK and HL bore
Environ Monit Assess (2012) 184:4501–4515
cores. The results suggested that upon burial of the
sediment, the degradation of organic matter provided
the reducing conditions that enhance the mobility of
As. Therefore, these organic matter-rich horizons are
possible sources of As.
Beside the incorporation between As and Fe
oxides, the good correlations between total As and
clay or silt in the XK and HL sediment profiles
indicated a strong occlusion of As in fine silt and clay
particles. Clay mineral particles tend to adsorb As
because of the oxide-like character of their edges
(Smedley and Kinniburgh 2002). Desorption of As
may occur via reductive mechanisms or competition
from other species (phosphate, bicarbonate, silicate)
for adsorption sites on mineral surfaces. The similarity in chemical behavior of As and P became evident
by their similar distributions in the sediment profiles
and the correlation data. Hence, mobilization of As
from the aquifer sediments to the groundwater might
be controlled by the competition for the adsorption
sites between P and As.
Taken together, the current study supports the
previous hypothesis that As is adsorbed by iron
(hydr)oxides, and that the dissolution of iron (hydr)
oxides and the release of As to the groundwater is
accelerated under favorable reductive conditions
established by the degradation of organic matter
under the reductive conditions established by the
degradation of organic matter (Meharg et al. 2006).
Transport of As-containing materials through surface
streams
Arsenic concentrations in river water vary according
to the composition of the surface recharge, the
contribution from base flow, and the bedrock lithology. However, As concentration in river water is
commonly low (<8 μg l−1) (Smedley and Kinniburgh
2002), and our results were in agreement with this
figure. The concentration of toxic elements in river
water depends on the adsorption affinity between the
toxic elements and the sediments. If the adsorption
affinity is strong, the self-purification capability of the
river water is enhanced (Chunguo and Zihui 1988).
Studying the distribution of As in surface sediments is important for understanding the deposition
and transportation of this pollutant in aquatic environments. Sediment-bound As most probably originates
from erosion and weathering processes, which result
Environ Monit Assess (2012) 184:4501–4515
in the enrichment of As on ferric oxyhydroxides
followed by fluvial transport and sedimentation
(Welch et al. 1988; Bowell 1994). The Red River
delta, located on the west coast of the Gulf of Tokin,
is one of the largest deltas in Southeast Asia. Initially
the delta was located in the vicinity of Hanoi, but it
subsequently expanded to reach its present area of
approximately 10,300 km2, mainly as a result of
sediment supply from the Red River (Tanabe et al.
2003, 2006). The total sediment discharge and water
discharge of the Red River system is 100–130 million
ton year−1 and 120 km3 year−1, respectively, and the
average sediment concentration of the river is 0.83–
1.08 kg m−3 (Tanabe et al. 2003). According to
Laurent and David (2006), the Ganges–Meghna–
Brahmaputra delta, the Mekong basin, and the Red
River basin all are part of the drainage system of the
rapidly weathering Himalayas whose sulfide rocks
contains up to 0.8% As (Acharyya et al. 2000).
Hanam Province is located in the lower part of the
Red River system, and thus receives huge amounts of
suspended solids carried by the Red River and other
smaller rivers. The suspended solids mostly originate
from erosion and weathering processes of parent
rocks from upstream regions including the Himalayas.
The load of As and other metal oxide contained in the
suspended solids results in fluvial transport and
downstream sedimentation of As-enriched metal
hydroxides.
Intriguingly, the distribution of As in the two river
streams running through Hanam is quite irregular
(Fig. 9), which resembled findings made in bed
sediments of the Ganges–Meghna–Brahmaputra river
system (Tareq et al. 2003). The combined effects of
water flow patterns, sediment load and geological
characteristics may lead to such irregular distribution
patterns (Tareq et al. 2003). However, the As levels
we found in the river bed sediments of the Red River
(63.4 mg kg−1 on average) and the Chau Giang River
(33.8 mg kg−1 on average) were higher than those of
the Ganges–Meghna–Brahmaputra system (12.2–27.5
mg kg−1). The values obtained were also significantly
higher than those reported for various unconsolidated
sediments in the world (0.6–50 mg kg−1; average,
3 mg kg−1) or for river bed sediments in Bangladesh
(1.2–5.9 mg kg−1), and for stream and lake silt in
Canada (<1–72 mg kg−1; average, 6 mg kg−1)
(Smedley and Kinniburgh 2002). The increasing
accumulation of As towards the lower intersection
4513
of the Red River and Chau Giang River implied that
under the aerobic conditions that prevail during
transport in the river system, sediment particles enable
the growth of metal oxides on their surfaces, and thus
act as As adsorbents. Furthermore, the river system
also transports weathered organic matter-rich sediments (Tareq et al. 2003). Long-term chemical
weathering and turbulent physical processes occurring
in the Red River and Chau Giang River system could
be significant factors that promote the biogeochemical
and sedimentary cycling of As during early diagenesis. The abundance of As in the sediments of the Red
River suggested that the Red River plays a more
important role than the Chau Giang River in the
transport of As-containing particles to the study area.
Further long-term and large-scale study on hydrological and sedimentary processes should be conducted
to elucidate the influence of river bank deposits.
Conclusion
Groundwater is the main water source for drinking,
cooking, watering and other household purposes in
the study area. The present study revealed that the
groundwater was seriously contaminated with As,
exceeding the limit given by the WHO (10 μg l−1) 20fold on average. Elevated concentrations of Fe, NH4+
and Mn were also found in the groundwater. Our
results suggested that the Fe oxyhydroxide reduction
process might be considered as a source for As in
groundwater. The relatively high accumulation of As
in peat and organic matter-rich horizons suggested
that these horizons are possible sources of As, where
the decomposition of organic matter can provide
reductive conditions that favor the mobilization of
As. The significant correlations between the contents
of total As and crystalline Fe oxides, and the silt and
clay fraction in sediments of two bore cores indicate
the strong affinity of iron (hydr)oxide or fine silt and
clay particles for As. HCl-extractable As was related
to total C, N, S, and Feo, suggesting that the reduction
of iron (hydr)oxides which releases adsorbed As is
often coupled to microbial oxidation of organic
matter. Although the levels of As in the river waters
was low, sediment particles enriched with As are
being carried by the Red River and the Chau Giang
River and probably have been deposited in the study
area which, consequently, might become a source of
4514
As itself. Based on our present understanding of the
problem, the only viable measure to control and
reduce As levels in the groundwater is the development of suitable treatment techniques to remove As
from the water in this area.
Acknowledgements The authors thank the officers of the
sampling sites and colleagues in the Faculty of Geology, Hanoi
University of Science, Vietnam, for their valuable help and
support with sample collection.
References
Acharyya, S. K., Chakraborty, P., Lahiri, S., Raymahashay, B.
C., Guha, S., & Bhowmik, A. (1999). Arsenic poisoning
in the Ganges delta. Nature, 401, 545.
Acharyya, S. K., Lahiri, S., Raymahashay, B. C., & Bhowmik,
A. (2000). Arsenic toxicity of groundwater in parts of the
Bengal basin in India and Bangladesh: the role of
quaternary stratigraphy and Holocene sea-level fluctuations. Environmental Geology, 39(10), 1127–1137.
Agusa, T., Kunito, T., Fujihara, J., Kubota, R., Tu, B. M., Pham,
T. K. T., et al. (2006). Contamination by arsenic and other
trace elements in tube-well water and its risk assessment to
humans in Hanoi, Vietnam. Environmental Pollution, 139,
95–106.
Ahmed, K. M., Bhattacharya, P., Hasan, M. A., Akhter, S. H.,
Alam, S. M. M., Bhuyian, M. A. H., et al. (2004). Arsenic
enrichment in groundwater of the alluvial aquifers in
Bangladesh: an overview. Applied Geochemistry, 19, 181–
200.
Anawar, H. M., Akai, J., Komaki, K., Terao, H., Yoshioka, T.,
Ishizuka, T., et al. (2003). Geochemical occurrence of
arsenic in groundwater of Bangladesh: sources and
mobilization processes. Journal of Geochemical Exploration, 77, 109–131.
Berg, M., Tran, H. C., Nguyen, T. C., Pham, H. V., Schertenleib,
R., & Giger, W. (2001). Arsenic contamination of
groundwater and drinking water in Vietnam: a human
health threat. Environmental Science & Technology, 35
(13), 2621–2626.
Berg, M., Stengel, C., Pham, T. K. T., Pham, H. V., Sampson,
M. L., Leng, M., et al. (2007). Magnitude of arsenic
pollution in the Mekong and Red River Deltas —
Cambodia and Vietnam. Science of the Total Environment,
372, 413–425.
Berg, M., Pham, T. K. T., Stengel, C., Buschmann, J., Pham, H.
V., Nguyen, V. D., et al. (2008). Hydrological and
sedimentary controls leading to arsenic contamination of
groundwater in Hanoi area, Vietnam: the impact of iron–
arsenic ratios, peat, river bank deposits, and excessive
groundwater abstraction. Chemical Geology, 249, 91–112.
Bowell, R. J. (1994). Sorption of arsenic by iron oxides and
oxyhydroxides in soils. Applied Geochemistry, 9, 279–286.
Bowen, H. J. M. (1979). Elements in the geosphere and the
biosphere. In H. J. M. Bowen (Ed.), Environmental chemistry
of the elements (p. 239). London: Academic Press.
Environ Monit Assess (2012) 184:4501–4515
Chander, B., Nguyen, T. P. T., & Nguyen, Q. H. (2004).
Random survey of arsenic contamination in tube-well
water of 12 provinces in Vietnam and initially human
health arsenic risk assessment through food chain. Workshop of Science and Technology relating to Arsenic
contamination, Hanoi, Vietnam (16th November, 2004),
16–24.
Chowdhury, U. K., Biswas, B. K., Chowdhury, T. R., Samanta,
G., Mandal, B. K., Basu, G. C., et al. (2000). Ground
water arsenic contamination in Bangladesh and West
Bengal, India. Environmental Health Perspectives, 108
(5), 393–397.
Chunguo, C., & Zihui, L. (1988). Chemical speciation and
distribution of arsenic in water, suspended solids and
sediment of XiangJiang river, China. The Science of the
Total Environment, 77, 69–82.
Harvey, C. F., Swartz, C. H., Badruzzaman, A. B. M., KeonBlute, N., Yu, W., Ali, M. A., et al. (2002). Science, 298,
1602–1606.
Horneman, A., Geen, A. V., Kent, D. V., Mathe, P. E., Zheng, Y.,
et al. (2004). Decoupling of As and Fe release to
Bangladesh groundwater under reducing conditions.Part
I: Evidence from sediment profiles. Geochimica et
Cosmochimica Acta, 68(17), 3459–3473.
Hossain, M. F. (2006). Arsenic contamination in Bangladesh —
an overview. Agriculture, Ecosystem and Environment,
113, 1–16.
Ishiga, H., Dozen, K., Yamazaki, C., Ahmed, F., Islam, M. B.,
et al. (2000). Geological constrains on arsenic contamination of groundwater in Bangladesh. Abstract of 5th Forum
on Asian arsenic contamination, Yokohama, Japan,
RGAG, Saitama, pp. 53–62.
Laurent, C., & David, A. P. (2006). Arsenic in shallow, reducing
groundwater in Southern Asia: an environmental health
disaster. Elements, 2, 91–96.
McArthur, J. M., Banerjee, D. M., Hudson-Edwards, K. A.,
Mishra, R., Purohit, R., et al. (2004). Natural organic matter
in sedimentary basins and its relation to arsenic in anoxic
groundwater: the example of West Bengal and its worldwide
implication. Applied Geochemistry, 19, 1255–1293.
Meharg, A. A., Scrimgeour, C., Hossain, S. A., Fuller, K.,
Cruickshank, K., et al. (2006). Codeposition of organic
carbon and arsenic in Bengal Delta aquifers. Environmental Science & Technology, 40, 4928–4935.
Meng, X. G., & Wang, W. (1998). Speciation of arsenic by
disposable cartridges. Book of Posters of the Third
International Conference on Arsenic Exposure and Health
Effects: Society of Environmental Geochemistry and
Health University of Colorado at Denver
Ministry of Science, Technology and Environment. (2002). TCVN
7183–2002 Domestic supply water-quality requirements.
Nath, B., Sahu, S. J., Jana, J., Mukherjee-Goswami, A., Roy, S.,
Sarkar, M. J., et al. (2008). Hydrochemistry of Arsenicenriched aquifer from rural West Bengal, India: a study of
the arsenic exposure and mitigation option. Water, Air, and
Soil Pollution, 190, 95–113.
Nickson, R. T., McArthur, J. M., Burgess, W. G., Ahmed, K.
M., Ravenscroft, P., & Rahman, M. (1998). Arsenic
poisoning of Bangladesh groundwater. Nature, 395, 338.
Nickson, R. T., McArthur, J. M., Ravenscroft, P., Burgess, W.
G., & Ahmed, K. M. (2000). Mechanism of arsenic release
Environ Monit Assess (2012) 184:4501–4515
to groundwater, Bangladesh and West Bengal. Applied
Geochemistry, 15, 403–413.
Nguyen, K. P., & Itoi, R. (2009). Source and release mechanism
of arsenic in aquifers of Mekong Delta, Vietnam. Journal
of Contaminant Hydrology, 103, 58–69.
Nguyen, V. A., Bang, S., Viet, P. H., & Kim, K. W. (2009).
Contamination of groundwater and risk assessment for
arsenic exposure in Hanam province, Vietnam. Environment International, 35, 466–472.
Phuong, N. M., Kang, Y., Sakurai, K., Iwasaki, K., Kien, C. N.,
Noi, N. V., et al. (2008). Arsenic contents and physicochemical properties of agricultural soils from Red River
Delta, Vietnam. Soil Science and Plant Nutrition, 54(6),
846–855.
Polizzotto, M. L., Kocar, B. D., Benner, S. G., Sampson, M., &
Fendorf, S. (2008). Near-surface wetland sediments as a
source of arsenic release to groundwater in Asia. Nature,
454, 505–508.
Postma, D., Larsen, F., Nguyen, T. M. H., Mai, T. D., Pham, H.
V., Pham, Q. N., et al. (2007). Arsenic in groundwater of
the Red River floodplain, Vietnam: controlling geochemical processes and reactive transport modeling. Geochimica et Cosmochimica Acta, 71, 5054–5071.
Root, T. L., Bahr, J. M., & Gotkowitz, M. B. (2005). Controls
on arsenic concentration in groundwater near Lake
Geneva, Wisconsin. In P. A. O’Day, D. Vlassopoulos, X.
Meng, & L. G. Benning (Eds.), Advances in arsenic
research (pp. 161–174). Oxford University Press: American Chemical Society.
Smedley, P. L., & Kinniburgh, D. G. (2002). A review of the
source, behaviour and distribution of arsenic in natural
waters. Applied Geochemistry, 17, 517–568.
Smith, A. H., Lingas, E. O., & Rahman, M. (2000).
Contamination of drinking-water by arsenic in Bangla-
4515
desh: a public health emergency. Bulletin of the World
Health Organization, 78(9), 1093–1103.
Swartz, C. H., Blute, N. K., Badruzzman, B., Ali, A.,
Brabander, D., et al. (2004). Mobility of arsenic in a
Bangladesh aquifer: interferences from geochemical profiles, leaching data, and mineralogical characterization.
Geochimica et Cosmochimica Acta, 68(22), 4539–4557.
Tanabe, S., Hori, K., Saito, Y., Haruyama, S., Vu, V. P., et al.
(2003). Song Hong (Red River) delta evolution related to
millennium-scale Holocene sea-level changes. Quaternary
Science Reviews, 22, 2345–2361.
Tanabe, S., Saito, Y., Vu, Q. L., Hanebuth, T. J. J., Ngo, Q. L., et
al. (2006). Holocene evolution of the Song Hong (Red
River) delta system, northern Vietnam. Sedimentary
Geology, 187, 29–96.
Tareq, S. M., Safiullah, S., Anawar, H. M., Rahman, M. M., &
Ishizuka, T. (2003). Arsenic pollution in groundwater: a
self-organizing complex geochemical process in the
deltaic sedimentary environment, Bangladesh. The Science
of the Total Environment, 313, 213–226.
Terashima, S. (1984). Determination of arsenic and antimony in
geological materials by automated hydride generation and
electro-thermal atomic absorption spectrometry Bunseki
Kagaku, 33, 561–563 (in Japanese with English summary).
Wang, S. W., Liu, C. W., & Jang, C. S. (2007). Factors
responsible for high arsenic concentrations in two groundwater catchments in Taiwan. Applied Geochemistry, 22,
460–476.
Welch, A. H., Lico, M. S., & Hughes, J. L. (1988). Arsenic in
groundwater of the Western United States. Ground Water,
26, 333–347.
WHO (2008). Guidelines for drinking-water quality. World
Health Organization. />health/dwq/fulltext.pdf. Accessed 01 March 2011.