DSpace at VNU: Study on the frequency of heavy rainfall in Huong Khe district, Ha Tinh province
Bạn đang xem bản rút gọn của tài liệu. Xem và tải ngay bản đầy đủ của tài liệu tại đây (1.43 MB, 12 trang )
VNU Journal of Science: Earth and Environmental Sciences, Vol. 33, No. 2 (2017) 48-59
Study on the Frequency of Heavy Rainfall
in Huong Khe District, Ha Tinh Province
Nguyen Van Loi1, Le Quang Dao2,*, Dong Thu Van2, Pham Lan Hoa2, Le Thanh Tung2
1
2
Center for Water Resources Consultant and Technology Transfer-MARD
Institute for Geological Sciences-Vietnam Academy of Science and Technology
Received 15 March 2017
Revised 15 April 2017; Accepted 28 June 2017
Abstract: Rainfall intensity, duration and frequency of 24 consecutive hours or longer (48h, 72h,
96h) are very essential for the assessment of flood risk and the design of the reservoirs and dams in
Huong Khe district, Ha Tinh province. The analysis of flood-causing rainfall and the actual floods
from 1990 to 2012 has shown that floods usually occur when: a) 24-hour continuous rainfall
reacheds 710.6mm or more; b) Heavy rains which lasted longer than 24 hours and reached
548.9mm/24h to 630.2mm/48h or more; c) Heavy rains lasted from 72 hours to 96 hours and
reached from 534.5mm/72h to 575.6mm/96h. The following conclusions have been drawn from
analysis results of development of the empirical and theoretical exceedance frequencies of Pearson
III distribution of 24h-96h heavy rainfall: a) All the theoretical and empirical frequency data have
very high correlation coefficient from 0.891 (24h rainfall) to about 0.948 (72h-96h rainfall); b) For
24h rainfall, the actual rainfall of the empirical P of 13% to 26% is about 40mm lower than the
theoretical rainfall, while the actual rainfall of the empirical P of 8.7% is about 80mm higher than
the theoretical value, and that of the empirical P of 4.35% is about 175mm higher than the
theoretical value; the actual rainfall at empirical P of 8.7% is corresponding to theoretical P of
4.5%, and actual rainfall at empirical P of 4.35% is corresponding to theoretical P of ~1%; c) For
48h and 72h rainfall, the empirical and theoretical frequency data are very close to each other for
the P in the range of 8.7% to 30%, only empirical P of 4.35% is much far from theoretical one and
corresponding to rainfall frequency of ~1%; d) For 96h rainfall, the empirical and theoretical
frequency data are very close to each other for most P range, only empirical P of 8.7% and 4.35%
are somehow far from theoretical ones and corresponding to rainfall of theoretical frequencies of
~4.5% and ~1%, respectively.
Keywords: Extreme, Frequency, Pearson, Gamma, Kritsky-Menken, Standard deviation, Coefficient of
skewness.
1. Introduction
rain frequently occur in Central Vietnam,
particularly in the North Central region. Two or
three of weather patterns causing heavy rain
such as tropical cyclones, inter tropical
convergence
zone
(ITCZ),
meridional
convergence, cold surges, etc., which are active
simultaneously or consecutively, combined
with regional topography, bring about the
The natural disasters caused by extreme
weather events, including floods due to heavy
_______
Corresponding author. Tel.: 84-902699994.
Email:
/>
48
N.V. Loi et al. / VNU Journal of Science: Earth and Environmental Sciences, Vol. 33, No. 2 (2017) 48-59
typical flooding Central region (Nguyen Khanh
Van, 2009 and 2012) [1, 2]. Huong Khe district
is located in the Southwest of Ha Tinh province
and surrounded with two major mountains: Tra
Son Mountain in the East is a branch of Eastern
Annamite Range extending to the ocean, the
natural boundary with three districts Can Loc Thach Ha - Cam Xuyen; Giang Man Mountain
in the West is a segment of the majestic
Annamite Range, the border with Laos. Huong
Khe district borders Vu Quang, Duc Tho
districts in the North and Quang Binh province
in the South. The topography of this district has
two main types: the mountainous topography
with the average elevation of 1,500 meters is
complicatedly differentiated and strongly
fragmented, forming different ecological zones;
and the midland, hilly topography is the
transition between high mountain and plain,
along the Ho Chi Minh highway. With extreme
weather patterns and fragmented hilly
topography with severe slope, Huong Khe
district often suffers from the heavy floods.
Especially due to the impact of climate change,
a lot of tropical cyclones, and devastating
floods have continuously occurred in the
Central region (Le Van Nghinh and Hoang
Thanh Tung, 2006) [3].
One of the key parameters in assessment of
flood magnitude, in design of reservoirs, in risk
assessment of reservoir failure causing floods in
the downstream area etc. is the rainfall
frequency and magnitude in a certain period of
time corresponding to that frequency. Vietnam
Institute of Meteorology, Hydrology and
Environment in 1999 [4] established a map of
highest one-day rainfall for the Central region
and Central Highlands with the frequency of
1% with data untill 1999. However, with the
avaibility of more new observed data,
especially in the context of the climate change,
the results may not be valid for the present
time. Morever, different values of frequency are
required for different purposes of utilization.
Also, different rainfall durations are required
for different sizes of the area under flood
accessment.
49
Le Van Nghinh (2004) [5] carried out the
warning and prediction of beyond-design floods
for medium and small reservoirs caused by
heavy rainfalls. The study on selection of
design flood criteria for designing emergency
spillway carried out by Pham Ngoc Quy (2006)
[6] indicated the importance of selection of
beyond-design rainfall frequency. Such studies
definitely require different values of frequency
and corresponding rainfall magnitudes, which
are possible expressed through frequency
curves.
Nguyen Anh Tuan (2014) [7] determined
the values of calculated daily rainfall according
to the design frequency in 12 selected
meteorological stations based on the data series
of long actual rainfall from 1960 to 2010, in
which the last time period was supposed to
correspond to the new context of the impact of
climate change, applied to calculate the design
flow of small drainage works on the road in
accordance with current design standard
TCVN9845:2013 and determined the values of
characteristic coefficient of the rain shape for
the selected area in order to calculate the
rainfall intensity corresponding to time of
concentration of the basin and the design
frequency
used
in
the
standard
TCVN9845:2013. Ngo Le An (2016) [8]
studied the details of change in the highest oneday rainfall (used to calculate design flood for
medium and small basins) at some basins in the
Central region and Central Highlands under the
impact of climate change, according to the
statistical method for error correction. Doan Thi
Noi (2016) [9] carried out the study on
temporal characteristics of flood, the analysis of
development of rainfall frequency and
intensity-duration-frequency curves for the
Northern Vietnam in transportation design. The
works' reults are most relevant to the transport
design, and is directly related to the one-day
maximal rainfall only.
Meanwhile, in many cases of study and
design, rainfall intensity, duration and
frequency (IDF), 24h or more (48h, 72h, 96h,
etc.) continuous rainfall are really essential for
50
N.V. Loi et al. / VNU Journal of Science: Earth and Environmental Sciences, Vol. 33, No. 2 (2017) 48-59
the assessment of flood risk and the design of
constructions, including reservoirs and dams.
The paper aims to identify and develop the
heavy rainfall frequencies in Huong Khe
district, Ha Tinh province, which is located just
in the South most of the Northern Vietnam
central plain close to the Ngang mountainous
pass, which is the natural topo-geographical
boundary between Northern and Southern
regions with distinguished heavy rainfalls
(Nguyen Khanh Van, 2012) [2].
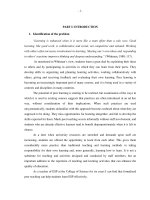
Huong Khe district is located in Ngan Sau
River sub-basin, in Lam River basin (Dang
Dinh Kha et al., 2015) [10] and there is the
meteorological observation station Huong Khe,
level 2 (Figure 1) (but the rainfall measurement
was hourly). In the East and Southeast of this
station, there are two meteorological stations
Ha Tinh and Ky Anh, observing the coastal area
and coastal plains; in the Northwest, there is the
meteorological station Huong Son, observing
the meteorological characteristics of Ngan Pho
River sub-basin. Therefore, in the article, the
analysis of rainfall data in the meteorological
station Huong Khe characterizes the Ngan Sau
River sub-basin.
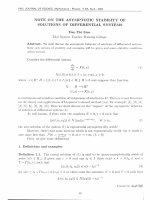
Figure 1. Boundaries between the sub-basins of Lam River basin [3].
N.V. Loi et al. / VNU Journal of Science: Earth and Environmental Sciences, Vol. 33, No. 2 (2017) 48-59
2. The weather patterns causing flood and
the characteristics of flood in the region
The weather patterns causing floods in
Huong Khe – Ha Tinh are integral to those in
the North Central region, including the
following (Nguyen Khanh Van and Bui Minh
Tang, 2004) [11]: tropical cyclones, inter
tropical convergence zone (ITCZ), meridional
convergence and cold surges. According to
Nguyen Khanh Van and Bui Minh Tang (2004),
in the past the flood-causing rainfalls in the
51
region had been occured when there was a
combination of three weather patterns – cool
atmosphere, tropical convergence, with the
following characteristics: 1) heavy rainfall
duration is from 2 days to 8 days; 2) average
duration of a single weather pattern is 2-3 days
and the longest of 4 days; 3) average duration
of the combination of weather patterns of 4-5
days. Accordingly, it is necessary to evaluate
and determine the 48h or longer rainfall.
Table 1. Floods in Nghe An – Ha Tinh, duration of rainfall and exceedance frequency P in Huong Khe
No.
Year
From
To
1995
Flood occurrence
after number of
days from heavy
rain start
Flooding not
occurred
1
1996
12/9
15/9
4
2
2002
19/9
22/9
4
3
2007
6/8
8/8
1
4
2010
01/10
5/10
4
5
2010
15/10
17/10
2
2012
Flooding not
occurred
24h rainfall
(mm)
48h rainfall 72h rainfall 96h rainfall
(mm)
(mm)
(mm)
P (%)
P (%)
P (%)
P (%)
269.3
500.9
538.6
552.6
376.6
13.0
304.7
21.7
710.6
4.3
313.4
~19
548.9
8.7
585.6
13.0
464.7
21.7
946.2
4.3
454.5
~15
630.2
8.7
598.4
13.0
534.5
21.7
1129.4
4.3
461.8
~24
727.5
8.7
698.7
13.0
575.6
17.4
1144.4
4.3
604.8
~15
912.2
8.7
332.9
372.4
395.6
398.7
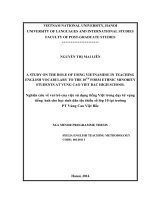
Figure 2. The highest continuous 24h-96h rainfall in Huong Khe district (1990-2012).
52
N.V. Loi et al. / VNU Journal of Science: Earth and Environmental Sciences, Vol. 33, No. 2 (2017) 48-59
Additionally, this paper's authors have
carried out statistical analysis on the temporal
rainfall characteristics of great floods in the
North Central region from 1990 to 2012 and
presented the characteristics of duration and
flood-causing rainfall in the research area
(Table 1 and Figure 2).
It is well-known that in each heavy rain,
rainfall intensity changes temporally and
spatially. Meanwhile flood occurrence is a
combination of many natural factors of
topography, geology, vegetation, etc. and
characteristics of the heavy rain (Geoffrey S.
Dendy, 1987) [12]. Therefore, the conclusions
about the causes of flood only based on the
rainfall distribution of heavy rain are not
complete. However, in the framework of
research with the basis that flood has the close
relationship with rainfall distribution of the
heavy rain, and natural conditions remain
unchanged or play the minor role, according to
the research results of rainfall distribution, it is
possible to draw some following remarks about
the relationship between duration and floodcausing rainfall in Huong Khe district, Ha Tinh:
Flood occurs when the continuous 24h
rainfall reaches 710.6mm (2007) (in 2010
despite the continuous 24h rainfall of 548.9mm,
flood did not occur);
Flood occurs when the heavy rain lasts over
24h with the rainfall of over 548.9mm/24h and
630.2mm/48h (2010) (in 1995 the continuous
48h rainfall was 500,.9mm/48h but flood did
not occur);
Flood occurs when the heavy rain lasts from
72h to 96h with the rainfall of over
534.5mm/72h and 575.6mm/96h (2002) (in
1995 the rainfall of 538.6mm/72h to
552.6mm/96h did not cause the flood).
Thus, it is possible to affirm that the
development of frequency curve of
continuous 24h or longer rainfall has the
practical significance in the assessment of
flood risk in the region.
3. The data and method in development of
rainfall frequency curve in Huong Khe
district, Ha Tinh province
Data
Data used to build the maximum rainfall
frequency of different durations are the hourly
rainfall data measured at the meteorological
station Huong Khe, in Huong Khe district, Ha
Tinh province from 1990 to 2012 that are
managed by National Meteorological Service,
Ministry of Natural Resources and Environment
[13]. This meteorological station belongs to the
level 2 (the moderate detailed monitoring
level), but the rainfall measurement belongs to
level 1 (the most detailed monitoring level)
since the measurment is every hour. The hourly
rainfall data are used to calculate the maximal
rainfall of continuous 24h, 48h, 72h, 96h to
build the rainfall frequency curve.
Empirical cumulative frequency
Cumulative frequency (P), also known as
empirical exceedance frequency is the ratio
between the number of occurrences of random
variable values (rainfall) that are greater than or
equal to the value of xm in a series of n effective
data; the frequency P is determined by the
following formula (Ven Te Chow et al., 1988)
[14]:
mb
P( X xm )
100%
n 1 2b
(1)
where b is the parameter. When b=0.5, it
corresponds to Hazen formula, b=0.3 –
Tregodayev formula, b=0 – Weibull formula,
b=3/8 – Blom formula, b=1/3 – Turkey formula
and b=0.44 – Gringorten formula.
In reality, when conducting the calculation
for the annual maximum value in determining
the number of iterative years (T), U.S. Water
Resources Council in 1981 used the value b=0,
so T=(n+1)/m and P=m/(n+1). In this article,
the authors use this formula in calculating the
empirical frequency P.
N.V. Loi et al. / VNU Journal of Science: Earth and Environmental Sciences, Vol. 33, No. 2 (2017) 48-59
( x ) 1 e ( x )
f ( x)
( )
The extreme value distribution for maximum
rainfall
Extreme value distribution for maximum
rainfall, which belongs to any class of
distribution according to Fisher and Tippet
(1928) (Ven Te Chow et al., 1988), always
converges to one of three types of extreme
values (EV) I, II and III (EVI, EVII, EVIII)
when the data series is long enough. The
properties of extreme value type I, type II and
type III were developed by Gumbel in 1941, by
Frechet in 1927 and by Weibull in 1939,
respectively (Ven Te Chow et al., 1988) [14]. In
1955 Jenkings (Ven Te Chow et al., 1988) [14]
demonstrated that these three types of extreme
value distribution are the specific cases of a
general
distribution
with
probability
distribution function as follows:
1/ k
x u
F ( x) exp 1 k
(2)
where x is the extreme value; k, u and α are
the parameters.
When k=0 corresponding to type I (also
known as Gumbel distribution); k<0
corresponding to type II (also known as Frechet
distribution), then the lower limit of x is (u+
α/k)≤x≤∞; and when k>0 corresponding to type
III, then the upper limit of x is -∞≤x≤(u+ α/k)
(and in this case, the variable -x is called the
Weibull distribution).
In the study on rainfall distribution, the
commonly used distributions are Pearson III
and Kritsky-Menkel for type III and Gumbel for
type I [15]. In this article, Pearson III and
Krisky-Menkel distributions are used to
determine the theoretical rainfall frequency in
Huong Khe – Ha Tinh.
Pearson III distribution
Pearson III probability density function
(also known as 3-parameter Gamma probability
distribution) [14] of the random variable with
value of x has the following form:
53
(3)
where Gamma distribution Γ(β) is defined
as:
( ) u 1e u du
0
(4)
with x ≥ ɛ (the lower limit of random
variable); and three parameters of Gamma
probability distribution are defined as follows:
2
;
Cs
sx
2
; x s x
(5)
where ɛ is the lower limit of random
variable (position parameter); λ is the rate
parameter; β is the shape parameter; x is the
average value; sx is the standard deviation; Cs is
the coefficient of skewness.
n
1 n
x xi ; sx
n i 1
Cv
(x
i 1
i
x) 2
n 1
;
n
sx
n
xi x
; Cs
(n 1)(n 2) i 1 s x
x
(6)
3
where n is the number of samples, Cv is the
coefficient of variation.
When the variable that is greater than
or equal to the value x has the occurrence
exceedance probability P, then x is determined
by the formula:
x INV (1 P, , )
(7)
and conversely, the occurrence exceedance
probability P of the variable that is greater than
or equal to x is determined by the formula:
P( X x) f ( x)dx
x
(8)
54
N.V. Loi et al. / VNU Journal of Science: Earth and Environmental Sciences, Vol. 33, No. 2 (2017) 48-59
Kritsky-Menkel method
The limitation of Pearson III distribution is
when Cs<2Cv, the random variable has negative
value that does not fit the physical significance
of meteorological phenomenon. Accordingly,
Kritsky and Menkel established the revised
probability distribution named Kritsky-Menkel
method (Kritsky S. N. and Menkel M. F., 1967)
[15], using Pearson III probability density
function when Cs=2Cv as the basis. To calculate
the values of x, Kritsky-Menkel built the lookup
table of the value Kp depending on Cs=mCv, P
and Cv. The value of random variable
corresponding to the exceedance frequency P is
calculated according to the formula x= x Kp.
4. The frequency curve of maximum
continuous 24h, 48h, 72h, 96h rainfall in
Huong Khe district, Ha Tinh province
At the hydrometeorological station Huong
Khe, in Huong Khe district, Ha Tinh province,
the rainfall is observed hourly. The data on
hourly rainfall observed at the meteorological
station Huong Khe have been collected. The
continuous 24h, 48h, 72h, 96h rainfall is
calculated by using the moving total method of
hourly skewness and then the maximum
continuous 24h, 48h, 72h, 96h rainfall in the
year is also determined. The rainfall frequency
is determined by above empirical formula (1)
(Ven Te Chow et al., 1988) [14] with the
parameter value b=0. The methodology to
calculate the parameters of Pearson III
empirical and theoretical frequencies has been
applied to each case of the maximum
continuous 24h, 48h, 72h, 96h rainfall. The
parameters of the frequency according to
Pearson III distribution that has been calculated
are average value x , standard deviation sx,
coefficient of skewness Cs, coefficient of
variation Cv, position parameter ɛ, shape
parameter β, and rate parameter λ. The results
of empirical frequency are shown in Table 2
that is the database to develop the Pearson III
theoretical frequency.
By using Pearson III method and applying
the statistical probability according to the
formulas from (5) to (8), the Pearson III
theoretical frequency and the parameters of
distribution as well as statistical probability
presented in Table 3 have been determined. The
empirical
and
theoretical
exceedance
frequencies P of Pearson III distribution of
continuous 24h-96h rainfall are shown in
Figures 3-6.
Table 2. The maximum continuous 24h-96h rainfall and the exceedance probability
Year
24h
rainfall
(mm)
1990
247.8
60.87
259.1
73.91
259.1
82.61
259.1
82.61
1991
236.6
69.57
254.7
82.61
270.2
73.91
277.1
78.26
1992
277.5
39.13
316.3
60.87
337.0
60.87
345.0
56.52
1993
295.2
30.43
404.2
26.09
423.3
30.43
423.9
30.43
1994
254.4
56.52
258.9
78.26
264.5
78.26
309.5
73.91
1995
269.3
47.83
500.9
17.39
538.6
17.39
552.6
21.74
1996
376.6
13.04
585.6
13.04
598.4
13.04
698.7
13.04
1997
221.7
82.61
223.7
91.30
226.7
91.30
236.0
91.30
1998
238.5
65.22
330.3
47.83
383.5
39.13
418.2
34.78
P (%)
48h
rainfall
(mm)
P (%)
72h
rainfall
(mm)
P (%)
96h
rainfall
(mm)
P (%)
N.V. Loi et al. / VNU Journal of Science: Earth and Environmental Sciences, Vol. 33, No. 2 (2017) 48-59
1999
269.5
43.48
298.5
69.57
364.1
47.83
393.6
47.83
2000
236.4
73.91
241.4
86.96
250.5
86.96
252.3
86.96
2001
215.1
86.96
350.5
39.13
377.5
43.48
397.9
43.48
2002
304.7
21.74
464.7
21.74
534.5
21.74
575.6
17.39
2003
214.3
91.30
326.3
52.17
334.3
65.22
335.1
65.22
2005
289.0
34.78
320.2
56.52
342.4
56.52
343.5
60.87
2006
296.2
26.09
303.5
65.22
309.4
69.57
311.9
69.57
2007
710.6
4.35
946.2
4.35
1129.4
4.35
1144.4
4.35
2008
231.5
78.26
382.4
30.43
429.0
26.09
488.7
26.09
2009
139.7
95.65
159.1
95.65
159.3
95.65
159.4
95.65
2010
548.9
8.70
630.2
8.70
727.5
8.70
912.2
8.70
2011
255.2
52.17
330.9
43.48
359.8
52.17
375.9
52.17
2012
332.9
17.39
372.4
34.78
395.6
34.78
398.7
39.13
55
Table 3. The parameters of statistical probability and Pearson III distribution
Average
value
x
Standard
deviation
sx
Coefficient of Coefficient of
skewness Cs variation Cv
24h
293.71
121.29
2.46
48h
375.45
170.94
72h
409.75
96h
436.79
Rainfall
duration
Parameters
Correlation
coefficient R2
Position ɛ
Shape
β
Rate
λ
0.41
194.95
0.66
148.95 0.891
2.01
0.46
170.94
0.99
172.07 0.943
207.49
2.22
0.51
222.56
0.81
230.00 0.932
229.64
1.87
0.53
190.08
1.15
214.37 0.948
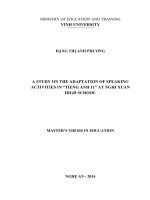
Figure 3. Empirical frequency and Pearson III distribution of continuous 24h rainfall (1990-2012).
56
N.V. Loi et al. / VNU Journal of Science: Earth and Environmental Sciences, Vol. 33, No. 2 (2017) 48-59
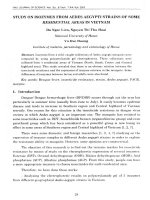
Figure 4. Empirical frequency and Pearson III distribution of continuous 48h rainfall (1990-2012).
Figure 5. Empirical frequency and Pearson III distribution of continuous 72h rainfall (1990-2012).
Figure 6. Empirical frequency and Pearson III distribution of continuous 96h rainfall (1990-2012).
N.V. Loi et al. / VNU Journal of Science: Earth and Environmental Sciences, Vol. 33, No. 2 (2017) 48-59
5. Conclusions and discussions
Based on rainfall duration and intensity in
the period of 1990-2012, the flood-causing
rainfall in Huong Khe, Ha Tinh has the
following characteristics:
- Flood occurs when the continuous 24h
rainfall reaches 710.6mm (2007) or more;
- Flood occurs when the heavy rain lasts
from 24h to 48h with the rainfall of over
548.9mm/24h and 630.2mm/48h (2010);
- Flood occurs when the heavy rain lasts
from 72h to 96h with the rainfall of over
534.5mm/72h and 575.6mm/96h (2002).
This is the basis for the prediction of flood
risk in the region according to the rainfall trend
analysis of heavy rain of under 24h that can
cause flood, or heavy rain of over 24h that does
not cause flood, but can lead to flood in the area
when it continues to last over 24h.
Based on the determination of empirical an
theoretical exceedance frequencies of Pearson
III distribution of continuous 24h-96h rainfall,
it is possible to draw some following remarks
and discussions:
All the theoretical and empirical frequency
data have very high correlation coefficient from
0.891 (24h rainfall) to about 0.948 (72h-96h
rainfall);
- For 24h rainfall, the actual rainfall of the
empirical P of 13% to 26% is about 40mm
lower than the theoretical rainfall, while the
actual rainfall of the empirical P of 8.7% is
about 80mm higher than the theoretical value,
and that of the empirical P of 4.35% is about
175mm higher than the theoretical value; the
actual rainfall at empirical P of 8.7% is
corresponding to theoretical P of 4.5%, and
actual rainfall at empirical P of 4.35% is
corresponding to theoretical P of ~1%
(presented by red arrows in Figure 2). This is
consistent with the actual flooding in the region
when the flood in 2007 is considered the
historic hundred-year flood.
- For 48h and 72h rainfall, the empirical and
theoretical frequency data are very close to each
57
other for the P in the range of 8.7% to 30%,
only empirical P of 4.35% is much far from
theoretical one and corresponding to rainfall
frequency of ~1%;
- For 96h rainfall, the empirical and
theoretical frequency data are very close to each
other for most P range, only empirical P of
8.7% and 4.35% are somehow far from
theoretical ones and corresponding to rainfall of
theoretical frequencies of ~4.5% and ~1%,
respectively.
Furthermore, in accordance with Nguyen
Khanh Van et. al. (2013) [16], there is a certain
relationship between the resonant influences of
topo-geographic conditions in spatial heavy
rainfall patterns in the Coastal Central Region
of Vietnam, it would be a scientific and
practical significance of a study on the different
exceedance frequency distributions of extreme
rainfalls over the areas along N-S direction by
E-W orientation mountain ranges (the Ngang,
the Hai Van and the Ca mountainous passes).
References
[1] Nguyen Khanh Van, 2009. Project report: Study
on causes and occurrence mechanism of floodcausing rain and unseasonal heavy rain –
recommendation of solutions for disaster control
and mitigation in Central Vietnam. Institute of
Geography – Vietnam Academy of Science and
Technology.
[2] Nguyen Khanh Van, 2012. Role of topogeographical conditions in the North Central
region and the difference of heavy rain between
North and South of Ngang Pass. Vietnam Journal
of Earth Sciences. Vol. 34 (1), 2012, pp. 38-46.
[3] Le Van Nghinh and Hoang Thanh Tung, 2006.
Solutions for flood control and mitigation in the
Central region. Journal of Water Resources and
Environmental Engineering. No. 14 (8/2006), pp.
44-47.
[4] Vietnam Institute of Meteorology, Hydrology and
Environment, 1999. Final report of project: the
establishment of map of maximum one-day
rainfall for Central Coast and Central Highlands
until 1999. Ministry of Natural Resources and
Environment.
58
N.V. Loi et al. / VNU Journal of Science: Earth and Environmental Sciences, Vol. 33, No. 2 (2017) 48-59
[5] Le Van Nghinh, 2004. The problem of warning
and prediction of beyond-design floods for
medium and small reservoirs. Journal of Water
Resources and Environmental Engineering. No. 7V (11/2004), pp. 98-104.
[6] Pham Ngoc Quy, 2006. Recommendation of
design flood criteria for designing emergency
spillway. Journal of Water Resources and
Environmental Engineering. No. 12 (3/2006), pp.
8-11.
[7] Nguyen Tuan Anh, 2014. Studying the
determination of a number of rain parameters to
make contributions to completing the formula of
design flow of small sized drain works on road
under the climatic conditions of Vietnam. Ph.D.
thesis. Hanoi university of transportation.
[8] Ngo Le An, 2016. Changing trends in annual
maximum daily precipitation in Central –
Highland regions in context of climate change.
Journal of Water Resources and Environmental
Engineering. No.52 (3/2016), pp. 77-84.
[9] Doan Thi Noi, 2016. Study on flooding variation
and scientific basis for flood calculation for
transportation in the Northeast region of Vietnam.
PhD Thesis. Water Resources University.
[10] Dang Dinh Kha, Tran Ngoc Anh and Mai Thi
Nga, 2015. Application of WEAP model to
integrated water balance in Lam River basin.
[11]
[12]
[13]
[14]
[15]
[16]
Journal of Science: Natural Sciences and
Technology. Vol. 31, No. 3S (2015), pp. 186-194.
Nguyen Khanh Van, Bui Minh Tang, 2004. The
characteristics of weather patterns causing heavy,
serious rain and flood in Thanh Hoa, Nghe An, Ha
Tinh provinces, from 1997 to 2001. Vietnam
Journal of Earth Sciences. Vol. 26 (1), pp. 50-59.
Geoffrey S. Dendy, 1987. A 24-hour rainfall
distribution and peak rate factors for use in
Southwest Florida. USA.
National Centre for Hydro-Meteorological
Forecasting – Ministry of Natural Resources and
Environment.
The
hydrometeorological
observation data in Ha Tinh.
Ven Te Chow, David R. Maidment, Larry W.
Mays, 1988. Applied Hydrology. McGraw-Hill
Inc.
Kritsky S. N. and Menkel M. F., 1967. Principles
of estimation methods of maximum discharge.
Floods and their computation. Proceedings of the
Leningrad Symposium. August 1967. Vol. 1, pp.
29-40.
Nguyen Khanh Van, Tong Phuc Tuan, Vuong
Van Vu, Nguyen Manh Ha, 2013. The heavy rain
differences in the Coastal Central Region of
Vietnam from Thanh Hoa to Khanh Hoa based on
topo-geographical analyze. Vietnam Journal of
Earth Sciences. Vol. 35 (4), 2013, pp. 301-309.
Nghiên cứu tần suất mưa lớn khu vực huyện Hương Khê
tỉnh Hà Tĩnh
Nguyễn Văn Lợi1, Lê Quang Đạo1, Đông Thu Vân2,
Phạm Lan Hoa2, Lê Thanh Tùng2
1
Trung tâm Tư vấn và Chuyển giao công nghệ Thuỷ lợi-TC TL-Bộ NNPTNT
2
Viện Địa chất-Viện Hàn lâm Khoa học và Công nghệ Việt Nam
Tóm tắt: Cường độ mưa theo thời đoạn mưa, tần suất mưa và lượng mưa liên tục 24h hoặc dài
hơn (48h, 72h, 96h) là rất cần thiết cho các công tác đánh giá nguy cơ lũ lụt và thiết kế các công trình
hồ đập khu vực huyện Hương Khê tỉnh Hà Tĩnh. Các kết quả phân tích đặc trưng mưa gây lũ và thực
tế lũ lụt tại khu vực từ năm 1990 đến 2012 cho thấy khu vực xảy ra lũ lụt khi: a) Mưa liên tục 24h đạt
tới 710,6mm; b) Mưa lớn kéo dài liên tục trên 24h với lượng mưa đạt tới trên 548,9mm/24h và tới
630,2mm/48h; c) Thường xảy ra lũ lụt khi mưa lớn kéo dài trên 72h đến 96h, với lượng mưa đạt tới
trên 534,5mm/72h và tới 575,6mm/96h. Kết quả phân tích xây dựng đường tần suất (P) vượt thực
nghiệm và tần suất lý luận Pearson III mưa lớn liên tục 24h-96h cho kết quả: a) Tất cả các đường tần
N.V. Loi et al. / VNU Journal of Science: Earth and Environmental Sciences, Vol. 33, No. 2 (2017) 48-59
59
suất vượt lý luận và thực nghiệm có hệ số tượng quan rất chặt chẽ, thấp nhất là 0,891 (mưa liên tục
24h) và tới khoảng 0,948 (mưa liên tục 72h-96h); b) Đối với mưa liên tục 24h, lượng mưa thực tế ở
các P thực nghiệm từ 13% đến 26% thấp hơn lượng mưa lý luận khoảng 40mm, trong khi đó lượng
mưa thực tế ở các P thực nghiệm 8,7% cao hơn lượng mưa lý luận khoảng 80mm, và ở P thực nghiệm
4,35% cao hơn khoảng 175mm; lượng mưa ở P thực nghiệm 8,7% tương đương với P lý luận ~4,5%
và lượng mưa ở P thực nghiệm 4,35% tương đương với P lý luận ~1%; c) Đối với mưa liên tục 48h và
72h, các đường tần suất lý luận và thực tiễn rất gần nhau ở dải giá trị 8,7% đến 30%, chỉ riêng P thực
nghiệm 4,35% nằm lệch tương đối lớn và tương ứng với lượng mưa tần suất lý luận ~1%; d) Đối với
mưa 96h, các đường tần suất lý luận và thực tiễn cũng rất gần nhau ở mọi dải giá trị, chỉ riêng P thực
nghiệm 8,7% và 4,35% nằm lệch tương đối lớn, và tương ứng với lượng mưa tần suất lý luận ~4,5%
và ~1%.
Từ khóa: Cực trị, tần suất, Pearson, Gamma, Kritsky-Menken, độ lệch chuẩn, hệ số thiên lệch.