DSpace at VNU: Anion separations with pressure-assisted capillary electrophoresis using a sequential injection analysis manifold and contactless conductivity detection
Bạn đang xem bản rút gọn của tài liệu. Xem và tải ngay bản đầy đủ của tài liệu tại đây (292.73 KB, 8 trang )
3000
Thanh Duc Mai1,2
Peter C. Hauser1
1
Department of Chemistry,
University of Basel, Basel,
Switzerland
2
Centre for Environmental
Technology and Sustainable
Development (CETASD), Hanoi
University of Science, Hanoi,
Viet Nam
Received January 27, 2011
Revised January 15, 2011
Accepted January 29, 2011
Electrophoresis 2011, 32, 3000–3007
Research Article
Anion separations with pressure-assisted
capillary electrophoresis using a sequential
injection analysis manifold and contactless
conductivity detection
It is demonstrated that a hydrodynamic flow superimposed on the mobility of analyte
anions can be used for the optimization of analysis time in capillary zone electrophoresis.
It was also possible to use the approach for counter-balancing the electroosmotic flow
and this works as well as the use of surface modifiers. To avoid any band-broadening due
to the bulk flow narrow capillaries of 10 mm internal diameter were employed. This was
enabled by the use of capacitively coupled contactless conductivity detection, which does
not suffer from the downscaling, and detection down to between 1 and 20 mM for a range
of inorganic and small organic anions was found feasible. Precisely controlled hydrodynamic flow was generated with a sequential injection manifold based on a syringe
pump. Sample injection was carried out with a new design relying on a simple piece of
capillary tubing to achieve the appropriate back-pressure for the required split-injection
procedure.
Keywords:
Anions / Capacitively coupled contactless conductivity detection (C4D) /
Electroosmotic flow compensation / Pressure-assisted capillary electrophoresis
(PACE) / Sequential injection analysis (SIA)
DOI 10.1002/elps.201100200
1 Introduction
In CZE electrophoretic separation and/or analysis time can
be optimized by the adjustment of the applied voltage and/
or the capillary length. However, there are limits due a
restriction of the high-voltage range, Joule heating effects,
and the possible need for manual mechanical manipulations. The EOF is another parameter that usually needs to be
controlled by using buffers of appropriate pH and ionic
strength and often an additive is included for dynamic
coating of the capillary wall to achieve passivation or reversal
of the surface charges. Adjustments require careful reconditioning of the capillaries. Much effort has been spent for
the development of such coating procedures for the
modification of the EOF [1]. Semi-permanent [2] and
permanent [3–5] coating procedures are used but are
elaborate and time-consuming, and necessitate an exchange
of capillaries when requirements change.
Correspondence: Professor Peter C. Hauser, Department of
Chemistry, University of Basel, Spitalstrasse 51, 4056 Basel,
Switzerland
E-mail:
Fax: 141-61-267-1013
In principle, the incorporation of a hydrodynamic flow
can be used as an additional variable which may be used for
control of the residence time to improve the separation
efficiency and/or analysis time, as well as for the compensation of EOF. This does not require a modification of the
composition of a buffer and the associated capillary reconditioning and may be easily controlled and reversed electronically. However, despite its potential, other than for
some specialized applications using pressurized systems
such as coupling CE to MS and for CEC, there are
only a few reports on employing hydrodynamic flow for
controlling the residence time [6–8]. The reason for this is
the fact that the laminar flow introduced by conventional
pumping tends to lead to additional bandbroadening. The
high separation efficiencies that can be obtained with CE are
indeed frequently attributed precisely to the absence of
laminar flow.
For anions (without the use of a modifier to reverse the
EOF), the influence of laminar flow induced dispersion on
separation efficiency (given as theoretical plate height, H)
can be expressed as the second term of the following
equation, which is an extension of the original version
proposed by Grushka [9]:
H¼
Abbreviation: SIA, sequential-injection analysis
& 2011 WILEY-VCH Verlag GmbH & Co. KGaA, Weinheim
2D
d2 v2HD
1
vEP À vEOF 1vHD 24DðvEP À vEOF 1vHD Þ
ð1Þ
www.electrophoresis-journal.com
CE and CEC
Electrophoresis 2011, 32, 3000–3007
where D is the diffusion coefficient of the analyte and d the
inner capillary diameter; vEP, vEOF and vHD are the electrophoretic velocity of the analyte ion, the EOF velocity and
hydrodynamic flow velocity, respectively. Little quantitative
experimental data are available, but Kutter and Welsch
reported a study on the use of counterpressure to prevent
UV-absorbing auxiliary reagents from reaching the detector
[10], which confirmed that for capillaries of 50 and 75 mm
internal diameter, the imposition of a hydrodynamic flow
generally results in a significant deterioration in theoretical
plate numbers.
Electrodispersion, arising from differences in electrophoretic mobility between analyte ions and buffer ions, is
another factor causing band broadening. If this is the
dominating contribution, the triangular peak shapes typical
for capillary electrophoresis are the result. Detailed studies
on electromigration dispersion have been reported by
different authors [11–16].
In the presence of hydrodynamic flow, there are therefore three contributions to bandbroadening: longitudinal
diffusion, laminarity of flow and electromigration dispersion. Due to the quadratic contribution of the diameter in
the second term of Eqn (1), it can be expected though that
any effect of the laminar flow may be significantly reduced
by using very narrow capillaries. This, however, is not
readily possible with the standard detection technique of
optical absorption as the accompanying reduction in optical
pathlength leads to a significant loss in sensitivity, and the
required reduction in aperture would increase detector noise
and pose significant challenges in the manufacturing and
alignment of a cell.
On the other hand, it has been shown that capacitively
coupled contactless conductivity detection (C4D) can be used
with narrow capillaries of 10 mm without severe penalty in
sensitivity [17, 18]. The construction of such a measuring cell
is also much less demanding than that of an optical cell as the
external tubular electrodes need to be aligned with the outer
diameter (typically 365 mm) only, not with the inner diameter
of the capillaries. A discussion of the various applications of
C4D for CE can be found in recent reviews [19–23], whereas
fundamental details may be gleaned from [20, 24–29]. Ross
has demonstrated a scheme termed gradient elution moving
boundary electrophoresis (GEMBE) in which a pressurized
electrophoresis system was used in combination with C4D
[30, 31], and it has indeed been demonstrated also very
recently by the current authors that for the separation of
cations in zone electrophoresis with quantification by C4D
using 10 mm capillaries, the superimposition of hydrodynamic flow may be used with advantage [32]. By pumping
with the mobility of the ions, the analysis time may be
shortened, or by pumping against the mobility of the ions
their residence time in the field may be extended, and thus
the separation be improved. The detection limits were not
significantly lower than those obtained with larger diameter
capillaries, whereas the separation efficiency was strongly
improved for the 10 mm capillary compared with the capillaries of a more standard diameter of 75 mm [32].
& 2011 WILEY-VCH Verlag GmbH & Co. KGaA, Weinheim
3001
For controlled creation of hydrodynamic flow, a
sequential-injection analysis (SIA) manifold based on a
syringe pump and a multi-position valve was employed [32].
This is an attractive means for automation, extension and
miniaturization of CE. Applications of the SIA-CE combination are summarized in [33]. Recently, Mai et al. also used
an SIA-CE-C4D system for unattended monitoring applications [34]. Herein, a study of pressurization of a CE-C4D
system in the analysis of inorganic and small organic anions
using an SIA manifold and a 10-mm capillary is reported.
2 Materials and methods
2.1 Chemicals and materials
All chemicals were of analytical or reagent grade and were
purchased from Fluka (Buchs, Switzerland) or Merck
(Darmstadt, Germany). Stock solutions of 10 mmol/L were
used for the preparation of the standards of inorganic and
organic anions, using their respective sodium salts, except
for ascorbate, which was prepared directly from ascorbic
acid. Before use, the capillary was preconditioned with 1 M
NaOH for 10 min and deionized water for 10 min prior to
flushing with buffer. Deionized water purified using a
system from Millipore (Bedford, MA, USA) was used for the
preparation of all solutions. A sample of a carbonated soft
drink containing some fruit juice and a vitamin C
supplement tablet were purchased from local shops in
Basel, Switzerland. The beverage sample was prepared by
filtering with a 0.02-mm PTFE membrane filter (Chromafil
O-20/15 MS, Macherey-Nagel, Oensingen, Switzerland),
then diluting with deionized water and ultra-sonicating for
10 min. The same sample pre-treatment procedure was also
applied to the vitamin tablet that had been dissolved in
deionized water.
2.2 Instrumentation
The instrument was a slightly modified version of a previous
design and more details may be found in the earlier
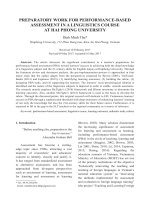
publication [34]. A simplified diagram is given in Fig. 1. The
SIA section consisted of a syringe pump (Cavro XLP 6000)
fitted with a 1-mL syringe and a six-port channel selection
valve (Cavro Smart Valve; both purchased from Tecan,
Crailsheim, Germany). A purpose-made interface, similar to
the one originally described in [35], is used for the
connection of the capillary to the SIA system. The stop
valves at the outlet of the interface were obtained from
¨mligen, Switzerland). The
NResearch (HP225T021, Gu
fluidic pressure was monitored in-line with a sensor from
Honeywell (24PCFFM6G, purchased from Distrelec, Uster,
Switzerland). A dual polarity high-voltage power supply
(Spellman CZE2000, Pulborough, UK) with 730 kV maximum output voltage and polyimide coated fused silica
capillaries of 365 mm od and 10 mm id (from Polymicro,
www.electrophoresis-journal.com
3002
Electrophoresis 2011, 32, 3000–3007
T. D. Mai and P. C. Hauser
Separation Capillary
Standards
Water
1 M NaOH
Pt
Pressure
Sensor
Pressurisation
Tubing
V1
Separation
Buffer
Syringe
Pump
C4 D
Pt
HV
+/-
Holding
Coil
Sample
V2
W
Grounded
interface
W
Buffer vial
T-connector
Phoenix, AZ, USA) were used for all experiments. Detection
was carried out with a C4D system built in-house; details can
also be found elsewhere [36]. An e-corder 201 dataacquisition system (eDAQ, Denistone East, NSW, Australia)
was used for recording the detector signals.
2.3 Operation
All operations, including capillary conditioning, flushing,
hydrodynamic sample aspiration and injection, pressurization as well as separation and data acquisition were
implemented automatically. The programming package
LabVIEW (version 8.0 for Windows XP, from National
Instruments, Austin, TX, USA) was used to write the control
code. Details on the typical procedures can be found in the
previous publication [34]. Briefly, for creating a hydrodynamic flow through the capillary during separation and for
flushing, both stop-valves (designated as V1 and V2 in
Fig. 1) are closed while advancing the stepper motor-driven
syringe pump by appropriate increments. Hydrodynamic
injection is carried out by pumping a defined sample plug
past the capillary inlet in the SIA-CE interface while partially
pressurizing the manifold by closing only V2. Flushing of
the interface is achieved by opening V1 (or both stop valves).
Separation is performed by application of the high-voltage of
appropriate polarity at the detector end, while the injection
end remains grounded at all times. C4D is not affected by
this reversal of the usual arrangement.
W
Safety cage
Figure 1. Schematic drawing of the SIA-CEC4D-system for pressure-assisted capillary
electrophoresis. C4D: contactless conductivity detector; HV: high-voltage power supply;
W: waste; V1, V2: stop valves.
the capillary inlet. Previously, a micrograduated valve was
used for controlled partial pressurization [34]. A new and
simpler approach was developed, which is, as shown in
Fig. 1, based on the use of a piece of tubing of defined
diameter and length to set the backpressure. The dimensions required for the pressurization tubing can be worked
out using the well-known Poiseuille equation, which relates
the flow rate with pressure drop and length and diameter of
a tubing. Knowing the length of the sample plug passed
from the SI manifold through the interface and its flow rate,
as well as the length and diameter of the separation
capillary, the pressure required for injection of a desired
length of a secondary sample plug into the capillary can be
calculated. As the pressure at the inlet is determined by the
backpressure created by the flow through the pressurization
tubing (the flow through the separation capillary itself can
be neglected because of the large splitting ratio), a second
application of Poiseuille’s equation leads to the required
dimensions. Using this approach, it was found that for a
PEEK tubing of 0.007 in. id, a length of about 35 cm was
required to inject a 1-cm plug into a capillary of 50 cm
length and 10 mm id. Note that the presence of a pressure
sensor at the SI-CE interface allows to monitor not only the
injection but also the application of any hydrodynamic flow
during separation as the resulting flow can always be
calculated using Poiseuille’s equation. A verification can be
obtained by injecting a plug of water into the separation
buffer as this will lead to a signal in C4D. Note that
subsequently pressure values are quoted instead of flow
rates for some of the procedures, as this is the more directly
measurable experimental parameter.
3 Results and discussion
3.1 Pressurization for hydrodynamic injection
3.2 Effect of hydrodynamic flow on peak width
The transfer of a sample plug into the capillary is carried out
hydrodynamically to avoid a sampling bias, which would be
inherent with the more easily implemented electrokinetic
injection method. However, the sample volumes employed
in CE are in the nanoliter range, which is too little for direct
handling with the SI manifold. Therefore, only part of the
dispensed sample plug is injected into the separation tubing
using a split-injection procedure carried out by creating a
backpressure in the interface while pumping the plug past
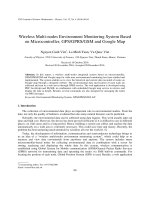
The influence of the hydrodynamic flow on the peak shape
of a small anion, namely oxalate, is illustrated in Fig. 2. The
running buffer used for this experiment is composed of
tris(hydroxymethyl)aminomethane (Tris) and 2-(cyclohexylamino)ethanesulfonic acid (CHES), has a pH 8.4 and is
found to be suitable for detection with C4D. A positive
separation voltage was applied at the detector end and no
EOF modifier was added. At the relatively high pH, a strong
EOF is therefore present towards the injection side, while
& 2011 WILEY-VCH Verlag GmbH & Co. KGaA, Weinheim
www.electrophoresis-journal.com
CE and CEC
Electrophoresis 2011, 32, 3000–3007
A
50 mV
850
900
950
1000
1050
1100
500
550
600
650
700
750
B
C
300
350
400
450
500
550
D
3003
leads to significantly sharpened peaks. One may argue that
this is simply due to a faster movement of the peak through
the detector.
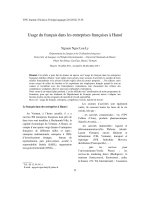
For a more detailed examination, the same experiments
were also carried out with chloride (fast electrophoretic
mobility) and formate (electrophoretic mobility smaller than
that of oxalate). The numbers of theoretical plates (N) were
then calculated from the peaks as a numerical measure for
peak width for different superimposed hydrodynamic flow
velocities. The quantitative data are shown in Fig. 3. Note
that in the absence of hydrodynamic flows and for flow rates
smaller than 0.015 cm/s, formate is not detected as the EOF
rate towards the injection end is larger than its electrophoretic velocity; thus, no data could be obtained. For all
three anions, poor efficiencies are observed for no hydrodynamic flow or small flow rates below 0.1 cm/s, whereas
significant improvements can be achieved at higher velocities. The curves show a maximum, indicating that the
effect is not merely due to a faster movement of the ion
plugs through the detector cell.
3.3 Separation of fast inorganic anions
150
200
250
300
350
E
0
50
100
150
200
250
300
Migration time (s)
Figure 2. Electropherograms of oxalate (200 mM) obtained with
different hydrodynamic flow velocities at relatively high pH.
(A) Flow rate 5 0 cm/s; (B) flow rate 5 0.030 cm/s; (C) flow
rate 5 0.062 cm/s; (D) flow rate 5 0.105 cm/s; (E) flow
rate 5 0.314 cm/s. CE conditions: leff 5 35 cm; E 5 400 V/cm;
BGE: Tris 70 mM and CHES 70 mM, pH 8.4. Negative high
voltage applied at the detector end.
the oxalate anion migrates electrophoretically towards the
detector end of the capillary. As can be seen from trace (A)
of the figure, without the imposition of hydrodynamic flow,
oxalate arrives very late at the detector as it is strongly
retarded by the EOF going in the opposite direction. The fact
that the peak shows a pronounced triangular shape indicates
that electrodispersion is the predominant factor responsible
for peak broadening. The other traces of Fig. 2 were
recorded with increasing increments of hydrodynamic flow
towards the detector end. The triangular peak shapes are
retained, which clearly shows that for the conditions
employed the bulk flow imposed does not lead to any
significant added band-broadening due to laminarity. It is
also evident that the introduction of hydrodynamic flow does
not only cause the peak to reach the detector earlier but also
& 2011 WILEY-VCH Verlag GmbH & Co. KGaA, Weinheim
Most inorganic anions are present in their charged forms
even at low pH value. In fused silica capillaries, the EOF is
small under acidic conditions. This means that the
separation of strong electrolyte anions in CE is often
possible without the use of an EOF modifier (while applying
a positive separation voltage at the detector end). In this
case, a superimposed hydrodynamic flow may be utilized
during separation to accelerate the movement of anions of
relatively slow mobilities to speed up the analysis. In Fig. 4,
the separation of a range of inorganic anions of fast and
40000
Formate
35000
Number of theoretical plates (N)
100
30000
Chloride
25000
Oxalate
20000
15000
10000
5000
0
0.0
0.1
0.2
0.3
0.4
0.5
0.6
Hydrodynamic flow rate (cm/s)
Figure 3. Number of theoretical plates versus superimposed
hydrodynamic flow velocity for different anions. Analytes
(200 mM): chloride, oxalate and formate in deionized water.
Other conditions as for Fig. 2.
www.electrophoresis-journal.com
3004
Electrophoresis 2011, 32, 3000–3007
T. D. Mai and P. C. Hauser
relatively slow electrophoretic mobilities under an EOFsuppressed condition at pH 4 and no superimposed
hydrodynamic flow is shown. As can be seen from trace
(a) of (A), five of the ions are just baseline separated in a
relatively short time, while two of the ions, namely
dihydrogenphosphite and dihydrogenphosphate arrive late
while being well separated from each other and the other
ions. Note that negative going peaks, as observed for
phosphate under the conditions employed, is a normal
feature of C4D. In (B) of Fig. 4 the pressures as measured at
the injection end of the capillary during separation are
shown, and remained at 0 bar for measurement (a). The
application of a hydrodynamic flow right from the start of
the separation in this case would not be possible as then the
five fast ions could not be separated adequately. However,
the SIA manifold allows precisely controlled addition of
hydrodynamic flow at any time during the separation, and
as shown in electropherogram (b) it is thus possible to push
along the late peaks by activation of pressure at 125 s (see
Fig. 4B) to achieve a significant reduction in analysis time.
If only the more slowly moving anions are of interest, a
different mode of operation is also possible. A very fast
analysis of the two late species can be achieved by a reversal
of the applied voltage in combination with the employment
of pressure to create a hydrodynamic flow to counter the
electrophoretic movement of anions. This situation is illustrated in electropherogram (c) of Fig. 4A. The analytes,
though migrating electrophoretically towards the injection
end, are pushed hydrodynamically to the detector. With the
application of an appropriate pressure, only the more slowly
migrating anions are pushed towards the detector while the
faster ones are lost towards the injection end. Note that the
peak order is swapped.
3.4 Separation of slow organic anions
A
2
20 mV
34
5
1
6
a
2
34
7
5
1
6
b
7
6
c
7
50
B
100
150
200
250
300
350
The separation of weak organic anions, such as carboxylates,
with CE has to be implemented at a relatively high pH to
assure complete dissociation. Under those conditions the
EOF is strong, and an EOF modifier is usually added to
obtain parallel electrophoretic and EOFs. Otherwise, unduly
slow separations would result where the anions are swept
towards the detector by the EOF against their electrophoretic
mobility. As shown by the electropherogram (A) of Fig. 5, it
is perfectly well possible to employ a hydrodynamic flow to
balance the EOF. A buffer based on Tris/CHES at pH 8.4
was employed and a pressure of 2.8 bar was applied during
the separation (positive voltage applied at the detection end).
For comparison, the separation of the same standard
mixture of carboxylates was also carried out using the
A
4
1 2
3
5
6
50 mV
7 8 9 10
11
P (bar)
Pc
3
B
Pb
2
1
2
4
3
5
6
7
1
8 9
10
11
Pa
0
50
100
150
200
250
300
350
Time (s)
Figure 4. Separation of inorganic anions with normal and
pressure-assisted CZE. (A) Electropherograms and (B) pressure
at the injection end of the capillary. (a) Normal CZE (Pa 5 0 bar);
(b) CE with pressure assistance (Pb) and with negative voltage
applied at the detector end; (c) CE with pressure assistance (Pc)
and with reversed applied voltage. CE conditions: leff 5 25 cm;
E 5 400 V/cm; BGE: His 12 mM adjusted to pH 4 with acetic acid.
–
Anions: (1) ClÀ (100 mM); (2) S2O2–
3 (100 mM); (3) NO3 (100 mM);
2–
À
À
(4) SO4 (100 mM); (5) NO2 (100 mM); (6) H2PO3 (400 mM) and
(7) H2POÀ
4 (400 mM).
& 2011 WILEY-VCH Verlag GmbH & Co. KGaA, Weinheim
100
200
300
400
500
600
Migration time (s)
Figure 5. Separations of organic anions. (A) Pressure-assisted
CZE with P 5 2.8 bar. (B) Normal CZE using CTAB (0.1 mM) in the
BGE as EOF modifier. Anions: (1) oxalate; (2) malonate;
(3) formate; (4) succinate; (5) carbonate; (6) acetate; (7) lactate;
(8) salicylate; (9) benzoate; (10) sorbate; (11) gluconate (all
200 mM). Other conditions as for Fig. 2.
www.electrophoresis-journal.com
CE and CEC
Electrophoresis 2011, 32, 3000–3007
conventional approach by inclusion of CTAB (0.1 mM) as
EOF modifier in the buffer, without the application of
hydrodynamic flow. Except for some difference in total
analysis time (which could be matched by the optimization
of hydrodynamic flow rate and/or CTAB concentration),
very similar results were obtained.
3.5 Concurrent separation of inorganic and organic
anions using a pressure step
3.6 Quantification and samples
The reproducibility of the pressure-assisted method for
anion determination and suitability for quantification was
then evaluated. This was carried out by acquiring statistical
data for a standard mixture consisting of 15 anions (as for
the previous section, but omitting nitrite) and using a fixed
hydrodynamic flow at 2.4 bar. The data are summarized in
A
3
In the separation of mixtures of fast and slow anions with
EOF reversal by using an additive in the buffer, or by EOF
compensation with a constant hydrodynamic flow, the
situation can arise that the peaks for the fast ions are close
to each other, but those for the slow ions are unduly
extending the analysis time. In other words, slow organic
acids require stronger measures to adequately overcome the
EOF than inorganic anions with fast electrophoretic mobilities. This situation is illustrated by electropherogram (A) of
Fig. 6 for a mixture of 16 inorganic and organic anions. There
is a similarity to the circumstances represented by electropherogram (A) of Fig. 4, but here EOF compensation by
applying a constant pressure of 1.7 bar is already in place to
an extent that will give an analysis time as short as possible
without compromising resolution. As can be seen from
electropherogram (B) of Fig. 6, a higher hydrodynamic flow
at 2.4 bar will lead to significant shortening of the separation
time, but at the expense of a loss of baseline resolution for the
early peaks for nitrate and nitrite. The solution is to use a
change in hydrodynamic flow rate during the separation.
Optimized conditions with a pressure increase from 1.7 to
2.4 bar after 240 s led to the electropherogram given as trace
(C) of Fig. 6 which gives baseline resolution for all peaks at a
relatively short total analysis time.
3005
45
7
8
50 mV
9
6
12
10
B
11 12 13
5
2
C
3 4
1
100
2
200
5
7 9
8
6
15 16
9
7
3 4
14
8
1
6
10
120
160
200
111213
14 15 16
240
280
10
12
11 13
14 1516
300
400
500
600
700
800
Migration time (s)
Figure 6. Concurrent separation of fast and slow anions using a
pressure step. (A) P 5 1.7 bar from t 5 0 s; (B) P 5 2.4 bar from
t 5 0; (C) P1 5 1.7 bar from t1 5 0 s, P2 5 2.4 bar from t2 5 240 s. CE
conditions: leff 5 35 cm; E 5 400 V/cm; BGE: His 90 mM and MES
90 mM. Anions (200 mM): (1) chloride; (2) nitrate; (3) nitrite;
(4) sulfate; (5) oxalate; (6) formate; (7) malonate; (8) succinate;
(9) citrate; (10) acetate; (11) lactate; (12) salicylate; (13) benzoate;
(14) sorbate; (15) ascorbate; (16) gluconate.
Table 1. Calibration ranges, LOD and reproducibility for the determination of anions with pressure-assisted CE
Anions
Range (mM)a)
Correlation coefficient, r
LODb) (mM)
RSD% residence time (n 5 4)
RSD% peak area (n 5 4)
ClÀ
NOÀ
3
SO2À
4
Oxalate
Formate
Malonate
Succinate
Citrate
Acetate
Lactate
Salicylate
Benzoate
Sorbate
Ascorbate
Gluconate
3–200
3–200
1.5–100
1.5–200
6–200
6–200
6–200
3–200
6–200
6–200
12–200
12–200
12–200
50–800
50–800
0.9989
0.9994
0.9998
0.9991
0.9990
0.9998
0.9996
0.9993
0.9992
0.9996
0.9989
0.9997
0.9995
0.9967
0.9976
1.3
1.3
0.6
0.6
2.5
2.5
2.8
1.3
2.5
2.3
5.0
5.3
5.5
20
15
1.0
1.1
1.0
0.9
0.9
1.0
0.9
1.3
1.3
1.2
1.5
1.4
1.4
1.6
1.6
3.4
3.3
3.8
3.7
3.8
4.1
4.0
3.9
3.5
3.5
4.5
4.9
4.9
5.6
5.5
Conditions: leff 5 35 cm; E 5 400 V/cm; BGE: His 90 mM and MES 90 mM; P 5 2.4 bar.
a) Five concentrations.
b) Based on peak heights corresponding to three times the baseline noise.
& 2011 WILEY-VCH Verlag GmbH & Co. KGaA, Weinheim
www.electrophoresis-journal.com
3006
Electrophoresis 2011, 32, 3000–3007
T. D. Mai and P. C. Hauser
A
The authors thank the Swiss National Science Foundation
for funding (Grant No. 200021-129721/1).
4
100 mV
The authors have declared no conflict of interest.
1
2
5
3
6
7
5 References
B
[1] Melanson, J. E., Baryla, N. E., Lucy, C. A., TRAC Trends
Anal. Chem. 2001, 20, 365–374.
8
[2] Baryla, N. E., Lucy, C. A., J. Chromatogr. A 2002, 956,
271–277.
100
150
200
250
300
Migration time (s)
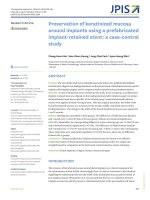
Figure 7. Determination of anions in samples using pressureassisted CE. (A) Soft drink and (B) vitamin C supplement. CE
conditions: leff 5 35 cm; E 5 400 V/cm; BGE: His 90 mM and MES
90 mM; P 5 2.4 bar. Anions: (1) chloride; (2) nitrate; (3) oxalate;
(4) citrate; (5) acetate; (6) benzoate; (7) sorbate and (8) ascorbate.
Table 1. The detection limits achieved for the conditions are
in the low mM range, and the reproducibility of retention
times and peak areas is about 1–1.5 and 3–5%, respectively,
which is comparable to the performance obtained with the
conventional approach using an EOF modifier.
In Fig. 7, the electropherograms obtained for a beverage
sample and the solution of a vitamin C supplement tablet
are shown. Appropriate dilutions were carried out to
avoid overloading. The beverage contains a large amount
of citric acid as well as smaller amounts of compounds
which would have been added as preservatives such as
benzoate and sorbate. The vitamin supplement has
a stated content of 150 mg vitamin C (851 mM), the amount
determined by comparison of the peak area with a calibration curve is 835 mM, which matches well the indicated
value.
[3] Finkler, C., Charrel, H., Engelhardt, H., J. Chromatogr. A
1998, 822, 101–106.
[4] Xu, Y., Wang, W. L., Li, S. F. Y., Electrophoresis 2007, 28,
1530–1539.
[5] Borissova, M., Vaher, M., Koel, M., Kaljurand, M.,
J. Chromatogr. A 2007, 1160, 320–325.
[6] Henley, T. H., Wilburn, R. T., Crouch, A. M., Jorgenson,
J. W., Anal. Chem. 2005, 77, 7024–7031.
[7] Culbertson, C. T., Jorgenson, J. W., Anal. Chem. 1994,
66, 955–962.
[8] Chankvetadze, B., Burjanadze, N., Bergenthal, D.,
Blaschke, G., Electrophoresis 1999, 20, 2680–2685.
[9] Grushka, E., J. Chromatogr. 1991, 559, 81–93.
[10] Kutter, J., Welsch, T., HRC J. High Resolut. Chromatogr.
1995, 18, 741–744.
[11] Mikkers, F. E. P., Everaerts, F. M., Verheggen, T. P. E. M.,
J. Chromatogr. 1979, 169, 1–10.
[12] Hjerte´n, S., Electrophoresis 1990, 11, 665–690.
[13] Gasˇ, B., Kenndler, E.,
3888–3897.
Electrophoresis 2000, 21,
[14] Mikkers, F. E. P., Anal. Chem. 1999, 71, 522–533.
[15] Erny, G. L., Bergstrom, E. T., Goodall, D. M., J. Chromatogr. A 2002, 959, 229–239.
[16] Erny, G. L., Bergstrom, E. T., Goodall, D. M., Anal.
Chem. 2001, 73, 4862–4872.
[17] Wuersig, A., Kuba´nˇ, P., Khaloo, S. S., Hauser, P. C.,
Analyst 2006, 131, 944–949.
4 Concluding remarks
[18] Mayrhofer, K., Zemann, A. J., Schnell, E., Bonn, G. K.,
Anal. Chem. 1999, 71, 3828–3833.
It was found that for the conditions used, hydrodynamic
flow could be imposed without significant band-broadening
due to laminar flow. In fact, the number of theoretical plates
was increased for anions on application of a bulk flow. The
technique was thus found to be a highly useful tool for
flexible adjustment of the residence time of analyte anions
in the electric field to optimize resolution and/or analysis
time. In the separation of anions, the balancing of EOF by
this purely mechanical means is particularly attractive as it
eliminates the need for dynamic or permanent chemical
modification of the capillaries. Furthermore, the use of a
computer-controlled syringe pump enables versatile variation of the flow even during a separation run, which can be
used to obtain optimized separation profiles akin to gradient
elution in HPLC.
[19] Kuba´nˇ, P., Hauser, P. C., Electrophoresis 2011, 32,
30–42.
& 2011 WILEY-VCH Verlag GmbH & Co. KGaA, Weinheim
[20] Kuba´nˇ, P., Hauser, P. C., Electrophoresis 2009, 30,
176–188.
[21] Trojanowicz, M., Anal. Chim. Acta 2009, 653, 36–58.
[22] Kuba´nˇ, P., Hauser, P. C., Electroanalysis 2004, 16,
2009–2021.
[23] Kuba´nˇ, P., Hauser, P. C., Anal. Chim. Acta 2008, 607,
15–29.
[24] Kuba´nˇ, P., Hauser, P. C., Electrophoresis 2009, 30,
3305–3314.
[25] Johnston, S. E., Fadgen, K. E., Tolley, L. T., Jorgenson,
J. W., J. Chromatogr. A 2005, 1094, 148–157.
[26] Brito-Neto, J. G. A., da Silva, J. A. F., Blanes, L., do Lago,
C. L., Electroanalysis 2005, 17, 1198–1206.
www.electrophoresis-journal.com
Electrophoresis 2011, 32, 3000–3007
[27] Brito-Neto, J. G. A., da Silva, J. A. F., Blanes, L., do Lago,
C. L., Electroanalysis 2005, 17, 1207–1214.
[28] Kuba´nˇ, P., Hauser, P. C., Electrophoresis 2004, 25,
3398–3405.
[29] Kuba´nˇ, P., Hauser, P. C., Electrophoresis 2004, 25,
3387–3397.
[30] Ross, D., Electrophoresis 2010, 31, 3650–3657.
[31] Ross, D., Electrophoresis 2010, 31, 3658–3664.
& 2011 WILEY-VCH Verlag GmbH & Co. KGaA, Weinheim
CE and CEC
3007
[32] Mai, T. D., Hauser, P. C., Talanta 2011, 84, 1228–1233.
[33] Kuba´nˇ, P., Karlberg, B., Anal. Chim. Acta 2009, 648,
129–145.
[34] Mai, T. D., Schmid, S., Mu¨ller, B., Hauser, P. C., Anal.
Chim. Acta 2010, 665, 1–6.
[35] Kuban, P., Karlberg, B., Talanta 1998, 45, 477–484.
[36] Zhang, L., Khaloo, S. S., Kuba´nˇ, P., Hauser, P. C., Meas.
Sci. Technol. 2006, 17, 3317–3322.
www.electrophoresis-journal.com