DSpace at VNU: Inequality income in Hanoi''s peri-urban areas : evidence from household survey data
Bạn đang xem bản rút gọn của tài liệu. Xem và tải ngay bản đầy đủ của tài liệu tại đây (5.24 MB, 14 trang )
INEQUALITY INCOME IN HANOI’S PERI-URBAN AREAS:
EVIDENCE FROM HOUSEHOLD SURVEY DATA
Tran Quattg Tuven
Steven Lim
1. In tro d u c tio n
A
number o f studies indicate that d iversification in nonfarm activities,
including wage and self-em ploym ent, results in poverty alleviation and therefore
increases liv in g standards for a large number o f Vietnamese rural households.
A ccording to W B , income from wage em ploym ent played the most im portant role
in income growth o f the poor in 2004. Wage income contributed almost ha:f o f
overall income grow th o f the poorest households between 2002 and 2004 ( V B ,
2006). Van de W alle and Cratty (2004) found that the p ro ba b ility o f falling in
poverty is substantially higher among households who do not participate in non:arm
self-em ploym ent activities. Also, their evidence based on cross-sectional data
indicated that there is a causal relation between d ive rsifica tion out o f a gricuture
and poverty reduction. M oreover, Pham, B ui, and Dao (2010) estimated that on
average and ceteris p a rib u s , a household that moves from a pure a g ricu tu re
production unit to a pure non-agriculture one w ill increase its expenditure per
capita, and this outcome tends to steadily increase over tim e.
However, w h ile diversification in nonfarm income sources has an increasing
effect on household w elfare, it exaccrbates incom c inequality in Vietnam . U ỉin g
dala sets from two Vietnam Household L iv in g Standard Survey (V H L S S ) in '993
and 1998, G allup (2002) shows that between 1993 to 1998, wage employm ent
contributes an approxim ately same amount to overall income inequality as ith e r
non farm em ploym ent sources (household enterprise and remittances, m a h lv )
A g ricu ltu ra l income, on the contrary, has a decreasing effect on overall income
inequality. A sim ila r finding from V H I,S S 2004 is also found in Van Cao and A kita
* MA. University o f Econom ics and Business, Vietnam National University, Hanoi. PhD
student at the School o f Management, the University o f Waikato, N e w Zealand.
** Ph.D. Waikato Management School, the University o f Waikato, N e w Zealand.
796
IN FQ U A IITY INCOME IN H A N O I’S PFRI URBAN AREAS. .
(2008), w hich shows that agricultural incomc served to decrease overall inequality
whereas nonfann self-employm ent and wage income served to increase overall
inequality.
Nevertheless, when looking at incomc distribution w ith in rural and urban
sectors, Van Cao and A k ita (2008) found that the contribution o f each income
source to
overall
inequality
is quite different between
tw o
sectors.
W hile
agricultural income is inequality-decreasing in the urban sector, it is inequalityincrcasing in the rural sector. Nonfarm self-employm ent seemed to be not related to
inequality in the urban scctor but contributed to the rise in overall inequality in the
rural scctor. Wage income is found to decrease overall inequality w ilh in each
sector. F in a lly, other income sources served to increase overall inequality in both
see tors. As noted in Babatunde (2008), by decomposing income inequality one can
clucidatc the structure and dynamics o f incomc w ith in different socio-economic
groups. M easuring die contribution o f each income source to overall inequality
coupled w ith realizing the relation between socio-economic characteristics and
overall inequality, can be useful to analyzing economic policies and designing
poverty alleviation programmes,
Using a novel data set from our own household survey in Hanoi's peri-urban
areas, this study contributed new empirical findings to the existing literature on
income inequality in Vietnam's peri-urban scctor. This paper is structured as
follows: the subsequent section provides a brief description about the study area.
M ethodology is mentioned in Section 3, and estimation results are discusses in
Section 4, fo llo w e d by conclusion in Section 5.
2. D e scrip tio n o f study area
Our research was conducted in Hoai Due, a peri-urban district o f Hanoi. Hoai
Due is located nn the northwest side o f Hanoi, 19 km from the Centra] Business
D istrict (C R D ) (W B , 2011). The district has an extrem ely favourable geographical
position, w hich is surrounded by various important roads namely Thang 1 one
highw ay (the co u ntry’ s longest and most modem highway). National Way 32 and
in close p ro x im ity to industrial zones, new urban areas and Bao Son Paradise Park
(the biggest entertainment and tourism complex in North Vietnam ). Consequently,
in the period 2006-2010, around 15,600,000 rrT o f farmland were com pulsorily
acquired by the State fo r 85 projects (LH , 2010).
Before r 1 August 2008, Hoai Due used lo he a d istrict o f Ha Tay Province a
neighbouring province o f Hanoi, which was merged into Hanoi on P ' August 2008.
The; cistrict occupies 8,247 hectares o f land, o f which agriculture land accounts fo r
797
V IỆ T N A M H Ọ C - K Ỷ Y Ế U H Ộ I T H Ả O Q U Ổ C T É L À N T H Ứ T ư
4 272 hectares and 9 ] percent o f this area is used by households and individuals
(H oai Due D istric t People's C om m ittee, 2010a)1. There are 20 adm inistrative units
under the district, including 19 communes and 1 town. Hoai Due has around 50400
households w ith
a population o f 193,600 people. In the w hole district, the
employm ent in the agricultural sector dropped by around 23 percent over the past
dccade. Nevertheless, a sign ifica nt proportion o f em ploym ent has s till remained in
agriculture accounting fo r around 40 percent o f the total em ploym ent in 2009. The
corresponding figures fo r industrial and services sectors are 33 and 27 percent,
respectively (Statistics Departm ent o f Hoai Due D istrict, 2010). P rior to r l August
2008 Hoai Due used to be the richest d istrict in Ha Tay Province (M O N R E , 2(07).
In 2009, Hoai Due GDP per capita reached 15 m illio n V N D (H oai Due District
People's Com m ittee, 2010b), which is less than h a lf o f H a n o i’ s average (32 m i lion
V N D ) (Vietnam Government Web Portal, 2010).
3. Methodology
3.1. Data collection
Adapted from GSO (2006), a household questionnaire was designed to gather
a set o f quantitative data on household demographic characteristics and income
sources from various econom ic activities. First, six communes were randomly
selected2 and then 80 households, were randomly selected from each commune for a
target o f sample size o f 480. The survey was carried out from A p ril to June 2010,
and 477 households were successfully interviewed.
3.2. Data analysis
Income inequality can be measured using various methods (Babatunde, 2008).
Am ong the different ways o f inequality measurement, the G in i coefficient is
popularly used to measure the disparity in the distribution o f income, consumption,
and other w elfare indicators (López-Feldman, 2006). F o llo w in g Van Den Berg and
Kum bi (2006), we examine the relation between incom c sources and incomc
inequality
Yitzhaki
using Gini decom position analysis by income source (Lermaa &
1985; Shortocks, 1982). A ccording to López-Feldman (2006), Le-man
1 As laid down in the current l a n d Law o f Vietnam, land is not privately owned because it is
the collective property o f the entire people, which is representatively ownct and
administrated by the State and the land use rights are to be granted to individuals,
households, enterprises and other organizations (National Assembly o f Vietnam, 2003'
2. Six communes include Song Phuong, Lai Yen, Kim Chung, An Thuong, Due Thuon>, and
Van Con.
798
1NEQUAII TY INCOME IN HANOI'S PE R I-U R B A N AREAS
and Y itzhaki (1985) extended the results o f Shorrocks (1982) and indicate that the
G ini coefficient o f total incom c inequality (G) can he denoted as:
K
k=l
( 1)
where Sk represents for the share o f income source * in total income, Gt is the G ini
coefficient o f the income distribution from source *, and Rk is the correlation
coefficient between income from source * and w ith total income Y. Babatunde
(2008) shows that GkRk is known as the pseudo-Gini coefficient o f income source *
w h ile the share or contribution o f income source * to lota] income inequality is
expressed as:
G
(2)
A s shown in Stark, T a ylo r and Yitzhakj (1986), the income source elasticity o f
inequality indicates the percent change in the overall G ini co efficient resulting from
a ] percent change in income from source * is expressed as:
(3)
Where G is the overall G ini coefficient prior to the income change. As noted
by Van Den Berg and K u m b i (2006), equation (3) is the difference between the
share o f source * in the overall G ini coefficient and its share in the total income (Y ).
It should he noted {hat the sum o f income source elasticities o f inequality should be
zero, w hich means that i f a ll the income sources changed by same percentages, the
overall G ini coefficient ((7) w ould remained unchanged.
4. E stim a tio n results
4.1. B a ckg ro u n d o f household income and incom e-generating activities
In previous studies on the decomposition o f income inequality in Vietnam
household income is often disaggregated into various sources, including wage
income, nonfarm self-employm ent income, agricultural income and other income
799
V IỆ T N A M H Ọ C - K Ỷ Y Ế U H ộ ] T H Ả O Q U Ó C T Ế L À N T H Ủ T ư
(.Adger, 1999; Gallup, 2002; Van Cao & A k ita , 2008). However, wage earners often
w ork for various types o f em ployers in Vietnam . Nguyen (2010) divided wage
workers in Vietnam into tw o groups, including inform al wage w orkers and formal
wage workers. Form al wage earners are those who w ork fo r other households, often
do not have a labour contract and not participate in social insurance. Inform al wage
earners are those w o rkin g fo r the State, enterprises and other organizations, and
they earned a much higher wage income than inform al wage earners. F o llo w in g this
approach, we further brake down wage income into tw o sub-categories, namely
inform al wage and form al wage income. Household income, therefore, can he
contributed by five different sources (Table 1).
Table I : H ousehold incom e by source
Categories
Definitions
1. Farm work
Self-employment in household agriculture, including
crop and livestock production
2 Non-farm Self-employment
Self-employment in household businesses (excluding
farm production)
3 Informal wage work
Wage work that is unstable, irregular, and without a
formal labour contract, informal wage earners are often
manual workers and hired by individuals or households.
*
4. Formal wa%e work
Wage work that is regular and relatively stable in factories,
enterprises, state offices and other organizations with a
forma] labour contract and often require skills and higher
level o f education
5 Other income
Income from other sources such as public and private
transfer, loan interest, house or land rental, etc
Source: Survey data and authors’ compilation from Becker (2004), Maxwell, el a]
(2000), Cling et a] (2009), and Nguyen (2010).
Tablc 2 provides background in fo rm a tio n about household incom e shares
by source. It also indicates how m uch per household and per capita incom e by
source. The results show that o v e rw h e lm in g m a jo rity o f surveyed households
800
INEQUALITY INCOME IN HANO I'S P E R I-U R B A N AREAS
(around
84
percent)
derive
income
from
fa rm ing
(cro p
and
live sto ck
pro du ctio n ), w h ich , how ever, ju st accounts fo r about 27 percent o f total incom e
on average. T his suggests farm ing has rem ained im p o rta n t in term s o f food
security and cash incom c to some extent. M any households have continued rice
c u ltiv a tio n as a source o f food supply w h ile others produced vegetables and
fru its to supply fo r H a n o i’ s urban markets. The com m on types o f crop plants
consist o f cabbages, tomatoes, w aier m orning g lo ry and various kin d s o f heans,
oranges, grapefruits and guavas, etc. A n im a l husbandry is m a in ly undertaken
hy p ig or p o u ltry breeding sm all-size farms or cow grazing households. These
a c tiv itie s , how ever, have considerably declined due to the spreading o f cattle
diseases in reccnt years.
A lm ost all surveyed households (95 percent) participate in nonfarm activities
and income from these sources contributed about two thirds o f total income on
average. A m ong these activities, informal wage income accounts fo r about one
fourth o f total income w ith a participation rate reached around 41 percent. This
incomc source is often earned from manual labour jobs and the common types o f
such jobs are carpenters, painters, building workers and other various kinds o f
casual jobs. Such jobs are often hired by individuals or households w ith low and
unstable income, and w ith o u t labour contracts. Those who undertake these jobs
have be low-average education and are younger. Sim ilar figures are observed fo r the
case o f non farm self-em ploym ent income. About 43 percent o f the household
sample reported engaging in non-famn household businesses, and on average around
26 percent o f total
constituted
income is contributed by this a ctivity.
small-scale
trade or production units, using
Such businesses
fa m ily
labour.
The
households’ business premises are m ainly located at their own houses or residential
land plots that have a prim e location for opening a shop, a w orkshop or a small
restaurant.
A b o u t 28 percent o f sample households received incom e from form al wage
w ork, accounting fo r 18 percent o f total income on average. Form al wage
earners are often employees who w ork in enterprises and factories, state offices
or other organizations. Such jobs are ofien h ig h ly paid w ith stable incom e and
labour contracts. Those undertaking these jobs tend to have a much higher
education level and are younger. Finally, about one th ird o f surveyed households
received other income, inclu d in g private transfer (g ift and rem ittances) and
public transfer (pension and social assistances), rental incom e and interest
incom c, and so on. T his source, however, contributes o n ly 6 8 percent o f total
income on average.
801
V IỆ T N A M H Ọ C - K Ỷ Y Ế U H Ộ I T H À O Q U Ố C T Ế L À N T H Ứ T ư
Table 2: Composition of income, and household participation
in different activities
Total
SD
Farm income
SD
Nonfarm income
SD
A. Informal wage income
SD
B. Forma] wage income
SD
c Nonfarm self-employment
SD
Non-labour income
SD
Per
Per
Share o f total
Participation
household
capita
Income (%)
rate (%)
59,688
14,146
(31,156)
(7,345)
14,046
3,282
27.14
83.65
(16,502)
(4,187)
(30.40)
42,151
9,712
66.07
(32,527)
(7,402)
(31.50)
12,035
2,793
24.04
(18,399)
(4,228)
(34.06)
14,554
3,092
17.90
(28,972)
(6,322)
(31 80)
15,561
3,827
24.13
(26,478)
(6,495)
(34.13)
3,490
1,153
6.78
(8,849)
(3,233)
(17.16)
95.40
40.70
28.10
40.50
33.12
Unit: 1,000 VND. Nonfarm income “ (A+B+C). Number o f observations: 477 Standard
deviation in parentheses
Source: Authors' own calculation from the survey.
4.2. G ini coefficients f o r income inequality
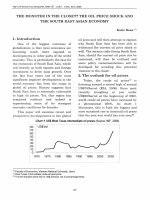
Figure 1 presents the disừibution o f incom e sources over incom e quintilcs. As
compared to households in the higher incom e strata (4 and 5), the low er incom e
802
INEQUALITY INCOME IN HANOI'S PE R I-U R B A N AREAS
quintilc households (1 and 2) ha\o a higher share o f farm incom e, whereas those in
the richcr groups have a higher share o f non farm s e l f - e m p l o y m e n t and form al wage
incomes. This suggests that incomc shares by source arc closely associated w ith the
in c o m e d is trib u tio n ; s p e c ific a lly th e re is a positive a ss o c ia tio n b e t w e e n d ie n a n fa r m
s c lf-c m p lo y m e n t in c o m e share, fo rm al wage incom e share and p er cap ita in co m e,
but a negative correlation between the farm and inform al w age incom e shares and
per cap ita i n c o m e
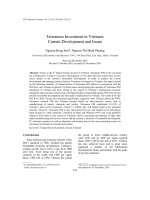
Figure
2
shows
the
distribution
of
income
source
over
farm land
holdings. A s revealed in th is figure, households in the h ig h e r l a n d h o l d i n g
stratum s have a m uch h ig h e r percentage o f farm in co m e hut have a lo w e r
share o f n o nfa rm s e lf-e m p lo y m e n t, form al wage incom es and other incom e.
By contrast, the lo w e r la n d h o ld in g stratum households receive m ore incom e
from nonfarm s e lf-e m p lo y m e n t and manual labour jo b s , w h ic h im p lie s that
households w ith lim ite d farm land m ig h t be pushed in to these a c tiv itie s as a
way to co m p le m e n t th e ir incom e. F in a lly , the share o f fo rm a l wage incom e
appears not to be c o rre la te d w ith the d is t r ib u t io n o f fa rm la n d , suggesting that
th is in c o m e s o u r c e m a y b e a s s o c ia te d w it h o th e r f a c t o r s , s u c h as e d u c a t io n ,
rather than fa rm la n d h o ld in g .
Figure 1: Income shares hy source and income quintiies
■Non-fami
« Formal wa^e
■Iufomiahvage
■ Other iiK C r t iie
* Firm
100%
1
•ệ
te
60 %
3
0
X
•3 40%
©
w
1
20 %
III com qulntlltc
(incomcper capita)
803
V IỆ T N A M H Ọ C - K Ỷ Y Ế U H Ộ I T H Ả O Q U Ỏ C T Ế L A N T H Ứ T ư
Figure 2: Income shares by source and farm land holding quintiles
I
8
Ề
5
Ô
5
I
Jm
1
i
V
0
i
w
I
Farmland holding qulnlllM
(farmland size p a bcHiiebold)
Table 3 presents the G in i decomposition o f incom e inequality by income
source. The overall G in i co efficient fo r the sample households was 0.267, w h ich is
much low er than the G in i co efficient o f 0.434 in the w hole country and 0.4 ] ] in the
Red River Delta reported by GSO (2008). This indicates a quite low degree of
income inequality among the sample households. Such a lo w e r inequality at district
level than that in larger areas is also found in Vietnam by M in o t, Baulch, and
Epprecht (2006), w ho explained that, sim ila r 10 other measurements o f inequality,
there is a ứend toward sm aller G in i coefficients fo r sm aller regions, such as
provinces or districts, than for the country as a whole. T his is due to the fact that
households in a sm all region are lik e ly to have m ore sim ilarities than households
across the w hole country.
B y decomposing the total household income inequality into various income
sources, the results reveal that nonfarm self-em ploym ent, form al w ag e incom c and
other income becom e the m ajor contributors to the overall incom e inequality am ong
sample households. Taken together, they account for 93 percent o f the total income
inequality. B y contrast, farm and inform al wage income reduced the inequality; the
pseudo-Gini coefficients o f these income sources are much low er than the total G ini
coefficient, whereas the pseudo-Gini coefficients for nonfarm self-em ploym en t,
804
INEQUALITY INCOME IN HANO I'S PE R I-U R B A N AREAS
form al w a g e in co m c and other income sourccs arc much higher, s p e c ific a lly , a 10
p crc cn t increase in incom c from fa rm and inform al wage activities w ould have led
10 a 1.7 percent and 1.9 pcrccnt decline in the overall incom e in e q u a lity ,
respectively. Whereas, the same increase in nonfarm self-em ploym ent, form al wage
incom c and other incom e sources w o u ld have resulted in a 1.4 percent, 1.6 percent
and 0.57 percent increase in the overall income inequality, respectively.
T a b le 3 :
G ini decomposition o f incomc inequality by income source
Correlation
Income
income source
share
Sk
with the
Gini
distribution
Gk
of total
income
Source
PseudoGini
GkRk
Share lo
elasticity
tola] income
of total
inequality
inequality
(RkGkSkVG
(RkGkSkV
Rk
G-Sk
0.232
0 606
0.121
0 073
0.064
-0.168
0.271
0.757
0.534
0404
0.409
0 138
Informal wage
0 197
0 727
0.012
0.009
0.007
-0.191
Formal wage
0.219
0 818
0.572
0 468
0.383
0.164
Other incomc
0.082
0.876
0.518
0 454
0.138
0.057
Total
1.000
0.267
Farm
Non farm
Self-employment
N o te
1.000
Estimates are based on annual per capita incomes. N '-4 7 7 .
L o okin g at the third and fourth column in Table 3, the results show that the
inequali(y o f farm and in fo rm a l wage incomes among households is low er than the
in eq u ality o f nonfarm self-em ploym ent, formai wage incom e and other incomes
among households In addition, as co m p a r ed to nonfarm self-em ploym ent income,
form al wage incomes and other income, farm and in fo rm a l w age incomes have a
much low er correlation w ith the distribution o f total income. Consequently, income
from
farm
and in fo rm a l wage w ork had an equalizing effect on the income
distribution. Basically, this fin d in g is in a cc o rd a n ce w ith G allup (2002) and Van
C a o and A k it a (2 0 0 8 ), w h o fo u n d that w h ile agricultural in c o m e a c tu a lly re d u c e d
805
V IỆ T N A M H Ọ C - K Ỷ Y Ẻ U H Ộ I T H Ả O Q U Ỏ C T Ẻ L À N T H Ú T ư
the inequality o f income distribution, nonfarm self-em ploym ent incom e and ether
income sources m a in ly contributed to inequality in Vietnam .
5. Conclusion and policy recommendation
By disaggregating wage income into tw o sub-categories, we found Lhat
inform al wage income has an inequality-decreasing effect on income inequality,
w hich im plies that there is no or a low entry barrier to manual labour jobs and hus
everyone can undertake these jobs in Hanoi's peri-urban areas
In contrast, the
rising-inequality effect o f other nonfarm income sources, m ainly nonfarm jelfemployment income and form al wage income, suggests that there are sime
relatively high entry barriers that hinder everyone from participating into these ligh
return activities. Possibly, lucrative nonfarm activities often require higher leves o f
education and skills, better access to credit or other conditions. O ur fin d in g supports
the hypothesis stated by A dger (1999) that income d ive rsifica tion into non arm
activities results in either greater income inequality i f opportunities for tiese
activities are skew ed towards to the better-ofT; or in less incom e inequality i f ỉuch
opportunities are accessible to the poorer parts o f the population
Given the context o f shrinking farm land due to rapid urbanization, the
declining share o f farm income w ill be unavoidable. Consequently, increising
inequality due to the sh rin kin g share o f farm incom e w ill be im possible to ayoid
w ith o u t stopping farm land conversion fo r in d u s tria liz a tio n and urbanizaion.
Based on the aforem entioned e m p irica l fin d in g s , it is possible to propose some
p olicies that may help to m itig a te the issue o f incom e ine q u a lity in V ie tn im 's
peri-urban areas. A g ricu ltu ra l extension polices can help farmers to get h iịh e r
returns from agriculture by changing to more profitable crop plants. In addiion,
providing local people, especially elderly landless farmers, w ith appropriate jo b
training programmes can help them get a decent jo b . F in a lly, im proving oca]
infrastructure, coupled w ith installing new local markets are found to be a efTe:tive
w ay to create m ore nonfarm jo b opportunities fo r local people (B ic h N goc, 2)04;
V. S. N guyen, 2009).
Reference
1. Adger, w . N. (1 999 ). Exploring incom e inequality in rural, coastal V iet N am T h e
J o u r n a l o f D e v e lo p m e n t S tu dies, 55(5), 9 6 -1 1 9 .
2.
Babatunde, R. (2008). Incom e Inequality in Rural Nigeria: E vid en ce from F am in g
H ouseholds Survey Data. A u s tr a lia n J o u r n a l o f B a s ic a n d A p p lie d S c ie n c e s 2 (1),
134-140.
8 06
INFQUALITY INCOM E IN H AN O I'S PERI-UR RAN AREAS.
3. Bccker, K. F. (2 0 0 4 ). The in fo r m a l e co no m y
SỈDA: Department for Infrastructure
and E conom ic Co-operation.
4
Rich N g oc. (2 0 0 4 ). Farmers Icam to take a new career path
V ie tn a m In v e s tm e n t
R e v ie w L td .
5.
Cling, J. P., Le, V. D , N g u yen , T. T. 11., Phan, T. N. T., Razafindrakoto, M., &
Roubaud., F. (2 0 0 9 ). S h e d d in g lig h t on a h u g e b la c k h o le : the in f o r m a l s e c to r in
H a n o i, m a in fin d in g s o f th e In fo rm a l s e c to r s u rv e y ( IS S u rv e y ) 2 0 0 7 . (G S O -ISS /
1RD-D1AL
project).
Retrieved
from
h t t p / /w w w dial.prd fr/dial pays/PD F/hanoi
survey.pdf
6. Gallup, J. (2 0 0 2 ). T he w a g e la b o r m a rk e t a n d in e q u a lity in V ie tn a m in the J 9 9 0 s .
(World Bank P olicy Research Working Paper No. 2896). Retrieved from The World
Bank: h ttp ://w w w -w ds.w orldhank.org/extem al/default/W D SC ontentServer/lW 3P/lB
/ 2 0 0 2 / 1 1 /0 1 /0 0 0 0 9 4 9 4 6 02 l01 805 10 5 l9 9 /R cn d e red /P D F /m u ltiO p a g e.p d f
7
GSO. (2006). V H L S S -2 0 0 6
The Q u e s a n n n a ir on H o u s e h o ld Survey. Hanoi, Vietnam,
The General Statistical Office.
8. G SO (20 08 ). S ection 9: Participation in poverty reduction programs T h e re s u lt o f
s u rv e y on h o u s e h o ld liv in g s ta n d a rd s 2 0 0 8 : Statistical Publising House.
9. llo a i Due District People's Committee. (2010a) Báo cáo thuyết minh kiềm kê đất đai
năm 2 0 1 0 [2010 land inventory report] Hoai D u e. Ha N o i, Vietnam.
10 Hoaj Due District People's Committee. (2010b). B á o c á o tìn h h ìn h th ụ c h iệ n n h iệ m
v ụ p h ả i tr iể n K T X H - A N Q G n â m 2 0 0 9 r à p h ư ơ n g h ư ớ n g n h iệ m vụ n ù m 2 0 ĩ 0 [ T h e
r e p o r t on th e p e r fo r m a n c e o f s o c io -e c o n o m ic , s e c u rity a n d defen ce in 2 0 0 9 , a n d the
d ire c tio n s a n d tas k s f o r 2 0 JO ], Hanoi: Hoai Due People's committee.
1 1 l.erman, R I., & Yitzhaki, S- (1985) Income inequality cfTects by incom e source: a
new approach and applications to the United States. T he R e v ie w o f E c o n o m ic s a n d
S ta tis tic s , 1 51-156.
1 2 LH. (2 010 ). Giải phóng mặl hăng ò Huyện Hoài Đức: V ư ớn g nhất là giao đất dịch
vụ cho dân [Site clearance in Hoai Due: Granting the " land for services'1 to people is
the biggest obstacle], H annim oi Retrieved from />Kinh te/401995/vuong-nhat-o-phan-giao-dat-dich-vu-cho-dan.htm
] 3. I.opez-Feldman, A. (2 0 0 6 ) D ecom p osing inequality and obtaining marginal effects.
S ta in J o u r n a l, <5(1), 106-111
14 M a x w e ll, D ., L evin , c ., Arm ar-Klem esu, M , Rue], M ., M o n is , s., & Ahiadeke, c .
(2000). U r b a n liv e lih o o d s a n d f o o d a n d n u tritio n s e c u rity in G r e a te r A c c ra , G h a n a .
(Research Report 112). Retrieved from International Food Policy Research Institute
(1FFR1): https://w w w . whn.inƯcntity/nutrilion/puhlicatÌGns/WMO multi country %20
study Ghana p d f
8 07
V IỆ T N A M H Ọ C - K Ỷ YÉ IJ H Ộ I T H Ả O Q U Ố C T É L À N T H Ứ T ư
15. Minot, N ., Baulch, B., & Epprecht, M. (2 006 ). P o v e r ty a n d in e q u a lity in Vietnam .
S p a t ia l p a tte r n s a n d g e o g ra p h ic d e te rm in a n ts (Research Report
148). Retrieved
from International Food P olicy Research Institute (IFPR1): http://ideas, re pec. O'g/p
/fpr/resrep/14 8. h tm 1
16. M O N R E . (2 007 ). Hà Tây: Khai thác nguồn lực đ ể cô n g nghiệp hóa, hiện dại hóa
nông thôn
[Ha Tay: E xploiting land resources for the agricultural and riral
industrialization and modernization], from http://www.m onre.gov.vn/v35/deii:i]]t.
aspx?tab id =428& cateID ==4& id =30785& code^O X 4B L 30785
17. National A ssem b ly o f Vietnam (2 00 3). L a w on L a n d Hanoi, Vietnam : Retrieved
from 3na26Nov03Land°/o5BX2865°/t5D.
pdf.
18. N g u yen , V. c . (2 0 1 0 )
T h e im p a c t o f a M in im u m
W ag es a n d E x p e n d itu re s
o f L o w -W a g e
W o rk e rs
W a g e In c re a s e on E m p lo ym en t.
in
V ie tn a m .
M P R A Paper No.
36751 Retrieved from http://m pra.ub.uni-m uenchen.de/36751/
19. N g u y en , V.
s.
(20 09 ).
In d u s tr ia liz a tio n
and
U r b a n iz a t io n
in
V ie tn a m :
H ow
A p p r o p r ia t io n o f A g r ic u lt u r a l L a n d U se R ig h ts T r a n s fo r m e d F a r m e r s ' L iv e lih o o h in
a P e r - U r b a n H a n o i V illa g e ? . (E A D N w orking paper N o .3 8 ). H anoi. Retrieved t o m
n org/eadnwp 38 p df
20. Pham, T. H., B ui, A. T., & Dao, L. T. (201 0). Is N o n fa r m D iv e r s ific a t io n a W a y O u t
o f P o v e r ty f o r R u r a l H o u s e h o ld s ? E v id e n c e f r o m
V ie tn a m in Ỉ 9 9 3 - 2 0 0 6 . ( PMM A
Working Paper 2 0 1 0 -1 7 ). Retrieved from vl/pmmacr/2( 1017.html
21. Shorrocks, A. F. (1982). Inequality decomposition by factor components E c o n o m e tĩic a '
J o u rn a l o f the E c o n o m e tric S o c ie ty 193-211.
22. Stark, o . , Taylor, J. E., & Yitzhaki, s . (1 9 8 6 ). Rem ittances and inequality. The
E c o n o m ic J o u r n a l, 9 6 (3 8 3 ), 7 22-7 4 0 .
*
23. Statistics Department o f Hoai D ue District. (2 0 1 0 ). S ta tis tic a l Y e a rb o o k o f H o a i ) u c
2 0 0 9 . Hanoi: Statistics Department o f Hoai D u e District.
24. Van Cao, T. c . , & Akita, T. (2008). U r b a n a n d R u r a l D im e n s io n s o f l n o m e
In e q u a lity
fn
V ie tn a m . (GS1R W O R K IN G
P A P E R ). Retrieved from http://iceas.
rcpec org/p/iuj/wpaper/em s 2008_04.htm l
25
Van de Walle, D ., & Cratty, D. (200 4). Is the em ergin g non-farm market e c o m m y
the route out o f poverty in Vietnam? E c o n o m ic s o f T ra n s itio n , 1 2 ( 2 ) , 2 37-274 .
26
Van Den Berg, M., & K um bi, G. E. (2006). Poverty and the rural nonfarm c c o m m y
in Oromia, Ethiopia. A g r ic u lt u r a l E c o n o m ic s , 3 5 , 4 6 9 -4 7 5 .
808
INEQUALITY INCOME IN HANO I'S PERI-URBAN AREAS...
27. Vietnam G overnm ent W eb Portal. (2010). Ỉ I N eyes u s S I 2 .0 0 0 p e r c a p ita in c o m e
by 2 0 3 0 Retrieved from http '/hanoilOOOyrs Victnain.gov. vn
28. WH. (2 006 ). T a k in g Stock-An update on V ietnam ’s E co n o m ic D e v c lo p m e n ls and
Reforms', M id-Y ear Consultative Group M eeting for Vietnam. N h a T ra n g , June 9 10, 2 0 0 6 Vietnam: The World Rank.
29. WB. (2011). Vietnam Urbanization Review: Techinca! Assistance Report. Hanoi
Vietnam
8 09