DSpace at VNU: Optical Properties of Zn-based Semiconductor Nanoparticles and Application in Two-barcode Encryption
Bạn đang xem bản rút gọn của tài liệu. Xem và tải ngay bản đầy đủ của tài liệu tại đây (813.64 KB, 7 trang )
VNU Journal of Science: Mathematics – Physics, Vol. 31, No. 4 (2015) 32-38
Optical Properties of Zn-based Semiconductor Nanoparticles
and Application in Two-barcode Encryption
Luu Manh Quynh*, Hoang Van Huy, Nguyen Hoang Nam
Faculty of Physics, VNU University of Science, 334 Nguyen Trai, Thanh Xuan, Hanoi, Vietnam
Received 01 August 2015
Revised 20 September 2015; Accepted 18 November 2015
Abstract: Mn-doped ZnS (ZnS/Mn) nanoparticles synthesized by sono-chemical co-precipitation
are combined with ZnO nanoparticles synthesized by sol-gel method for application in twobarcode encryption. Nanoparticles are mixed together in different mass proportions of ZnO:
ZnS/Mn respectively being 5: 1, 10: 1, 15: 1, 20: 1, 25: 1.30 : 1 and 35: 1, before being pressed in
1 cm diameter, 1 mm thick KBr pellets. The photoluminescence (PL) of the tablet shows that the
mass proportion of two materials could be distinghuished by the proportion of the PL intensities at
515 nm and 600 nm, which promises potential manufacturing ability two-substant/two-barcode
information storage systems for civil security applications.
Keywords: Photoluminescent encryption, Zn-based semiconductor, civil application.
1. Introduction∗
Recent years, semiconductor nanoparticles are interesting materials for biomedical
applications such as cell imaging [1], drug delivery [2] or gene therapy [3], as well as
applications in multipurpose encryption [4, 5] due to their optical properties. In application for
encryption, polystyrene micro-beads that contain two types of CdSe/ZnS core-shell nanoparticles were
created by inversed emulsion method [4, 5]. Under UV-light excitation, the micro-beads emit visible
light with two distinghuished narrow peaks. The relative intensity of the two narrow peaks could be
modified by controling the proportion of the two semiconductor core-shell particles under the
synthesizing process. The material is comfortable to apply in multi-target cell imaging. Besides those
applications, semiconductor nanoparticles are also used as optical encryption for civil security [6].
However, the manufaction of those nanoparticles requires critical laboratorial conditions, which raise
the cost of comercial products to unreasonable level.
In this report, we use a simple process to fabricate ZnO and ZnS/Mn nanoparticles with high
performance. Then, we use these zinc-base semiconductor nanoparticles to make a simple code system
includes two substances, and assess the usability of the system for civil encryption.
_______
∗
Corresponding author. Tel.: 84-984424843
Email:
32
L.M. Quynh et al. / VNU Journal of Science: Mathematics – Physics, Vol. 31, No. 4 (2015) 32-38
33
2. Experiment and method
2.1. Synthesis of ZnS/Mn nanoparticles
The nanoparticles are prepared by ultrasonic-assisted co-precipitation method. Briefly, 40 mL of
0.1 M Na2S solution are wisedropped to 200 mL solution containing 2 mmol Zn(NO3)2, 180 µM
Mn(NO3)2, 20 mg PVP and 20 mM SDS. During the addition of Na2S, ultrasonic of power 0.2 kW and
frequency 40 kHz is applied. A white colloid product that contains ZnS/Mn particles is centrifugated
several times with 50% ethanol in order to wash all by-products.
X-ray diffraction (XRD), transmitted electron microscopic (TEM) imaging of the as-prepared
particles is investigated.Fluorescent spectra of ZnS/Mn particles are observed under 335 nm excitation
in 390 - 640 nm interval, while fluorescence excitation spectra are measured in 300 - 430 nm interval
with the fluorescence wavelength of 590 nm.
2.2. Synthesis of ZnO nanoparticles
ZnO nanoparticles are synthesized by sol-gel method in 3 steps: gel creation, xerogel creation and
annealing. In gel creation step, Zn(NO3)2 is mixed with citric acid (CA) with molar ratio of 1: 6 in
aqueous solution. The solution is placed in an incubator at 80°C for 20h; yellow gel formation is
created. In step 2, the gel system is dried at 200°C for 2h; grey spongy xerogel is formed. In the last
step, the xerogel powder preliminary granulated before being annealed at 650oC for 4h. The final
product is a white powder of ZnO nanoparticles.
X-ray diffraction (XRD), transmitted electron microscopic (TEM) imaging, scanning electron
microscopic (SEM) image and energy dispersive X-ray (EDX) pattern of the as-prepared particles is
investigated.
Fluorescent spectra of ZnO particles are observed under 360 nm excitation in 410 - 650 nm
interval while fluorescence excitation spectra are measured in 280 – 450 nm interval with the
fluorescence wavelength of 511 nm.
2.3. Application for optical 2-barcode system
ZnO and ZnS/Mn nanoparticles are mixed together in different mass ratios of ZnO:ZnS/Mn, which
are 5: 1, 10: 1, 15: 1, 20: 1, 25: 1.30 : 1 and 35: 1. 20 mg of each mixture is pressed into KBr thin
cylinder pellet. Fluorescent spectra of the pellet are investigated under 350 nm excitation.
3. Result and discussion
3.1. Structure and morphology
ZnS/Mn nanoparticles
X-ray diffraction parttern of ZnS/Mn nanoparticles is showed in Fig.1A. The observed peak
positions coincide with the (111), (200) and (220) peaks of close-packed face central cubic JCP2
34
L.M. Quynh et al. / VNU Journal of Science: Mathematics – Physics, Vol. 31, No. 4 (2015) 32-38
No. 05-0566 sphelartie ZnS. TEM image in Fig. 1B shows that the ZnS/Mn particles are formed
with very small size of around 2 nm. This can be judged by the effect of surface active
substances combined with the effect of the ultrasonic horn.
Figure 1. XRD parttern (A) and TEM image (B) of ZnS/Mn nanoparticles prepared by ultrasonic-assisted coprecipitation method.
ZnO nanoparticles
Figure 2. TEM image (A), SEM image (B), XRD (C) and EDX parttern (D) of ZnO nanoparticles prepared by
sol-gel method.
L.M. Quynh et al. / VNU Journal of Science: Mathematics – Physics, Vol. 31, No. 4 (2015) 32-38
35
Under the effect of high Citric acid concentration, ZnO nanoparticles have mostly homogeous
sizes within 50-60 nm as shown by TEM image in Fig. 2A and SEM image in Fig 2B. It was discussed
that when the CA:Metal ion ratio increases, there are more linkages between the metal ion with the
organic molecules formulated in xerogel structure [7]. The metal ion – CA complex formation plays
important roles not only as oxygen source but also as size controlling agent; more linkage increases
the distance between the metal ions in the xerogel complex, hence decreases the size of the particles.
Besides, annealing temperature also plays an important role in changing the particle size. At higher
temperatures, the particles were aggregated into larger particles. However, at low temperature, the
thermal energy is not enough to vaporize all residual carbon in the sample [8]. We have studied and
showed that the optimumannealing temperature is between 650oC and 700oC.
Fig. 2C is the XRD pattern of the materials in two different synthesis times in order to
check the reproducibility of the synthesizing process. Both products show hexagonal structure
without any impurities. Besides, EDX spectrum in Fig. 2D affirms that the elemental
proportion of Zn: O is 51:49 without any other unwanted elements.
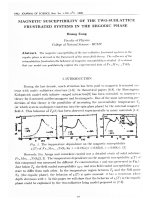
3.2. Photoluminescence of the materials
Photoluminescent property of ZnS/Mn nanoparticles
Thephotoluminescence (PL) and excitation (PLE) of ZnS/Mn particles are investigated and the
results are shown in Fig. 3. The presence of Mn2+ transition metal as doppant in the material creates a
relatively high peak at 595 nm, which corresponds to energy difference of two energy states of Mn2+,
4
T1 and 6A1 [9]. The PLE (Fig.3A) spectrum shows a peak at 338 nm, of which the energy is close to
the band gap of base crystal ZnS (3.54 eV for bulk material). Besides, there are two small peaks
observed at 495 nm and 506 nm (Fig. 3A – inset). The energies of these peaks are close to the energies
of 4T1 and 4T2 states of Mn2+, which indicates the presence of Mn2+ in the materials.
Figure 3. Photoluminescent excitation (PLE) spectrum (A) and photoluminescence (PL) spectrum (B) of
ZnS/Mn nanoparticles.
36
L.M. Quynh et al. / VNU Journal of Science: Mathematics – Physics, Vol. 31, No. 4 (2015) 32-38
Photoluminescent property of ZnO nanoparticles
PL and PLE spectra of ZnO materials are presented in Figure 4. In the PLE spectrum, there is one
peak at 360 nm, which is close to the band gap of ZnO (3.37 eV for bulk materials). Light of the
wavelength 360 nm was used as excitation source to collect PL spectrum. The PL spectrum of ZnO
nanoparticles shows a peak at 511 nm, which could corespond to the ussual oxygen vacancy energy
state of ZnO material. This result agrees with the EDX result, which showed that oxygen is slightly
deficient in our samples (Zn:O = 51:49).
Figure 4. Photoluminescent excitation (PLE) spectrum and photoluminescence spectrum (PL) of Zno
nanoparticles.
Application for optical 2-barcode system
Figure 5. Photoluminescences of the ZnO:ZnS/Mn pellets of different mass ratios (A) and the graph of relative
PL intensity (B – square points), intergral intensity ratio (B – circle points) of peaks at 515 of ZnO and 600 nm
of ZnS/Mn vs the mass ratio.
L.M. Quynh et al. / VNU Journal of Science: Mathematics – Physics, Vol. 31, No. 4 (2015) 32-38
37
Fig. 5A shows the PL observation of the ZnO: ZnS/Mn pellets and the dependence of relative
intensity of peak at 515 nm to 600 nm on the mass ratio (Fig. 5B). Decreasing of the proportion of
ZnS/Mn results in the decreasing of the relative intensity of the peak at around 600 nm, which was
attributed to PL peak of ZnS/Mn. The change of the relative intensity of the peak 600 nm is evaluated
by two methods. On one hand, the ratio of the absolute PL intensity of peak at 515 nm to that of peak
at 600 nm is taken. The value is labeled as I515/I600 and exhibited by a graph in figure 5. On the other
hand, the ratio of the total PL intensities of two intervalums at [500 nm – 530 nm] and at [585 nm –
615 nm] is calculated. This value is labeled as Area515/Area600 and also shown in figure 5 for several
different mass ratios. These two graphs have similar shapes. In application of encryption, it is usually
convenient to use the second method. Only two filters, which let the visible light go through at two
intervalums around 515 nm and 600 nm are needed. The out come lights could be collected and
detected by a simple detector. The ratio of the intensities of the two signals could be calculated by a
very simple program, which gives back information about the mass ration of the two semiconductor
components. The sizes of the nanoparticles are homogenously small enough to apply in printing or
other technique, and hence the products have potential aplicability for encoding purpose.
Conclusion
Mn-doped ZnS (ZnS/Mn) nanoparticles synthesized by sono-chemical co-precipitation are
combined with ZnO nanoparticles synthesized by sol-gel method for application in two-barcode
encryption. The size of the ZnS/Mn nanoparticles is about 2 nm and of the ZnO nanoparticles is about
50 nm. The PL peak at around 515 nm corresponds to the oxygen vacancy of ZnO material, while that
peak at 595 nm corresponds to 4T1 – 4A1 energy transfer of Mn2+ in ZnS/Mn materials. The mass ratio
change results in the variation of relative PL intensities observed at these two wavelength reigons,
which is very promising for manufacturing two-barcode information storage systems for civil security
applications.
Acknowledgement
This work is financially supported by Vietnam Nationanl University, Hanoi under the Project
number CA.14.11A.
References
[1] Xiaohu Gao, Lily Yang, John A Petros, Fray F Marshall, Jonathan W Simons and Shuming Nie. In vivo
molecular and cellular imaging with quantum dots. Current Opinion in Biotech. (2005) 16 63-72.
[2] Guimiao Lin, Feng Yin, Ken-Tye Yong. The future of quantum dots in drug discovery. Expert opinion on Drug
Discovery. (2014) 9(9) 1-4.
[3] Jennifer M Knipe, Jonathan T Peters, Nichonlas A Peppas. Theranostic agents for intracellular gene delivery with
spatiotemporal imaging. Nano Today. (2013) 8(1) 21-38.
38
L.M. Quynh et al. / VNU Journal of Science: Mathematics – Physics, Vol. 31, No. 4 (2015) 32-38
[4] Hai-Qiao Wang, Jian-Hao Wang, Yong-Qiang Li, Xiu-Qing Li, Tian-Cai Liu, Zhen-Li Huang, Yuan-Di Zhao.
Multi-color encoding of polystyrene microbeads with CdSe/ZnS quantum dots and its application in
immunoassay. J. Colloids and Interface Science (2007) 316 622-627.
[5] Yixi Liu, Le Liu, Yonghong He, Liang Zhu, Hui Ma. Decoding of quantum dots encoded microbeads using a
hyperspectral fluorescence imaging method. Anal. Chem. (2015) 10.1021/acs.analchem.5b00398
[6]
[7] Rodrigo Marques Ferreira, Maycon Motta, Augusto Batagin-Neto, Carlos Frederico de Oliveira Graeff, Paulo
Noronha Lisboa-Filho, Francisco Carlos Lavarda. Theorical investigation of geometric configurations and
vibrational spectra in citric acid complexes. Materials Research. (2014) 17(3) 1-7.
[8] M. Ghiasi, A. Malekzadeh. Synthesis of CaCO3 nanoparticles via citrate method and sequential preparation of
CaO and Ca(OH)2 nanoparticles. Cryst. Res. Technol. (2012) 47(4) 471-478.
[9] Tran Thi Quynh Hoa, Le Thi Thanh Binh, Le Van Vu, Nguyen Ngoc Long, Vu Thi Hong Hanh, Vu Duc Chinh
and Pham Thu Nga. Luminescent ZnS:Mn/thioglycerol and ZnS:Mn/ZnS core/shell nanocrystals: Synthesis and
characteization. Optical Materials. (2012) 35 136-140.