DSpace at VNU: Portable Capillary Electrophoresis Instrument with Automated Injector and Contactless Conductivity Detection
Bạn đang xem bản rút gọn của tài liệu. Xem và tải ngay bản đầy đủ của tài liệu tại đây (322.98 KB, 7 trang )
Article
pubs.acs.org/ac
Portable Capillary Electrophoresis Instrument with Automated
Injector and Contactless Conductivity Detection
Thanh Duc Mai,†,‡ Thi Thanh Thuy Pham,†,‡ Hung Viet Pham,‡ Jorge Sáiz,§ Carmen García Ruiz,§
and Peter C. Hauser*,†
†
Department of Chemistry, University of Basel, Spitalstrasse 51, 4056 Basel, Switzerland
Centre for Environmental Technology and Sustainable Development (CETASD), Hanoi University of Science, Nguyen Trai Street
334, Hanoi, Viet Nam
§
Department of Chemistry I and University Institute of Research in Police Sciences (IUICP), University of Alcalá, Ctra.
Madrid-Barcelona km 33.6, Alcalá de Henares, Madrid, Spain
‡
ABSTRACT: A portable capillary electrophoresis instrument
featuring an automated, robust, valve-based injection system
was developed. This significantly facilitates operation in the
field compared to previous injection approaches. These
generally required delicate manual operations which are
difficult to perform outside the laboratory environment. The
novel system relies on pressurized air for solution delivery and
a micromembrane pump for sample aspiration. Contactless
conductivity detection was employed for its versatility and low
power requirement. The instrument has a compact design,
with all components arranged in a briefcase with dimensions of 45 × 35 × 15 cm (w × d × h) and a weight of about 8 kg. It can
operate continuously for 9 h in the battery-powered mode. Depending on the task at hand, the injection system allows easy
optimization for high separation efficiency, for fast separations, or for low limits of detection. To illustrate these features, the
separation of four anions within 16 s is demonstrated as well as the determination of nitrite below 1 μM. The determination of
phosphate at a sewage treatment plant was carried out to demonstrate a field application.
he use of portable instrumentation for field analysis is of
interest due to the rapid availability of results, elimination
of complications with sample storage and transport, and better
cost effectiveness than conventional benchtop analytical
systems. A mobile analytical instrument should satisfy requirements of compact size, lightweight, robustness, and low power
consumption. Automation of operation is also desirable.
Capillary electrophoresis (CE), with advantageous properties
including a wide range of accessible analytes, high separation
efficiency, short analysis time, low power requirements, limited
consumption of chemicals, and ease of installation, operation,
and maintenance, is a particularly interesting candidate for
portable analytical instrumentation.
One challenge for a portable CE system is detection. Optical
detection methods can only be implemented with nonstandard
light sources such as light-emitting diodes (LEDs) or laserdiodes because of the high power requirement of conventional
UV or visible sources, and these are not ideal for non-lightabsorbing inorganic or organic ions. Electrochemical detection
methods, on the other hand, are better suited for portable CE,
as their fully electronic configuration can easily be miniaturized
and translated into the compact, low power format. Of the
variants of electrochemical detection methods, capacitively
coupled contactless conductivity detection (C4D) is very
attractive, as it can be considered universal for all ionic species,
which includes the non-UV/vis-active ones, and the axial
T
© 2013 American Chemical Society
tubular arrangement of the electrodes positioned outside the
capillary offers ease in construction and operation. Publications
on fundamental aspects of C4D are available1−9 and discussions
of general applications of C4D for CE can be found in recent
reviews.10−14
To our knowledge, the first portable CE instrument was
reported by our group in 1998 and was based on
potentiometric and amperometric detection.15,16 The addition
of contactless conductivity detection was then reported in
2001,17 and this was later followed by a version with an
improved detector in 2007.18 Li and co-workers introduced a
portable CE instrument with potential gradient detection,19
which was later also fitted with a contactless conductivity
detector.20,21 The instrument is commercially available, and
Haddad and co-workers reported its use for the determination
of residues from improvised explosive devices using an optical
detector based on a light-emitting diode22 as well as a
contactless conductivity detector.23 Kaljurand and co-workers
developed a system for the on-site determination of chemical
warfare agent degradation products.24 Lee et al. described a
system with laser-induced fluorescence (LIF) detection based
on a solid-state laser.25 A detailed discussion of the portable CE
Received: November 16, 2012
Accepted: January 22, 2013
Published: January 22, 2013
2333
dx.doi.org/10.1021/ac303328g | Anal. Chem. 2013, 85, 2333−2339
Analytical Chemistry
■
instruments based on conventional capillaries up to 2010 can
be found in a review by Macka and co-workers.26 Also reported
have been portable systems based on microchip-CE devices.27−29
A weak point of the field-portable CE instruments reported
thus far has been the injection systems. These have generally
been very delicate, requiring careful manual operations. From
our experience with previous instruments,15−18 it has become
clear that a robust, automated injection system is necessary to
make the instruments amenable to routine use in field analysis.
The difficulty arises from the fact that in capillary electrophoresis very small volumes in the nanoliter range must be
injected into tiny capillaries. Because of the low volumes and
the high voltages involved, it is not possible to use rotary
injection valves for direct injection as ordinarily employed for
column chromatography. Therefore, usually the capillary itself
is placed temporarily into the sample container. Two modes of
injection are then possible. For electrokinetic injection, high
voltage is applied, while for hydrodynamic injection, siphoning
or pressurization is used, before the capillary is moved back to a
buffer container for application of the separation voltage. While
electrokinetic injection is easier to implement, the hydrodynamic mode is preferred, as it avoids a sampling bias.
Commercial benchtop instruments for the laboratory feature a
robotic system for movement of sample and buffer vials and/or
capillary end and pneumatic pressurization or application of a
vacuum. Little effort has been spent to date on the
development of injection systems for portable instruments.
The commercially available unit19 has a turntable and an
automated hydrodynamic injection arrangement similar to
conventional benchtop instruments. However, this is relatively
complex and fairly delicate. The research instruments reported
have relied on electrokinetic injection or improvised hydrodynamic injection, typically by manually elevating the injection
end of the capillary for a few seconds timed with a
wristwatch.15−18,25 Kaljurand and co-workers have addressed
this general weakness by developing different versions of split
injectors and used this approach in their instrument developed
for the determination of chemical warfare agents.24,30,31
Injection was carried out by emptying a sample into the
splitting device using a syringe. This is easier to perform than
manual injection directly into capillaries and was essential for
the reported field work on chemical warfare agents where the
operator had to wear full body protective clothing.24 However,
a limitation of this system was the fact that the injection relied
largely on the reproducibility of the pressure created by hand
when emptying the syringe.
The aim of the project reported herein was the development
of a further improved injection system for a portable instrument
which is fully automated and thus eliminates the operational
difficulties as well as any measurement bias of manual
injections. The arrangement employed is based on a split
injector which had been used in previous stationary instruments
based on sequential injection (SI) manifolds employing a
syringe pump and a multiposition valve.32,33 It takes the
approach reported by Kaljurand and co-workers31 for their
portable system further, in that the sample is passed through
the splitter automatically. The use of fixed pressurization and
computer-controlled timing precludes the variations of manual
operation. The injected volume can be set readily over a large
range, which allows easy optimization for different tasks. The
sample is drawn into the system automatically by using a small
membrane pump.
Article
EXPERIMENTAL SECTION
Chemicals, Sample Collection, and Preparation. All
chemicals were of analytical or reagent grade and purchased
from Fluka (Buchs, Switzerland) or Merck (Darmstadt,
Germany). Stock solutions (10 mmol/L) of chloride, nitrate,
sulfate, nitrite, fluoride, phosphate, oxalate, malonate, citrate,
succinate, phthalate, acetate, lactate, benzoate, vanillate,
ascorbate, and gluconate were used for the preparation of the
standards of inorganic and organic anions, using their respective
sodium or potassium salts. Before use, the capillary was
preconditioned with 1 M NaOH for 10 min and deionized
water for 10 min prior to flushing with buffer. Deionized water
purified using a system from Millipore (Bedford, MA) was used
for the preparation of all solutions and for sample dilution if
required. The soft drinks were passed through 0.45 μm
membrane filters and diluted 10 times before analysis. The
orange juice sample was first centrifuged for 10 min at 6000
rpm and filtered to remove the flesh content and then diluted
50 times due to the high concentration of citrate. For the
analysis of phosphate in wastewater, samples were filtered with
0.45 μm membrane filters and injected directly into the system
for analysis. No further treatment was carried out.
Instrumentation. The injection interface accommodating
the capillary and the ground electrode was machined in a
plexiglass block (3 cm × 2 cm × 2 cm) according to a
previously reported design.34 This was fitted with a micrograduated needle valve obtained from IDEX (P-470, Oak
Harbor, WA) and solenoid valves from NResearch (product
nos. 116T021 and 116T031, West Caldwell, NJ). Pressurization
was achieved using a steel cylinder (Swagelok 304L-HDF4150), a regulating valve (Swagelok 1ELA2C1000BK), and a
pressure gauge (Swagelok PGI-40M-BG6-LANX-0) (Arbor,
Niederrohrdorf, Switzerland). The miniature membrane pump
(NF-5-DCB) for sample aspiration was purchased from KNF
(Balterswil, Switzerland). All fluidic connections were made
with 0.02 in. inner diameter (I.D.) and 1/16 in. outer diameter
(O.D.) Teflon tubing and with polyether ether ketone (PEEK)
flangeless nuts and ferrules 1/4-28 UNF (IDEX). Two high
voltage modules (DX250 and DX250N) capable to provide a
maximum of 25 kV of either polarity were obtained from
EMCO (Sutter Creek, CA). Polyimide-coated fused silica
capillaries of 50 μm I.D. and 365 μm O.D., and capillaries of 25
μm I.D. and 365 μm O.D. (from Polymicro, Phoenix, AZ),
were used for separation. The high voltage end of the capillary
was isolated with a safety cage made from Perspex, which was
equipped with a microswitch to interrupt the high voltage upon
opening.
The purpose-made contactless conductivity detector was
based on a design reported previously9 and used an integrated
circuit oscillator from Exar (XR-2206, Fremont, CA) to create a
sine wave of 300 kHz, an OPA627 operational amplifier (Texas
Instruments, Dallas, TX) to bring the amplitude to ±10 V, an
OPA602 operational amplifier (Texas Instruments) fitted with
a 1.5 MΩ feedback resistor to convert the pick-up current to
voltage, and a monolithic AD630 synchronous detector
(Analog Devices, Norwood, MA) for rectification. The voltage
signal was then amplified, low-pass filtered,9 and passed to an
ADC-20 from Pico Technology (St. Neots, UK) connected to a
notebook class personal computer for data acquisition. Most of
the parts, i.e., valves, high voltage modules, and membrane
pump, were controlled from the same computer using an
Arduino Nano microcontroller board (RS Components,
2334
dx.doi.org/10.1021/ac303328g | Anal. Chem. 2013, 85, 2333−2339
Analytical Chemistry
Article
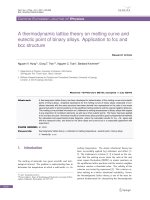
Figure 1. Diagram of the fluidic connections of the instrument. Pt denotes the two platinum electrodes for application of the high voltage (HV) for
separation. The injector/interface is grounded, while the voltage is applied from the detector end.
at the same time. All components were integrated into an
aluminum briefcase with the dimensions of 35 cm (w) × 45 cm
(d) × 15 cm (h), and the system had a weight of 8 kg. A
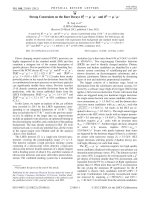
photograph of the assembly is shown in Figure 2. The fluidic
Wädenswil, Switzerland) programmed using the Arduino
integrated development environment and appropriate interface
circuitry. The instrument features built-in rechargeable lithiumion batteries. A battery pack of 14.8 V and a capacity of 6.6 Ah
with the dimensions of 73 × 55 × 67 mm (CGR 18650CG
4S3P, Contrel, Hünenberg, Switzerland), which was fitted with
a voltage regulator to produce a 12 V output, was used to
provide power to the valves, membrane pump, and the high
voltage modules. A separate pair of smaller Li-ion batteries with
a capacity of 2.8 Ah each (CGR 18659CG 4S1P, Contrel),
which was fitted with positive and negative 12 V regulators,
provided the split ±12 V supply for the detector circuitry.
Alternatively, mains power can be utilized when available via
appropriate external adaptors.
■
RESULTS AND DISCUSSION
System Design. A schematic drawing of the system is
shown in Figure 1. Precise propulsion of fluids through the
system is made possible by pressurizing a reservoir of
background electrolyte with compressed air. This is provided
from a small metal cylinder which is filled with a manual pump
(normally used to pressurize shock absorbers of bicycles). The
pressure delivered can be set with a regulating valve and
monitored with a small gauge. The sample is loaded into a
sample loop which is extended between two three-way valves as
described previously by Sweileh and Dasgupta.35 Note that it
would also be possible to use a rotary valve as is customary for
flow-injection analysis or column chromatography, but the use
of the solenoid valves is simple and less expensive. The loop is
filled by using a small membrane pump to aspirate a sample
directly through a thin tube. If preferred, manual filling of the
loop with a syringe is also possible. Subsequently, the sample is
moved to the injector block by switching the three-way valves 1
and 2 (V1 and V2) to allow background electrolyte to flow
from the pressurized reservoir. A fraction of the sample is
pushed into the capillary for hydrodynamic injection as the plug
is located at its front end while applying a back-pressure for a
determined period of time. The back-pressure is set by
adjustment of the needle valve (a bleeding type which splits
the flow into two paths) and applied for the desired duration by
closure of gate valve V3 (while V4 stays open). Flushing of the
interface and the manifold ahead of the interface, as well as of
the capillary, is possible by either opening or closing V3 and V4
Figure 2. Photograph of the instrument. (1) Membrane pump, (2)
valves, (3) splitter, (4) detector, (5) safety cage for application of high
voltage, (6) pressurized air.
parts are seen on the left. The plexiglass cage to the right
contains the high voltage electrode, and the small metal box
sitting on top is the C4D-cell. The pneumatic parts for
pressurization of the buffer reservoir are seen to the far right.
The control and detector electronics as well as the rechargeable
batteries are contained in the back of the instrument, and some
manual switches and connectors are mounted on the panel.
The internal batteries were found to provide sufficient power
for typically about 9 h of operation before recharging was
necessary.
Performance. Standard Separation of Some Common
Inorganic Cations and Anions. To demonstrate the versatility
of the system in analyzing different target analytes, the
separation of some common inorganic anions and cations
was carried out using a background electrolyte consisting of 12
mM histidine adjusted to pH 4 with acetic acid in the presence
of 2 mM 18-crown-6, which is commonly used for the
separation of inorganic cations and anions by CE-C4D.32 The
crown ether facilitates the separation of NH4+ and K+. The
separations of these cations and anions were carried out by
2335
dx.doi.org/10.1021/ac303328g | Anal. Chem. 2013, 85, 2333−2339
Analytical Chemistry
Article
1000 μM, respectively. The reproducibilities of peak areas and
migration times were determined over a period of 8 h. The
system was programmed to autonomously carry out repeated
injections and separations of the standard mixture of 50 μM
every 10 min throughout this duration, i.e., a total of 48
measurements. The standard deviations for peak areas were
well acceptable, being about 1%, and the stability of migration
times was also excellent. Note, that the standard deviations
were calculated from the nine data points acquired after each
hour. A systematic drift in these parameters over the time
period is not apparent in the data. This demonstrates the
inherent stability of the mechanical and electronic design of the
system. However, under field conditions, due to temperature
changes and other effects, larger fluctuations can be expected.
Fast Separation. The system can be optimized differently to
meet different objectives. Very fast separations are possible by
using a capillary with a short effective length of only a few
centimeters. Note, that this is not readily possible with standard
benchtop instruments, as these are not designed accordingly. A
further requirement is a fast and well reproducible automated
injection system for small sample plugs,36,37 which has not been
available for portable CE instruments. The separation of four
inorganic anions (Cl−, NO3−, NO2−, SO42−) within 17 s carried
out on the current system is demonstrated in Figure 4. To
accelerate the migrations of anions, an elevated electric field
was applied by introduction of a high voltage of +15 kV over a
short capillary of only 25 cm. The detector was positioned 4.5
cm from the injection end. To inject only a short plug, the
back-pressure was reduced compared to the test reported in the
previous section and the injection time was shortened to 1 s
only. While baseline separation was achieved in both cases, it is
clear from a comparison of Figures 3 and 4 that a more
complex sample would require the better separation possible in
the longer capillary. Under the conditions for fast separation,
the LODs for Cl−, NO3−, and NO2− were 5 μM and the LOD
for SO42− was 2.5 μM, which is still acceptable and only
approximately 2 times higher than those for normal conditions.
Enhanced Detection Limit. When separation efficiency is
not a limitation, LODs can be enhanced by introducing a large
sample volume. This is illustrated in Figure 5 for the analysis of
a tap water sample spiked with 1 μM NO2− as a potential
analyte of interest which is well separated from other species.
As can be seen from electropherogram (a) of Figure 5, for a
normal injection volume, for which chloride, nitrate, and sulfate
are well separated, a peak for nitrite is not visible, as its
concentration is below the detection limit. When the injected
volume is increased, by prolonging the injection time from 4 to
10 s and increasing the backpressure, nitrite becomes detectable
as the LOD is lowered to 0.7 μM (electropherogram b).
However, it is clear that the separation of the three major
anions (Cl−, NO3−, SO42−) was not possible under these
conditions.
High Peak Capacity. Complex samples containing a
relatively large number of similar ions require conditions that
give good peak capacities. This usually requires relatively long
residence times with long capillaries if the sensitivity is not to
be compromised. Such an application is illustrated for the
current system with the simultaneous separation of 11 slowly
migrating organic anions, namely oxalate, malonate, citrate,
succinate, phthalate, acetate, lactate, benzoate, vanillate,
ascorbate, and gluconate. These compounds are found in
various beverages either as major constituents or as additives.
Separation was successfully achieved using a basic background
switching the polarity of the system between negative and
positive modes. The relatively low pH-value of the buffer leads
to a limited electroosmotic flow so that the anions can be
determined without surface modification of the capillary.
Separations of standard solutions of these cations (NH4+, K+,
Ca2+, Na+, Mg2+, and Li+) and anions (Cl−, NO3−, SO42−,
NO2−, F−, and H2PO4−) at 50 μM for each ion are shown in
Figure 3. The quantitative performance data for the conditions
Figure 3. Typical separation of a standard solutions containing: (A)
inorganic anions; (B) inorganic cations; 50 μM for each ion.
Background electrolyte: His 12 mM adjusted to pH 4 with acetic
acid in the presence of 2 mM of 18-crown-6. Capillary: 50 μm I.D., 36
cm effective length, and 50 cm total length. Separation voltage: +15 kV
for anions and −15 kV for cations. Injection: pressure, 1 bar; sample
loop, 150 μL; splitting valve set to 0.15; injection time, 4 s.
used is given in Table 1. The limits of detection were in the
lower micromolar range. The linear ranges depended on the
species. Baseline separation between NH4+ and K+ as well as
the peaks of Ca2+ and Na+ were still achieved at the
concentration of 100 μM for each cation. However, at higher
concentrations, baseline separation of these peaks was lost. In
the case of Mg2+ and Li+, linear ranges extended to 200 and
2336
dx.doi.org/10.1021/ac303328g | Anal. Chem. 2013, 85, 2333−2339
Analytical Chemistry
Article
Table 1. Linearity, Detection Limits (LODs), Correlation Coefficients (r2), and Reproducibilities for the Determination of
Inorganic Cations and Anions
ion
NH4+
+
K
Ca2+
Na+
Mg2+
Li+
Cl−
NO3−
SO42−
NO2−
F−
H2PO4−
a
linear range (μM)
r2
LODa (μM)
intraday reproducibility of peak area (%RSD)b
intraday reproducibility of migration time (%RSD)b
6−100
6−100
6−100
10−100
10−200
10−1000
10−1000
10−450
5−450
10−1000
27−2000
57−500
0.9994
0.9996
0.9983
0.9994
0.9992
0.9999
0.9999
0.9999
0.9999
0.9999
0.9998
0.9991
2
2
2
3
3
5
3
3
1.5
3
8
17
1.1
1.7
0.6
1.4
1.0
1.8
0.9
1.0
0.6
0.7
2.1
2.4
0.5
0.4
0.4
0.5
0.3
0.3
0.6
0.4
0.3
0.6
0.5
0.3
Peak heights corresponding to 3 × baseline noise. bDetermined for 50 μM, n = 9, over a period of 8 h.
Figure 4. Fast separation of Cl−, NO3−, SO42−, and NO2− at 50 μM.
Background electrolyte: His 12 mM adjusted to pH 4 with acetic acid
in the presence of 2 mM of 18-crown-6. Capillary: 25 μm I.D., leff/Ltot
= 4.5/25 cm. Separation voltage: +15 kV. Injection: pressure, 1 bar;
sample loop, 150 μL; splitting valve set to 0.20; injection time, 1 s.
Figure 5. Sensitive determination of a tap water sample spiked with 1
μM NO2−. (a) Normal injection volume: 1 bar, 150 μL, splitting valve
set to 0.15, 4 s. (b) Large volume injection: pressure, 1 bar; sample
loop, 150 μL; splitting valve set to 0.10; injection time, 10 s.
Background electrolyte: His 12 mM adjusted to pH 4 with acetic acid
in the presence of 2 mM of 18-crown-6. Capillary: 50 μm I.D., 36 cm
effective length and 60 cm total length. Separation voltage: +15 kV.
electrolyte of Tris/CHES at a concentration of 70 mM for each
compound and in the presence of 200 μM CTAB for reversal of
the electroosmotic flow. Three different soft drinks were
analyzed as illustrative samples for this demonstration. The
electropherograms for a standard mixture and for soft drink
samples are shown in Figure 6. Electropherogram b is for a soft
drink made from a byproduct of cheese production and for this
reason contains a large concentration of lactate besides other
anionic species. The cola beverage (electropherogram c) was
found to contain phosphate, while the orange juice (electropherogram d), as expected, contained a high concentration of
citrate.
Application Example. Field Measurements of Phosphate
at a Wastewater Treatment Plant. To demonstrate its
suitability for field work, the instrument was taken to a local
sewage treatment plant and set up for the determination of
phosphate. A solution of 1 mM His/25 mM acetic acid (pH
3.5) was found to be an optimal background electrolyte for the
determination of this species. Under this condition, the
phosphate peak is very well separated from the very broad
peak of the major anions (Cl−, NO3−, and SO42−) which are
present in the sewage water at very high concentrations
(ranging from 1 to 4.5 mM). An electropherogram for
separation of phosphate in a sewage water sample is shown
in Figure 7. In Table 2 the phosphate concentrations (mg P/L)
measured with the new instrument in several samples are given
together with the results from the standard photometric
molybdenum blue method for validation. The first six samples
were determined in the field (single measurements), and the
remainder back in the laboratory (in triplicate). As shown in
Table 2, the results from the CE method are in good agreement
with those obtained from the molybdenum blue reference
method (errors between the two methods were less than 10%
for measurement done in the lab). However, the on-site
2337
dx.doi.org/10.1021/ac303328g | Anal. Chem. 2013, 85, 2333−2339
Analytical Chemistry
Article
Table 2. Concentrations of Phosphate in Sewage Samples
Measured in the Field and in the Laboratory
sample
capillary electrophoresis
(mg P/L)
molybdenum blue method
(mg P/L)
%
error
1
2
3
4
5
6
7a
8a
9a
10a
11a
2.1
2.3
1.5
1.5
1.5
1.8
3.6
4.9
3.5
0.54
0.76
2.4
2.1
1.6
1.6
1.8
2.1
3.6
4.6
3.4
0.58
0.78
13
6
8
9
16
15
1
7
2
8
2
a
Samples measured in the laboratory.
the precision of injection. The detection limit of the method
was 0.15 mg P/L (5 μM) (based on S/N = 3), and its linear
range extended from 0.5 mg P/L (16 μM) to 10 mg P/L (320
μM).
Figure 6. High efficiency separations. (a) Eleven organic compounds
often found in beverages and carbonate. (b) Lactate-containing
softdrink. (c) Cola beverage, (d) Orange juice. Background electrolyte: Tris/CHES 70 mM and CTAB 0.2 mM (pH 8.5). Capillary: 25
μm I.D.; leff/Ltot = 36/65 cm. Separation voltage: +15 kV. Injection:
pressure, 1 bar; sample loop, 60 μL; splitting valve set to 0.15;
injection time, 4 s. Peaks: (1) oxalate, (2) malonate, (3) citrate, (4)
succinate, (5) phthalate, (6) carbonate, (7) acetate, (8) lactate, (9)
benzoate, (10) vanillate, (11) ascorbate, (12) gluconate, (13) chloride,
(14) nitrate, (15) sulfate, (16) phosphate, (17) unidentified
compound.
■
CONCLUSIONS
The portable CE-C4D instrument with automated injection
built in-house showed a good performance with high
reproducibility. The results obtained confirm its suitability for
on-site measurements. The system may be optimized for
different compromise conditions with regard to detection
limits, dynamic range, separation efficiency, and analysis time
according to the task at hand. As demonstrated by the
autonomous stability test, which extended over 8 h duration,
the instrument also has the potential to be set up for
unattended monitoring operations. This is facilitated by the
automated aspiration of the sample.
■
AUTHOR INFORMATION
Corresponding Author
*E-mail: ; tel: ++ 41 61 267 1003; fax:
++41 61 267 1013.
Notes
The authors declare no competing financial interest.
■
ACKNOWLEDGMENTS
The authors thank the Swiss Federal Commission for
Scholarships for Foreign Students (ESKAS) for a grant to
Thi Thanh Thuy Pham (Grant No. 2010.0331), as well as the
Swiss National Science Foundation (Grant No. 200020137676/1) and NAFOSTED (Grant No. 104.07-2010.45) of
Vietnam for financial support. We also thank Mr. Vock and Mr.
Huber at the sewage treatment plant in Birsfelden for their
assistance with the field test.
■
Figure 7. Detection of phosphate (1.6 mg P/L) in a sewage sample.
Background electrolyte: His 1 mM/acetic acid 25 mM (pH 3.47).
Capillary: 50 μm I.D.; leff/Ltot = 29/50 cm. Separation voltage: +15 kV.
Injection: pressure, 1 bar; sample loop, 60 μL; splitting valve set to
0.12; injection time, 4 s.
REFERENCES
(1) Mai, T. D.; Hauser, P. C. The Chemical Record 2012, 12, 106−
113.
(2) Kubáň, P.; Hauser, P. C. Electrophoresis 2009, 30, 176−188.
(3) Kubáň, P.; Hauser, P. C. Electrophoresis 2004, 25, 3398−3405.
(4) Kubáň, P.; Hauser, P. C. Electrophoresis 2004, 25, 3387−3397.
(5) Brito-Neto, J. G. A.; da Silva, J. A. F.; Blanes, L.; do Lago, C. L.
Electroanalysis 2005, 17, 1198−1206.
(6) Brito-Neto, J. G. A.; da Silva, J. A. F.; Blanes, L.; do Lago, C. L.
Electroanalysis 2005, 17, 1207−1214.
measurement generally gave higher deviations which is ascribed
to the fact that the freshly collected wastewater samples
contained some bubbles of dissolved gases. As no degassing
could be carried out in the field, these would have influenced
2338
dx.doi.org/10.1021/ac303328g | Anal. Chem. 2013, 85, 2333−2339
Analytical Chemistry
Article
(7) Zemann, A. J. Electrophoresis 2003, 24, 2125−2137.
(8) Tanyanyiwa, J.; Leuthardt, S.; Hauser, P. C. J. Chromatogr., A
2002, 978, 205−211.
(9) Tanyanyiwa, J.; Galliker, B.; Schwarz, M. A.; Hauser, P. C. Analyst
2002, 127, 214−218.
(10) Kubáň, P.; Hauser, P. C. Electrophoresis 2013, 34, 55−69.
(11) Kubáň, P.; Hauser, P. C. Electrophoresis 2011, 32, 30−42.
(12) Kubáň, P.; Hauser, P. C. Anal. Chim. Acta 2008, 607, 15−29.
(13) Trojanowicz, M. Anal. Chim. Acta 2009, 653, 36−58.
(14) Matysik, F. M. Microchim. Acta 2008, 160, 1−14.
(15) Kappes, T.; Hauser, P. C. Anal. Commun. 1998, 35, 325−329.
(16) Kappes, T.; Schnierle, P.; Hauser, P. C. Anal. Chim. Acta 1999,
393, 77−82.
(17) Kappes, T.; Galliker, B.; Schwarz, M. A.; Hauser, P. C. TrAC,
Trends Anal. Chem. 2001, 20, 133−139.
(18) Kubáň, P.; Nguyen, H. T. A.; Macka, M.; Haddad, P. R.; Hauser,
P. C. Electroanalysis 2007, 19, 2059−2065.
(19) Xu, Y.; Qin, W. D.; Li, S. F. Y. Electrophoresis 2005, 26, 517−
523.
(20) Xu, Y.; Li, S. F. Y. Electrophoresis 2006, 27, 4025−4028.
(21) Xu, Y.; Wang, W. L.; Li, S. F. Y. Electrophoresis 2007, 28, 1530−
1539.
(22) Hutchinson, J. P.; Evenhuis, C. J.; Johns, C.; Kazarian, A. A.;
Breadmore, M. C.; Macka, M.; Hilder, E. F.; Guijt, R. M.; Dicinoski, G.
W.; Haddad, P. R. Anal. Chem. 2007, 79, 7005−7013.
(23) Hutchinson, J. P.; Johns, C.; Breadmore, M. C.; Hilder, E. F.;
Guijt, R. M.; Lennard, C.; Dicinoski, G.; Haddad, P. R. Electrophoresis
2008, 29, 4593−4602.
(24) Kubáň, P.; Seiman, A.; Makarõtševa, N.; Vaher, M.; Kaljurand,
M. J. Chromatogr., A 2011, 1218, 2618−2625.
(25) Lee, M.; Cho, K.; Yoon, D.; Yoe, D. J.; Kang, S. H.
Electrophoresis 2010, 31, 2787−2795.
(26) Ryvolová, M.; Preisler, J.; Brabazon, D.; Macka, M. TrAC,
Trends Anal. Chem. 2010, 29, 339−353.
(27) Kaigala, G. V.; Behnam, M.; Bliss, C.; Khorasani, M.; Ho, S.;
McMullin, J. N.; Elliott, D. G.; Backhouse, C. J. IET Nanobiotechnol.
2009, 3, 1−7.
(28) Kumar, A.; Burns, J.; Hoffmann, W.; Demattio, H.; Malik, A. K.;
Matysik, F. M. Electrophoresis 2011, 32, 920−925.
(29) Jackson, D. J.; Naber, J. F.; Roussel, T. J.; Crain, M. M.; Walsh,
K. M.; Keynton, R. S.; Baldwin, R. P. Anal. Chem. 2003, 75, 3643−
3649.
(30) Seiman, A.; Jaanus, M.; Vaher, M.; Kaljurand, M. Electrophoresis
2009, 30, 507−514.
(31) Kubáň, P.; Seiman, A.; Kaljurand, M. J. Chromatogr., A 2011,
1218, 1273−1280.
(32) Mai, T. D.; Schmid, S.; Müller, B.; Hauser, P. C. Anal. Chim.
Acta 2010, 665, 1−6.
(33) Mai, T. D.; Hauser, P. C. Talanta 2011, 84, 1228−1233.
(34) Kubáň, P.; Engström, A.; Olsson, J. C.; Thorsén, G.; Tryzell, R.;
Karlberg, B. Anal. Chim. Acta 1997, 337, 117−124.
(35) Sweileh, J. A.; Dasgupta, P. K. Anal. Chim. Acta 1988, 214, 107−
120.
(36) Wuersig, A.; Kubáň, P.; Khaloo, S. S.; Hauser, P. C. Analyst
2006, 131, 944−949.
(37) Rainelli, A.; Hauser, P. C. Anal. Bioanal. Chem. 2005, 382, 789−
794.
2339
dx.doi.org/10.1021/ac303328g | Anal. Chem. 2013, 85, 2333−2339