DSpace at VNU: High pressure melting curves of silver, gold and copper
Bạn đang xem bản rút gọn của tài liệu. Xem và tải ngay bản đầy đủ của tài liệu tại đây (556.6 KB, 10 trang )
High pressure melting curves of silver, gold and copper
Ho Khac Hieu and Nguyen Ngoc Ha
Citation: AIP Advances 3, 112125 (2013); doi: 10.1063/1.4834437
View online: />View Table of Contents: />Published by the AIP Publishing
Articles you may be interested in
Systematic prediction of high-pressure melting curves of transition metals
J. Appl. Phys. 116, 163505 (2014); 10.1063/1.4899511
The melting curve of ten metals up to 12 GPa and 1600 K
J. Appl. Phys. 108, 033517 (2010); 10.1063/1.3468149
X-ray diffraction measurements of Mo melting to 119 GPa and the high pressure phase diagram
J. Chem. Phys. 130, 124509 (2009); 10.1063/1.3082030
HighPressure DebyeWaller and Grüneisen Parameters of Gold and Copper
AIP Conf. Proc. 706, 65 (2004); 10.1063/1.1780185
Equations of State for Cu, Ag, and Au for Wide Ranges in Temperature and Pressure up to 500 GPa and Above
J. Phys. Chem. Ref. Data 30, 515 (2001); 10.1063/1.1370170
All article content, except where otherwise noted, is licensed under a Creative Commons Attribution 3.0 Unported license. See: />Downloaded to IP: 137.30.242.61 On: Wed, 10 Dec 2014 08:55:03
AIP ADVANCES 3, 112125 (2013)
High pressure melting curves of silver, gold and copper
Ho Khac Hieu1,a and Nguyen Ngoc Ha2
1
Research and Development Center for Science and Technology, Duy Tan University, K7/25
Quang Trung, Danang, Vietnam
2
VNU-Hanoi University of Science, 334 Nguyen Trai, Hanoi, Vietnam
(Received 25 September 2013; accepted 12 November 2013; published online 20 November
2013)
In this work, based on the Lindemann’s formula of melting and the pressure-dependent
Gr¨uneisen parameter, we have investigated the pressure effect on melting temperature
of silver, gold and copper metals. The analytical expression of melting temperature
as a function of volume compression has been derived. Our results are compared
with available experimental data as well as with previous theoretical studies and the
good and reasonable agreements are found. We also proposed the potential of this
approach on predicting melting of copper at very high pressure. C 2013 Author(s). All
article content, except where otherwise noted, is licensed under a Creative Commons
Attribution 3.0 Unported License. [ />
I. INTRODUCTION
Melting of materials under extreme condition is one of the interesting subjects in physics
because of its importance in studying shock physics, planetary science, astrophysics, geophysics
and nuclear physics. Many efforts have been made to determine the high-pressure melting temperatures of metals. Nevertheless, the prediction of high-pressure melting curves of transition metals
is a controversial issue because of the difference among diamond-anvil cell (DAC) experiments,1
X-ray diffraction measurements,2 shock-wave experiments,3 computer simulations4 and theoretical
approaches.5 Furthermore, in recent years the experimental researchers have measured the melting
temperature of materials in ultra-high pressures (up to hundreds of GPa).6–10 Consequently, building
the theory for determining the melting of materials under high pressure is a topical and scientific
significance.
In particular, the melting investigation of the Group 11 metals hold great importance. The number
of papers including experimental as well as theoretical approaches has been performed to study the
high-pressure melting of copper (Cu).11–18 Its face-centered cubic structure is predicted to still
remain stable up to more than 2500 GPa.19, 20 In contrast, there were a few early works considering
the melting of silver (Ag) and gold (Au) metals before.11–13 On the experimental side, Akella and
Kennedy conducted the experiments for coinage metals up to 6.5 GPa using thermocouples and
differential thermal analysis (DTA).11 Melting behaviors of these metals were re-considered by
Mirwald et al. using DTA12 and by Errandonea thanks to steel-belted Bridgman-type cell.13 Japel
et al. reported melting curve of solid Cu in the laser-heated DAC to 97 GPa and 3800 K.14 Using
multi-anvil techniques, Brand and collaborators determined melting temperature of Cu from ambient
pressure to 16 GPa.15 On the theoretical side, the Cu melting lines had been evaluated to very high
pressures. Belonoshko et al. and Voˇcadlo et al. estimated high-pressure melting temperature by
molecular dynamic calculations (up to above 200 GPa)16 and by first-principles calculations with
phase coexistence approach (up to 100 GPa),17 respectively. By means of large scale molecular
dynamics simulations of solid-liquid coexistence, for the first time, Wu et al. predicted the melting
of Cu up to 400 GPa.18 Although there are a number of literatures focusing on high-pressure melting
a Corresponding author: Electronic mail:
2158-3226/2013/3(11)/112125/9
3, 112125-1
C
Author(s) 2013
All article content, except where otherwise noted, is licensed under a Creative Commons Attribution 3.0 Unported license. See: />Downloaded to IP: 137.30.242.61 On: Wed, 10 Dec 2014 08:55:03
112125-2
H. K. Hieu and N. N. Ha
AIP Advances 3, 112125 (2013)
problem of metals,1–18 the prediction of melting temperature under ultra-high-pressure is still a
challenge for both experimental as well as theoretical physicists, especially, in the case of Ag and
Au metals.
In present paper, the high-pressure melting problem is going to be accessed based on
semi-empirical approach. We combine the Lindemann’s melting criterion21 with the pressuredependent Gr¨uneisen parameter22 to carry out the relatively simple analytical expression of melting
Tm as a function of crystal volume compression V /V0 . To express the melting temperature of
metal as a function of pressure we use the pressure-volume relation as the well-established Vinet
equation-of-state (EOS).23–25 Numerical calculations for Ag, Au and Cu are performed up to
volume compression V /V0 = 0.5 and up to ultra-high pressure corresponding to this compression
(460 GPa, 770 GPa and 500 GPa, respectively) where no experimental data exist yet. Our results are
going to be compared with recent experimental and theoretical studies when possible. We show that
our melting evaluations for Ag and Cu metals are in very good agreement with those of previous
works.
II. FORMALISM
¨
A. Pressure-dependent Gruneisen
parameter
The Gr¨uneisen parameter has been suggested by Gr¨uneisen26 to describe the effects of volume
change on phonon frequencies ωi and defined as22
γG = −
i
∂ ln ω0
∂ ln ωi
=−
,
∂ ln V
∂ ln V
(1)
where V is crystal volume and ωi are phonon frequencies which depend only on volume V .
Normally, the Gr¨uneisen parameter can be rated as constant which does not depend on pressure
variation.13 Nevertheless, some experimental results have proposed the law as γG /V = const.30
In recent study, by first-principles electronic band-structure calculations combined with a Bornvon K´arm´an force model, the Graf et al.22 determined the lattice vibrations in the quasi-harmonic
approximation for Au and Cu metals. Gr¨uneisen parameters γ G and their pressure dependence had
been considered. This group also derived approximations based on the bulk modulus B and the meansquare displacement u2 or Debye-Waller factor for the high temperature Gr¨uneisen parameter by
follows
1 1 ∂ ln B
,
γ ≈ γB = − −
6 2 ∂ ln V
(2)
and
γ ≈ γ DW =
1 ∂ ln u 2
.
2 ∂ ln V
(3)
To evaluate the pressure effect on Gr¨uneisen parameter, Graf et al. fitted the calculated γ G
values to the quite well described expression as
γ G = γ0
V
V0
q
,
(4)
where γ 0 and V0 are Gr¨uneisen parameter and crystal volume at ambient conditions, respectively.
The value of q belongs to studied material, usually, q > 1 and q < 2. It should be noticed that, the
expression γG /V = const is a particular case of equation (4) when q = 1 is applied.
B. Lindemann’s criterion and pressure-dependent melting temperature
On study the melting of materials, Lindemann argued that, melting is going to occur when the
ratio between mean-square vibration and square of nearest-neighbor distance reaches a threshold
All article content, except where otherwise noted, is licensed under a Creative Commons Attribution 3.0 Unported license. See: />Downloaded to IP: 137.30.242.61 On: Wed, 10 Dec 2014 08:55:03
112125-3
H. K. Hieu and N. N. Ha
AIP Advances 3, 112125 (2013)
TABLE I. Experimental melting temperature T0 and Gr¨uneisen parameter γ 0 , q of Cu and Au metals.22
Metals
Au
Cu
γ0 (V0 )
γ0 (V0 ) B
γ0 (V0 ) DW
q
qB
q DW
T0 (K)
2.95
1.85
2.72
2.29
3.00
1.68
1.229
0.445
1.064
0.774
1.481
0.623
1337.33
1357.77
value.21 Using the Lindemann’s concept, the empirical evaluation of melting under pressure of many
metals had also been performed in the number of literatures before.27–29
Based on the classical mean field potential (MFP) approach, Wang et al.31 derived the following
melting formula which can be seen as a generalization of the Lindemann’s law
2
Tm = const × V 3 .θ D2 ,
(5)
where crystal volume V and Debye temperature θ D are quantities which depend on pressure variation.
Taking the volume derivative of the natural logarithm of formula (5) we derived
∂ ln (Tm )
2
=
∂V
V
1
− γG ,
3
(6)
where γ G is Gr¨uneisen parameter which is in Debye model defined as γG = −∂ ln θ D /∂ ln V .
Substituting Eq. (4) into Eq. (6) and taking the integral, we carried out the analytical formula
of melting Tm as a function of volume compression V /V0 as
Tm = T0
V
V0
2/3
exp
2γ0
1−
q
V
V0
q
,
(7)
in the above equation, T0 is the melting temperature of metal at ambient conditions.
Taking into account Eq. (7), the melting temperatures of coinage metals under high pressure
can be calculated numerically. It is obviously that indispensable input parameters required to study
melting temperature Tm as a function of volume compression V /V0 are T0 , γ 0 and q. Melting
temperature T0 at ambient conditions can be gathered from experiments. The values q and γ 0 of
Au and Cu metals were fitted from Gr¨uneisen parameters computed by first-principles electronic
band-structure calculations and bulk modulus B and Debye-Waller factor u2 approximations.22
III. NUMERICAL CALCULATIONS AND DISCUSSIONS
Now we apply the expressions derived in previous section to consider the high-pressure melting
Tm of Ag, Au and Cu metals. Melting temperature T0 and Gr¨uneisen parameter γ 0 of Ag at ambient
pressure are 1234.93 K and 2.65,32 respectively; q is assumed to equal to 1. The values of T0 , and
fitting parameters γ 0 and q for Au and Cu are listed in Table I.
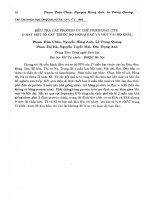
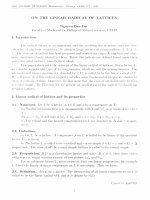
Making the numerical calculations of Tm by using Eq. (7), the melting curves as functions
of volume compressions V /V0 of Ag, Au and Cu metals are shown in the Fig. 1(a), Fig. 1(b) and
Fig. 1(c), respectively. Tm , TmB and Tm DW correspond to melting temperatures calculated using fitting
parameter sets {γ 0 , q}, {γ 0B , qB } and {γ0DW , q DW }. As it can be seen, when pressure increases,
the melting temperatures Tm of these metals rise rapidly; about 11000 K for Ag, 12000 − 13000
K for Au and 6000 − 10000 K for Cu at volume compression V /V0 = 0.5. Notwithstanding, it
has the difference among the values of Tm calculated by using various fitting parameters {γ 0 , q}.
At volume compression V /V0 = 0.5, melting deviation about 1000 K for Au and 4000 K for Cu;
at pressure V /V0 = 0.7, melting deviation is smaller, about below 200 K for Au and 1000 K for
Cu. The calculated melting temperatures Tm are getting along if 0.85 ≤ V /V0 ≤ 1. It suggests that
the investigation of high-pressure melting of Au and Cu by Lindemann’s criterion approach can
be applied in range of volume compressions 0.85 ≤ V /V0 ≤ 1 when the divergence of melting
temperatures Tm calculated by various fitting parameters {γ 0 , q} is not too large.
The different behaviors of Tm , TmB and Tm DW can be explained using simple demonstration
proposed by Graf et al.22 At such high pressures, phonon frequencies stiffen drastically and simul-
All article content, except where otherwise noted, is licensed under a Creative Commons Attribution 3.0 Unported license. See: />Downloaded to IP: 137.30.242.61 On: Wed, 10 Dec 2014 08:55:03
112125-4
H. K. Hieu and N. N. Ha
AIP Advances 3, 112125 (2013)
12000
Ag
Melting temperature T
m
10000
8000
6000
4000
2000
0
1
0.9
0.8
0.7
Volume compression V/V0
0.6
0.5
0.6
0.5
0.6
0.5
(a)
14000
Au
10000
m
Melting temperature T (K)
12000
Tm
T
8000
mB
T
mDB
6000
4000
2000
0
1
0.9
0.8
0.7
Volume compression V/V0
(b)
10000
Melting temperature Tm (K)
9000
Cu
8000
7000
Tm
6000
TmB
TmDB
5000
4000
3000
2000
1000
1
0.9
0.8
0.7
Volume compression V/V0
(c)
FIG. 1. Melting curves of Ag, Au and Cu metals as functions of volume compressions V /V0 .
All article content, except where otherwise noted, is licensed under a Creative Commons Attribution 3.0 Unported license. See: />Downloaded to IP: 137.30.242.61 On: Wed, 10 Dec 2014 08:55:03
112125-5
H. K. Hieu and N. N. Ha
AIP Advances 3, 112125 (2013)
TABLE II. The least-squares fitting parameters K0 and K 0 of Ag, Au and Cu metals under ambient conditions.
Metals
K0 (GPa)
K0
a Reference
b Reference
Ag
Au
Cu
101a
5.97a
167b
6.00b
133b
5.30b
24.
25.
taneously bulk modulus B increase with the decreasing of crystal volume V . The dispersion slope
at near zone center is roughly proportional to the bulk modulus B, while all frequencies weighted
by the temperature-dependent occupation factor of each mode have been averaged by Debye-Waller
factor u2 .
To the authors’s knowledge, in most of previous high-pressure melting studies the authors only
showed melting curves Tm as functions of pressure P. Consequently, to compare our calculations
with those of previous experiments and theoretical determinations, we took into account the relation
between pressure P and volume compression V /V0 from well-established and up-to-date Vinet EOS
formulation for each metal.23 This EOS has form as
P = 3K 0
V
V0
−2/3
1−
V
V0
1/3
exp
3
K −1 × 1−
2 0
V
V0
1/3
,
(8)
where K0 and K 0 are the isothermal bulk modulus and its pressure derivative at ambient pressure,
respectively. The least-squares fitting parameters K0 and K 0 of Ag, Au and Cu reported by Dewaele
et al.24, 25 are shown in Table II.
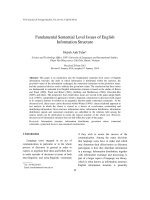
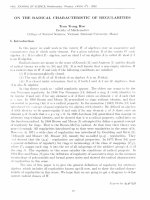
In Fig. 2(a) & Fig. 2(b), we show the melting curve of Ag as a function of pressure up to
460 GPa (corresponding to compression V /V0 = 0.5) and 20 GPa, respectively. The experimental
data of Akella and Kennedy11 (up to 20 GPa), Mirwald et al.12 (up to 6.5 GPa) and Errandonea13
(up to 8 GPa) are also displayed for comparison. The present results agree well with those of
experimental data up to 12 GPa. At higher pressure, our calculations are quite greater than those
reported by Akella and Kennedy.11 According to Akella and Kennedy, the initial melting slopes
of Ag is 60.4 K/GPa, while the result of Mirwald et al.12 and Errandonea13 are 64.7 K/GPa and
47 K/GPa, correspondingly. Initial slope of melting in our calculations is 56.55 K/GPa.
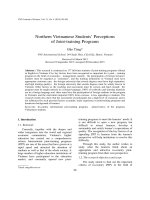
In Fig. 3(a) & Fig. 3(b), we displayed the high-pressure melting curves Tm of Au up to pressure
770 GPa and 20 GPa, respectively. The previous experimental results11–13 are also displayed for
comparison. It can be seen from Fig. 3(b), our evaluations are in agreement with the experimental
data reported by Errandonea,13 especially, at pressure below 4 GPa. Present results are just consistent
with those of Mirwald et al.12 and Akella and Kennedy11 up to pressure 2 GPa. Beyond 2 GPa,
our determinations increases slowly comparing to experiments of Mirwald et al. and Akella and
Kennedy. The divergence between theoretical prediction and experiments is about 100 K at 10 GPa
and 200 K at 20 GPa. This remark is supported by making comparison among the slopes of melting
curves. Experimental melting slopes of Errandonea, Mirwald et al. and Akella and Kennedy are
dTm /dP = 47(3) K/GPa, 57 K/GPa and 57.3 K/GPa, subsequently. Slopes of melting in our determinations are 41.86 K/GPa, 38.18 K/GPa and 42.66 K/GPa which correspond to melting calculations
using fitted parameters {γ 0 , q} from high temperature Gr¨uneisen parameter calculated by firstprinciples electronic band-structure calculations and approximations based on the bulk modulus B
and the Debye-Waller factor u2 . There are some reasons which can simply explain this difference:
(1) the limitation of Lindemann’s criterion approach; (2) not really good-fitting parameter sets {γ 0 ,
q}; (3) the lack of consideration of electron-configuration of metal;14 (4) the out-of-date experiment
results.
In the case of Cu metal, the pressure effects on melting curves Tm up to pressure 500 GPa
and 50 GPa are plotted in Fig. 4(a) & Fig. 4(b), respectively. Copper is the metal of which highpressure melting curve has been studied by experiments as well as computational simulations in
many literatures.11, 13–18 As it can be seen in the Fig. 4(a), by using three different fitting parameter
sets {γ 0 , q}, we obtained three disparate results of melting temperature. Initial melting slopes
All article content, except where otherwise noted, is licensed under a Creative Commons Attribution 3.0 Unported license. See: />Downloaded to IP: 137.30.242.61 On: Wed, 10 Dec 2014 08:55:03
112125-6
H. K. Hieu and N. N. Ha
AIP Advances 3, 112125 (2013)
11000
m
Melting temperature T (K)
Ag
9000
7000
J. Akella et al. [11]
PW. Mirwald et al. [12]
D. Errandonea [13]
Present study
5000
3000
1000
0
100
200
300
Pressure P (GPa)
400
460
(a)
2400
Ag
Melting temperature Tm (K)
2200
2000
1800
1600
J. Akella et al. [11]
PW. Mirwald et al. [12]
D. Errandonea [13]
Present study
1400
1200
0
5
10
Pressure P (GPa)
15
20
(b)
FIG. 2. Melting temperature Tm of Ag up to pressure 460 GPa & 20 GPa using Eq. (7) with experimental data of γ 0 and
q = 1. Results of Akella and Kennedy11 (stars), Mirwald et al.12 (open squares) and Errandonea13 (close circles) are also
displayed for comparison.
obtained from our calculations are 30.92 K/GPa, 39.90 K/GPa and 27.45 K/GPa corresponding to
melting temperature Tm , TmB and Tm DW . The experimental melting slope of copper at pressure 1 bar
reported by Errandonea is dTm /dP = 43(2) K/GPa.13 The previous experimental reported melting
slopes of Akella and Kennedy,11 Mirwald et al.12 and Brand et al.15 are 36.4 K/GPa, 41.8 K/GPa and
45(3) K/GPa, respectively. On the theoretical side, quasi ab initio molecular dynamic calculations
performed by Belonoshko et al.16 give the value 36.7 K/GPa, while the result of Voˇcadlo et al.17
by making ab initio calculations with phase coexistence approach is 38 K/GPa. Up to pressure
20 GPa, those three melting temperature results are consistent with reported data (Fig. 3(a)); beyond
20 GPa, there are the decrease in melting slopes of Tm and Tm DW . While the values of Tm and Tm DW
diverge from the previous experimental and theoretical determinations, the TmB is in very good
agreement with those data. At very high pressure (above 100 GPa), there are very few available data
for comparison. In this pressure range, our calculations TmB correspond to quasi ab initio molecular
dynamic results16 (close circles) as well as to those of ab initio calculations with phase coexistence
approach17 (close right triangle). The excellent agreement between TmB results with first-principles
All article content, except where otherwise noted, is licensed under a Creative Commons Attribution 3.0 Unported license. See: />Downloaded to IP: 137.30.242.61 On: Wed, 10 Dec 2014 08:55:03
112125-7
H. K. Hieu and N. N. Ha
AIP Advances 3, 112125 (2013)
14000
Au
12000
Melting temperature Tm (K)
10000
8000
Akella et al. [11]
Mirwald et al. [12]
Errandonea [13]
T
6000
4000
m
TmB
2000
0
0
TmDW
100
200
300
400
500
Pressure P (GPa)
600
700
(a)
2300
2200
Au
2000
m
Melting temperature T (K)
2100
1900
1800
Akella et al. [11]
Mirwald et al. [12]
Errandonea [13]
Tm
1700
1600
1500
T
mB
1400
1300
0
TmDW
5
10
Pressure P (GPa)
15
20
(b)
FIG. 3. Corresponding melting temperature Tm of Au up to pressure 770 GPa & 20 GPa using Eq. (7) with various fitting
parameters {γ 0 , q}.22 Results of Akella and Kennedy11 (stars), Mirwald et al.12 (open squares) and Errandonea13 (open
circles) are also displayed for comparison.
calculations16, 17 authenticates that we can employ TmB to predict the very high-pressure melting of
Cu metal.
In literature [14], Japel et al. have argued the important role of d-shell electrons on melting
of transition metals. In this study, Ag, Au and Cu have the same electron configuration with the
full-filled d electron (4d10 5s1 , 5d10 6s1 and 3d10 4s1 , respectively). It suggests that the melting curves
of these three metals should have the same form. This conclusion can be confirmed by observing
Fig. 1(a), Fig. 1(b) & Fig. 1(c). Moreover, to describe exactly high-pressure melting curves, the
building theory needs to pay attention to electronic properties of metals. However, this Lindemann’s
melting criterion approach can still be used to predict Tm values of Ag, Au and Cu as well as other
metals in high pressure. For example, from Fig. 3(b) it can be seen that, the calculated value Tm of
Au at 13 GPa about 1800 K. This result is in good agreement with the extrapolated determination
from experimental results of Errandonea.13
All article content, except where otherwise noted, is licensed under a Creative Commons Attribution 3.0 Unported license. See: />Downloaded to IP: 137.30.242.61 On: Wed, 10 Dec 2014 08:55:03
112125-8
H. K. Hieu and N. N. Ha
AIP Advances 3, 112125 (2013)
10000
m
Melting temperature T (K)
9000
8000
7000
6000
Akella et at. [11]
Errandonea [13]
Japel et at. [14]
Brand et al. [15]
Belonoshko et al. [16]
Vocadlo et al. [17]
Wu et al. [18]
5000
4000
Tm
3000
TmB
T
2000
1000
0
mDW
100
200
300
Pressure P (GPa)
400
500
(a)
3000
m
Melting temperature T (K)
2800
2600
2400
2200
Akella et at. [11]
Errandonea [13]
Japel et at. [14]
Brand et al. [15]
Belonoshko et al. [16]
Vocadlo et al. [17]
Wu et al. [18]
2000
1800
Tm
1600
T
mB
1400
T
mDW
1200
1000
0
10
20
30
Pressure P (GPa)
40
50
(b)
FIG. 4. Corresponding melting temperature Tm of Cu up to pressure 500 GPa & 50 GPa using Eq. (7) with various fitting
parameters {γ 0 , q}.22 Results of Akella and Kennedy11 (* marks), Errandonea13 (close pentagrams), Japel et al.14 (+ marks),
Brand et al.15 (close hexagrams), Belonoshko et al.16 (close circles), Voˇcadlo et al.17 (close triangles (right)) and Wu et al.18
(dotted line) are also displayed for comparison.
We also want to make another note that, the melting temperature Tm function is not really linear
to pressure P, especially in high pressure region. This comment can be easily observed in Fig. 1:
Melting curves of Ag, Au and Cu metals trend to vary as the nonlinear functions of P when volume
compressions V /V0 ≤ 0.8 (correspond to pressures P ≥ 43 GPa for Ag, P ≥ 70 GPa for Au and
P ≥ 50 GPa for Cu metals.24, 25 )
IV. CONCLUSIONS
In this work, we have introduced a relatively simple approach to investigate high-pressure
melting of Ag, Au and Cu metals thanks to Lindemann’s criterion of melting temperature and
pressure-dependent Gr¨uneisen parameter. Analytical expression of pressure-dependent melting temperature Tm has been proposed. Numerical calculations have been performed up to volume compression V /V0 = 0.5 and up to pressure corresponding to this compression (460 GPa for Ag, 770 GPa for
All article content, except where otherwise noted, is licensed under a Creative Commons Attribution 3.0 Unported license. See: />Downloaded to IP: 137.30.242.61 On: Wed, 10 Dec 2014 08:55:03
112125-9
H. K. Hieu and N. N. Ha
AIP Advances 3, 112125 (2013)
Au and 500 GPa for Cu metals). By comparing calculated results with those of available experiments
and theories we conclude that, Lindemann’s criterion approach is suitable for evaluating the melting
of Ag and Au up to about 12 GPa and 6 GPa, respectively. For Cu metal, melting TmB calculated
using fitting parameters {γ 0B , qB } from Gr¨uneisen parameter in bulk modulus B approximations is
a good candidate for predicting melting temperature at very high pressure P. This approach can also
be applied to study pressure effects on melting temperatures of other metals such as Ni, Fe,... At
higher pressure, Lindemann’s criterion can just help us on qualitative investigation of high-pressure
melting. It also can be used to verify future multi-anvil and DAC experiments as well as theoretical
determinations. We suppose that it should consider about electron configuration of metals on study
their pressure-dependent melting temperatures.
ACKNOWLEDGMENTS
The authors gratefully acknowledge anonymous referees for useful comments and suggestions.
This research is funded by Vietnam National Foundation for Science and Technology Development
(NAFOSTED) under grant number 103.02-2012.06.
1 D.
Errandonea, Phys. Rev. B 87, 054108 (2013).
Santamar´ıa-P´erez, M. Ross, D. Errandonea, G. D. Mukherjee, M. Mezouar, and R. Boehler, J. Chem. Phys. 28, 124509
(2009).
3 J. H. Nguyen and N. C. Holmes, Nature (London) 427, 339 (2004).
4 M. Pozzo and D. Alf`
e, Phys. Rev. B 88, 024111 (2013).
5 A. B. Belonoshko, L. Burakovsky, S. P. Chen, B. Johansson, A. S. Mikhaylushkin, D. L. Preston, S. I. Simak, and D. C.
Swift, Phys. Rev. Lett. 100, 135701 (2008).
6 G. Fiquet, A. L. Auzende, J. Siebert, A. Corgne, H. Bureau, H. Ozawa, and G. Garbarino, Science 329, 1516 (2010).
7 D. K. Spaulding, R. S. McWilliams, R. Jeanloz, J. H. Eggert, P. M. Celliers, D. G. Hicks, G. W. Collins, and R. F. Smith,
Phys. Rev. Lett. 108, 065701 (2012).
8 S. Anzellini, A. Dewaele, M. Mezouar, P. Loubeyre, and G. Morard, Science 340, 464 (2013).
9 Y. Fei, Science 340, 442 (2013).
10 Y. Ping, F. Coppari, D. G. Hicks, B. Yaakobi, D. E. Fratanduono, S. Hamel, J. H. Eggert, J. R. Rygg, R. F. Smith, D. C.
Swift, D. G. Braun, T. R. Boehly, and G. W. Collins, Phys. Rev. Lett. 111, 065501 (2013).
11 J. Akella and G. C. Kennedy, J. Geophys. Res. 76, 4969, doi:10.1029/JB076i020p04969 (1971).
12 P. Mirwald and G. C. Kennedy, J. Geophys. Res. 84, 6750, doi:10.1029/JB084iB12p06750 (1979).
13 D. Errandonea, J. Appl. Phys. 108, 033517 (2010).
14 S. Japel, B. Schwager, R. Boehler, and M. Ross, Phys. Rev. Lett. 95, 167801 (2005).
15 H. Brand, D. P. Dobson, L. Vocadlo, and I. G. Wood, High Press. Res. 26, 185 (2006).
16 A. B. Belonoshko, R. Ahuja, O. Eriksson, and B. Johansson, Phys. Rev. B 61, 3838 (2000).
17 L. Voˇ
cadlo, D. Alf`e, G. D. Price, and M. J. Gillan, J. Chem. Phys. 120, 2872 (2004).
18 Y. N. Wu, L. Wang, Y. Huang, and D. Wang, Chem. Phys. Lett. 515, 217 (2011).
19 W. J. Nellis, J. A. Moriarty, A. C. Mitchell, M. Ross, R. G. Dandrea, N. W. Ashcroft, N. C. Holmes, and G. R. Gathers,
Phys. Rev. Lett. 60, 1414 (1988).
20 A. C. Mitchell, W. J. Nellis, J. A. Moriarty, R. A. Heinle, N. C. Holmes, R. E. Tipton, and G. W. Repp, J. Appl. Phys. 69,
2981 (1991).
21 F. Lindemann, Physik. Z 11, 609 (1910).
22 M. J. Graf, C. W. Greeff, and J. C. Boettger, AIP Confer. Proc. 706, 65 (2004).
23 P. Vinet, J. Ferrante, J. Rose, and J. Smith, J. Geophys. Res. 92, 9319, doi:10.1029/JB092iB09p09319 (1987).
24 A. Dewaele, M. Torrent, P. Loubeyre, and M. Mezouar, Phys. Rev. B 78, 104102 (2008).
25 A. Dewaele, P. Loubeyre, and M. Mezouar, Phys. Rev. B 70, 094112 (2004).
26 E. Gr¨
uneisen, Ann. Phys. (Leipzig) 39, 257 (1912).
27 S. Arafinn, R. N. Singh, and A. K. George, Physica B 419, 40 (2013).
28 D. Errandonea, Physica B 357, 356 (2005).
29 L. Burakowsky, D. L. Preston, and R. R. Silbar, J. Appl. Phys. 88, 6294 (2000).
30 D. Huang, X. Liu, L. Su, C. Shao, R. Jia, and S. Hong, J. Phys. D: Appl. Phys. 40, 5327 (2007).
31 Y. Wang, R. Ahuja, B. Johansson, Phys. Rev. B 65, 014104 (2001).
32 L. A. Girifalco, Statistical Mechanics of Solids (Oxford University Press, USA, 2000).
2 D.
All article content, except where otherwise noted, is licensed under a Creative Commons Attribution 3.0 Unported license. See: />Downloaded to IP: 137.30.242.61 On: Wed, 10 Dec 2014 08:55:03