Performance of soft frequency reuse in random cellular networks in Rayleigh Lognormal fading channels
Bạn đang xem bản rút gọn của tài liệu. Xem và tải ngay bản đầy đủ của tài liệu tại đây (222.82 KB, 7 trang )
The 22nd Asia-Pacific Conference on Communications (APCC2016)
Performance of Soft Frequency Reuse in random
cellular networks in Rayleigh-Lognormal Fading
Channels
Sinh Cong Lam, Kumbesan Sandrasegaran
Tuan Nguyen Quoc
University of Technology, Sdyney
Center of Real Time Information Network
Faculty of Engineering and Information Technology
Email: ;
University of Engineering and Technology
Vietnam National University, Hanoi
Faculty of Electronics and Telecommunication
Email:
Abstract—Soft Frequency Reuse (Soft FR) is an effective
resource allocation technique that can improve the instantaneous received Signal-to-Interference-plus-Noise ratio (SINR) at
a typical user and the spectrum efficiency. In this paper, the
performance of Soft FR in Random Cellular network, where
the locations of Base Stations (BSs) are random variables of
Spatial Point Poisson Process (PPP), is investigated. While most
of current works considered the network model with either single
RB or frequency reuse with factor of 1, this work assume that the
Soft FR with factor of ∆ is deployed and there are M users and N
(∆ > 1, M > 1, N > 1). The analytical and simulation results
show that a network system with high frequency reuse factor
create more InterCell Interference than that with low frequency
reuse factor. Furthermore, in order to design the parameters to
optimize Soft FR, the performance of the Cell-Edge and CellCenter user should be considered together.
Keywords: Rayleigh-Lognormal, Poisson Point Process network, frequency reuse, Round Robin Scheduling.
I. I NTRODUCTION
In Orthogonal Frequency Division Multiple Access
(OFDMA) multi-cell networks, the main factor, that directly
impacts on the system performance, is intercell interference
which is caused by the use of the same frequency band
in adjacent cells. Soft FR algorithm [1] is considered as
an effective resource allocation technique that improve the
performance of users, especially for user experiencing poor
serving signal. In this algorithm, the allocated Resource Blocks
(RBs) and users are divided into non-overlapping groups, call
Cell-Edge and Cell-Center RB group, Cell-Edge and CellCenter user group.
The performance of Soft FR algorithm has been studied
for hexagonal network models such as in [2], [3]. Recently,
the Point Poisson Process (PPP) network model has been
deployed to analyse network performance using frequency
reuse algorithm. In most of works, the authors studied Soft
RF with reuse factor of 1 [4], [5], that lead to the fact that all
BSs transmit at the same power level. Hence, the concepts of
Cell-Center, Cell-Edge users and the transmit power levels on
Cell-Edge and Cell-Center RBs have not been discussed.
978-1-5090-0676-2/16/$31.00 ©2016 IEEE
In [6], [7], the performance of Fractional Frequency Reuse
algorithms with reuse factor ∆ > 1 were evaluated. In these
papers, the effective InterCell Interference was introduced to
represent the total InterCell Interference in the network. In
fact, in Soft FR network system with factor ∆ > 1, the
InterCell Interference at a typical user is caused by BSs in
two separated groups in which the first group contains the BSs
transmitting on Cell-Center RBs and the second group contains
the BSs transmitting on the Cell-Edge RBs. Generally, these
groups can be distinguished by the differences in the transmit
power levels and the densities of BSs. When the location of
BSs and the channel power gain are random variables, the
powers of interference at the typical user caused by the BSs
in each interfering groups are random variables. Hence, the
total interference should be the sum of two separated groups
of random variables. Consequently, the concept of effective
InterCell Interference may be not suitable in this case. The
unreasonableness of effective InterCell Interference will be
explained with more details in Section II-B.
Furthermore, in the work discussed above, it was assumed
that all BSs always cause InterCell Interference to a typical
user. This assumption is reasonable when all RBs are used at
all adjacent cells, i.e. the number of users is equal or greater
than that of allocated RBs.
In this paper, the performance of Soft FR (∆ > 1)
network system with Round Robin scheduling is evaluated.
The given outcomes of this paper significantly differ from
the published results since in this work, instead of using the
effective InterCell Interference concept, the interfering BSs are
separated into two groups which are distinguished by different
transmit power levels and different densities of BSs. In order
to analyse the effects of the number of RBs and users when
Round Robin scheduling is deployed, the indicator function
representing the probability where the BS creates InterCell
Interference to a typical user defined.
The average capacities of a typical Cell-Center and CellEdge user are presented in this paper. The opposite trend
between the average capacity of these users emphasises that
481
The 22nd Asia-Pacific Conference on Communications (APCC2016)
the optimization problem of Soft FR should consider the
performance of Cell-Edge and Cell-Center together.
Hence, the CDF of Rayleigh-Lognormal RV FR−Ln (g) is
obtained by the integral of PDF from 0 to g:
g
II. S YSTEM MODEL
FR−Ln (g) =
A statistical single-tier cellular network model which the
locations of BSs are distributed as the Spatial Poisson Process
with density λ is considered. The transmit power of a typical
BS is denoted by P . The signals from BSs to the typical
user experience propagation path loss with exponent α, and
Rayleigh-Lognormal fading with mean µz dB and σz dB.
Denote r is a random variable which represent the distance
from the typical user and the BS. The received signal at the
user from the BS is P gr−α in which g is average power of
fading channel. In real network, the typical user try to connect
to the strongest BS which provide the highest P gr−α . Since,
in single-tier network, it is assumed that all BSs transmit at
the same power level, the average power gain as well as path
loss exponent are assumed to be constants. Hence in this case,
the strongest BS of the typical user is its nearest BS.
The PDF of the distance r between a typical user and its
serving BS is defined by following equation [5].
fR (r) = 2πλr exp −πλr2
A.
(1)
Rayleigh-Lognormal fading channel model
The realistic fading channel is the coherence of fast fading
which is caused by scattering from local obstacles such as
buildings and slow fading which is caused by the variance
of transmission environment. In this work, the fast fading is
modelled as Rayleigh fading and the slow fading is modelled
as Lognormal fading. The PDF of the Rayleigh-Lognormal
channel power gain g is given by.
∞
f R−Ln (g) =
0
2
2
1
1 −g/x
√ e−(10 log10 x−µz ) /2/σz dx
e
x
xσz 2π
(2)
in which µz and σz are mean and variance of RayleighLognormal random variable.
x−µz
√10
Employing the substitution, t = 10 log
, then
2σ
0
Np
f (x)dx = 1 −
Since g is the channel power gain, g is a positive real
number (g > 0). The MGF of g can be found as:
∞
MR−Ln (s) =
∞
−∞
g
1 1
√
exp −
γ(t)
π γ(t)
=
ω
1
√n
1
+
sγ(a
π
n)
n=1
(5)
The average of the power gain of Rayleigh-Lognormal
1 2
channel is g R−Ln = 10(µz + 2 σz )/10 . In this paper, it is
assumed that the power gain of the channel is normalised,
i.e. g R−Ln = 1.
B.
Frequency Reuse Algorithm
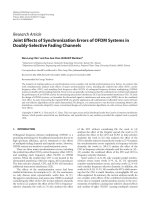
It is assumed that all cells are allocated the same N RBs
to serve M users. Soft FR with frequency reuse factor ∆ is
deployed in as shown in Figure 1. As shown in Figure 1, both
users and RBs are classified into two types including MC cellcenter users and ME cell-edge users, NC cell-center RBs and
NE cell-edge RBs. Since, the cell-edge users are served with
higher transmit power level, denote φ as the ratio between the
serving transmit power of cell-edge and cell-center users.
The optimisation factors ǫ(e) and ǫ(c) is defined as the ratios
between number of users and the number of RBs at Cell-Edge
and Cell-Center areas as Equation 6:
For Cell-Edge area:
Me
= ǫ(e)
Ne
(6a)
Mc
= ǫ(c)
Nc
(6b)
For Cell-Center area:
exp(−t2 )dt (3)
Power
The integral in Equation 3 has the suitable form for GaussHermite expansion approximation [8]. Thus, the PDF can be
approximated by:
Np
fR−Ln (g) =
fR−Ln (x)e−xs dx
0
Np
z
fR−Ln (g) =
ω
g
√n exp −
γ(a
π
n)
n=1
ω
1
g
√n
exp −
γ(a
)
γ(a
π
n
n)
n=1
Cell 1
1
3
Cell 2
(4)
2
Cell 3
in which
•
•
wn and an are the weights and the abscissas of the
Gauss-Hermite polynomial. To achieve high accurate
approximation,
√ N p = 12 is used.
γ(an ) = 10( 2σz an +µz )/10 .
978-1-5090-0676-2/16/$31.00 ©2016 IEEE
482
Frequency
Fig. 1.
An example of Soft FR with ∆ = 3
The 22nd Asia-Pacific Conference on Communications (APCC2016)
It is assumed that the typical user is served on RB b. When
FR factor ∆ is used, the densities of BSs that transmit on RB
b at Cell-Center and Cell-Edge power levels, are λC = ∆−1
∆ λ
1
and λE = ∆
λ, respectively [3], [9].
The intercell interference on the typical user u is given by
τ (zc = b)P gzc rz−α
c
Iu =
zc ∈θC
τ (ze = b)φP gze rz−α
e
+
(7)
in which SIN R(r) is the instantaneous SINR of the user u
at a distance r from its serving BS and can be obtained by:
P gr−α
(11)
Iu + σ 2
in which Iu is defined in Equation 7; g is the channel power
gain from the user u to its serving BS; σ 2 is Gaussian noise.
Since, the expected values of a positive variable x is defined
SIN R(r) =
as E[x] =
∞
in which θC and θE are the set of BSs transmitting with
a cell-center and cell-edge power level ; gz and rz are the
channel power gain and distance between the user and a BS
in cell z where z = zc corresponds to cell-center area, z = ze
corresponds to cell-edge area; the indicator function τ (z = b)
is defined as below
1
0
RB b is used in z area
otherwise
xfX (x)dx,
0
ze ∈θE
τ (z = b) =
∞
(8)
the indicator function which represent the event which that
take value 1 if the RB b is occupied in area z of a particular
cell
When the Round Robin scheduling is assumed to be deployed, the expected values of τ (zc = b) and τ (ze = b) are
given by:
MC
E[τ (zc = b)] =
= ǫ(e)
(9a)
NC
ME
= ǫ(c)
(9b)
NE
If the number of users in a given area such as Cell-Edge
area is greater than the number of RBs, all RBs at this area
are used at the same time . Hence, there is a BS in this case
causes InterCell interference to the typical user, i.e. ǫ(e) .
The main difference between this work and the published
work in [6], [7] is that in in [6], [7] it was assumed that
the adjacent BSs always create interference on the typical
user, i.e. τ (zc = b) = τ (ze = b) = 1. This assumption is
valid for the PPP network in which the instantaneous number
of users is greater than the number of RBs. Furthermore,
in previous work, it is assumed that gzc rz−α
= gze rz−α
,
c
e
then the effective InterCell Interference is defined as Ief f =
−α
in which θ is the set of neighboring
z∈θ (λC + φλE ) gz rz
and gze rz−α
BSs. This assumption is not reasonable as gzc rz−α
c
e
are random variables with the same distribution but the distribution of the total interference Iu given by equation 4 is
different. Hence, the concept of effective InterCell Interference
is not feasible in this case.
Pc (T ) =
0
∞
= 2πλ
0
Pc (T ) = P(SIN R(r) > T )
978-1-5090-0676-2/16/$31.00 ©2016 IEEE
rP(T |r) exp −πλr2 dr
(12)
where fR (r) is defined in Equation 1; P(T |r) = P(SIN R >
T |r) is the coverage probability of a user at the distance r
from its serving BS.
Lemma 3.1: The coverage probability of the typical user at
the distance r from its serving BS is given by
Np
P(T |r) =
T rα
1
ω
√n exp −
γ(an ) SN R
π
n=1
exp −πr2 ǫ(c) λC fI (T, n, 1) + ǫ(e) λE fI (T, n, φ)
(13)
where
E[τ (ze = b)] =
III. U SER COVERAGE PROBABILITY
The coverage probability Pc of the typical user u for the
given threshold T is defined as the probability of event in
which the instantaneous received SINR of the user is greater
than the defined threshold.
P(T |r)fR (r)dr
Np
fI (T, n, φ) =
n1
2
ω n1 2
√ f (T, n, φ) α
π α
sin
=1
NGL
−
nGL
cnGL
2
=1
γ(a
π
π(α−2)
α
f (T, n, φ)
f (T, n, φ) +
xnGL +1
2
√
)
α/2
and f (T, n, φ) = φT γ(ann1) ; γ(an ) = 10( 2σz an +µz )/10 ; ωn
and an , c and x are are weights and nodes of Gauss-Hermite,
Gauss-Legendre rule, respectively with order NGL .
Proof: See Appendix A
It is observed from Lemma 3.1 that the coverage probability of
a typical user is inversely proportional to exponential function
of 1/SN R and r for cellular network with σ 2 > 0.
Here is the coverage probability of a typical user that is
served on cell-center RB. If it is served on a cell-edge RB,
the coverage probability is also given by Equation 13, but in
this case the SN R should be replaced by φSN R.
Proposition 3.2: The average coverage probability of the
typical user in the PPP network is
(10)
483
NGL
4πλ
Pc (T ) =
nGL =1
e
−πλ
cnGL (xnGL + 1)
(1 − xnGL )3
xn
+1
GL
1−xn
GL
2
P T |r =
xnGL + 1
1 − xnGL
(14)
The 22nd Asia-Pacific Conference on Communications (APCC2016)
Proof Employing the changes in variable r =
Equation 12 equals
1
Pc (T ) = 4φλ
0
t
1−t ,
V. S IMULATION AND D ISCUSSION
the
2
t
t
P(T |r =
)e−πλ(t/(1−t)) dt
3
(1 − t)
1−t
Using Gauss-Legendre quadrature, the Proposition 3.2 is
proved.
Proposition 3.3: In special case of interference-limited network, the average coverage probability is expressed as the
following equation
Np
1
ω
√n
(c) ∆−1 f (T, n, 1) + ǫ(e) 1 f (T, n, φ)
π
1
+
ǫ
I
∆
∆ I
n=1
(15)
where fI (T, n, φ) is given in Lemma 3.1.
Proof When σ 2 = 0, the desired result can be obtained by
evaluating the integrand in Equation 12.
When the FR factor ∆ = 1 is deployed or the transmit
power ratio equals 1, i.e. φ = 1, this expression is comparable
to the corresponding results in [5].
Pc (T ) =
In this section, numerical method and Monte Carlo simulations are used to validate the theoretical analysis and to
visualize the impact of the parameters such as number of RBs
and users, the transmission SNR, and FR factor ∆ on the
network performance.
In simulation, it was assumed that the network model covers
service area with a radius of R(km) and s area of πR2 (km2 ).
Hence, the number of BSs is πλR2 in which πλ(∆−1
R2 BSs
∆
2
are transmitting at a lower power level, i.e. P , and πλ
∆R
BSs are transmitting at a higher power level, i.e. φP . It is
interesting to note that when R is large enough, for example
in this work R > 30km, the simulation results are consistent
with the changes of R.
It was assumed that the network is allocated 30 RBs of
which 10 RBs are allocated to the cell-edge area and 20 RBs
are allocated to the cell-center area. From Equation 6, the
number of cell-center and cell-edge users are 10ǫ and 20ǫ,
respectively. The analytical and simulation parameters that are
used are summarised in the Table I.
TABLE I
A NALYTICAL AND SIMULATION PARAMETERS
IV. AVERAGE USER RATE
Parameter
Density of BSs
Power ratio
Number of RBs
- Number of cell-center RBs
- Number of cell-edge RBs
Path loss exponent
The average rate of a typical randomly user is defined as
R = ER [ln(SIN R(r) + 1)]
∞
= 2πλ
0
rR(r) exp −πλr2 dr
(16)
where SIN R is the received SINR at the user u given in
Equation 11; R(r) is the average rate of the typical user at the
distance r from its serving BS (see Appendix B)
∞
R(r) =
0
Pc (T = et − 1|r)dt
where Pc (T |r) is given in Lemma 3.1 Hence, the average is
obtained by
∞
R = 2πλ
0
∞
=
0
rP(T = et − 1|r) exp(−πλr2 )dr
Pc (T = et − 1)dt
(17)
In the special case of the interference-limited network and
reuse factor ∆ = 1, then the average rate can be simply given
by:
Np
ω
√n
R=
π
n=1
∞
0
1
dt
1 + fI (T, n, 1)
(18)
To generate the simulation results shown in subsequent
figures, 104 network scenarios are generated in which the
number of BSs and their locations follow a Poisson distribution
with a density λ. In each scenario, the received instantaneous
SINR at the user is calculated and compared with the coverage
threshold. If the SINR is greater than the coverage threshold,
the user will be selected to be under coverage of the network
and the coverage event will be counted. Finally, the coverage
probability is calculated as a ratio of the number of occurrences of coverage events and number of scenarios.
In the simulation result figures given below, the solid lines
represent the results of theoretical analysis which match quite
well with the dotted lines that represent the simulation results.
These results confirm the accuracy of theoretical analysis.
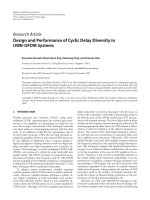
Figure 2 indicates that the strong effect of the SINR
threshold which represents the sensitivity of user devices on
the coverage probability. It is observed from this figure that if
the sensitivity of user equipment increased by around a factor
of 2.5 , (for example 0dB to -4dB), the coverage probability
increased by 40% when SNR at the transmitter is SN R = 0
dB or 10 dB.
A. Frequency Reuse factor
in which fI (t, n, 1) is given in Lemma 3.1. This is not the
closed-form expression of average rate, but it can be evaluated
by simple numerical techniques or approximation quadratures.
978-1-5090-0676-2/16/$31.00 ©2016 IEEE
Value
λ = 0.25
φ = 10
N = 30
Nc = 20
Ne = 10
α = 3.5
In the worst case scenario, the typical user is affected by
all neighbouring BSs. However, in the case of ∆ = 1, all
interfering BSs transmit at a low power level, i.e. a cell-center
484
The 22nd Asia-Pacific Conference on Communications (APCC2016)
0.8
16
Theory SNR=-10 dB
Theory SNR=0 dB
Theory SNR=10 dB
Simulation SNR=-10 dB
Simulation SNR=0 dB
Simulation SNR=10 dB
0.7
12
0.5
Average Capacity (bit/Hz/s)
Average Coverage Probability
0.6
Cell-Edge user
14
0.4
0.3
0.2
ǫ=0.3
ǫ=0.6
10
ǫ=0.3
8
6
ǫ=0.6
0.1
ǫ=0.9
4
Cell-Center user
0
-10
-5
0
5
10
15
20
Threshold (dB)
2
1
2
3
4
5
6
7
8
9
10
Transmission ratio φ
Fig. 2. Coverage probability with different values of SNR and the threshold
T
power level while in the case of ∆ > 1, some of them transmit
at a high power level, i.e. cell-edge power level. Hence, the
network system with a FR factor ∆ = 1 provides a better
coverage probability compared to that with FR factor ∆ > 1
as shown in Figure 3. This is consistent with the fact that the
Soft FR with ∆ > 1 can create more intercell interference on
both a cell-edge and cell-center user when compared to Strict
FR or Soft FR with ∆ = 1.
Average capacity with different values of the power ratio φ
ǫ = 0.6. When ǫ = 0.3 and the transmit power rato increase by
5 times from 1 to 5, the capacity of Cell-Center user increase
significantly by 31.04% to 12.66 (bit/Hz/s) while the capacity
of Cell-Center user reduces by 13% to 7.666 (bit/Hz/s). Hence,
in order to design the transmit power ratio for a network, there
should be a balance between the performance of the Cell-Edge
and Cell-Center user.
C. Power of Lognormal fading and path loss exponent
0.55
Theory ∆=1
Theory ∆=2
Theory ∆=3
Simulation ∆=1
Simulation ∆=2
Simulation ∆=3
0.5
0.45
It is noticed from Figure 3 that the coverage probability
significantly reduces when the ratio between number of users
and RBs increases. For example, when this ratio doubles from
0.2 to 0.4, the coverage probability dropped by 20% in the
case ∆ = 3 and around 28% in the case ∆ = 1.
0.4
0.35
1.6
0.3
Theory α=3.5
Theory α=3.8
Simulation α=3.5
Simulation α=3.8
1.5
0.25
Average Capacity (nat/Hz/s)
Average Coverage Probability
Fig. 4.
0.2
0.1
0.2
0.3
0.4
0.5
0.6
0.7
0.8
0.9
1
optimisation factor ε
Fig. 3. Average coverage probability with different values of frequency reuse
factor ∆
1.4
1.3
1.2
1.1
1
B. Transmission ratio
0
2
3
4
5
6
7
8
σz (dB)
In Figure 4, the relationship between the average capacity of
the typical user and the ratio between transmit power on a CellEdge and Cell-Center RB is presented. It is observed from the
figure that there is the opposite trend between the capacity of
the Cell-Center and Cell-Edge user. When the transmit power
ratio φ = 1 that means all users is served with the same
power, the capacities of the Cell-Center and Cell-Edge user
are the same and equal 8.73 (bit/Hz/s) if ǫ = 0.3 and 7.651 if
978-1-5090-0676-2/16/$31.00 ©2016 IEEE
1
Fig. 5. Capacity with different values of path loss exponent α and RayleighLognormal variance σz
With higher α, total power of interfering signals sees a
faster decrease rate over distance than desired signal since
the user receives only one useful beam from its serving BS
and usually suffers more than one interfering beams. The
485
The 22nd Asia-Pacific Conference on Communications (APCC2016)
coverage probability is, hence, inversely proportional to path
loss exponential coefficient as shown in Figure 5.
The integral can be evaluated by using the properties of
Gamma function and Gauss-Legendre rule as in [10], then
VI. C ONCLUSION
EC = exp −πλC r2 ǫ(c) fI (T, n, 1)
In this paper, the impact of FR factor ∆ and the number
of users as well as RBs on the network performance in
Rayleigh-Lognormal fading channel are presented. The results
achieved are comparable with the corresponding results in
published works that are only for a reuse factor ∆ = 1 and
under Rayleigh fading. The analytical result indicates that the
coverage is proportional to the FR factor ∆ when ∆ > 1
and inversely proportional to the ratio of the users to RBs.
Furthermore, when ∆ > 1, Soft FR created more intercell
interference to the users than that with ∆ = 1.
in which
The coverage probability in Equation 10 is evaluated by
following steps:
Pc (T |r)
fI (T, n, 1) =
n1
2
ω n1 2
√ f (T, n, 1) α
π α
sin
=1
NGL
−
nGL
T rα
1
ω
√n exp −
γ(a
)
SN
R
π
n
n=1
E exp −
E [ln(1 + SIN R(r))] =
T r α Iu
P γ(an )
in which SN R = σP2 .
Considering the expectation and substituting Equation 7, we
obtain
T rα
Iu
E exp −
P γ(an )
=
0
∞
=
0
in which f (T, n, φ) = φT
product EC , we have
zc ∈θC
γ(an1 )
γ(an ) .
rze−α
r−α
rz e
r
−α
Since gz is Rayleigh-Lognormal fading channel then
Np
ω
1
n
√1
=E
ǫ(c)
−α
π 1 + f (T, n, 1) rze
n =1
ze ∈θC
r
1
Using the properties of PPP generating function. Hence, the
expectation equals:
= exp −2πλ(c) ǫ(c)
∞
r
1−
1
1 + f (T, n, 1)
978-1-5090-0676-2/16/$31.00 ©2016 IEEE
Pc (T = et − 1|r)dt
R EFERENCES
Evaluating the fist group
ǫ(c) Egz exp −f (T, n, 1)gz
P SIN R(r) > et − 1 dt
The Lemma is proved.
rze−α
1(zc = b) exp −f (T, n, 1)gzc −α
r
1(ze = b) exp −f (T, n, φ)gze
P [ln(1 + SIN R(r)) > t] dt
0
∞
=EC x EE
EC = E
(22)
∞
(19)
ze ∈θE
α/2
The average rate of the typical user in this case is
Np
E
C+
xnGL +1
2
(21)
VIII. A PPENDIX B
ω
T rα (Iu + σ 2 )
√n E exp −
=
P γ(an )
π
n=1
zc ∈θC
f (T, n, 1)
Substituting Equation 20 and 22 into Equation 19, the Theorem is proved.
Np
=E
cnGL
2
=1
π
π(α−2)
α
EE = exp −πλE r2 ǫ(e) fI (T, n, φ)
= P(SIN R > T )
=
Np
Similarly, EE is achieved by
VII. A PPENDIX A
(20)
rze −α
r
dr
486
[1] Soft Frequency Reuse Scheme for UTRAN LTE, 3GPP Project Document
Std. R1-050 507, Huawei,2005.
[2] L. Chen and D. Yuan, “Generalized frequency reuse schemes for ofdma
networks: Optimization and comparison,” in Vehicular Technology Conference (VTC 2010-Spring), 2010 IEEE 71st, May 2010, pp. 1–5.
[3] S. C. Lam, R. Subramanian, K. Sandrasegaran, P. Ghosal, and S. Barua,
“Performance of well-known frequency reuse algorithms in lte downlink
3gpp lte systems,” in Signal Processing and Communication Systems
(ICSPCS), 2015 9th International Conference on, Dec 2015, pp. 1–5.
[4] W. Bao and B. Liang, “Structured spectrum allocation and user association in heterogeneous cellular networks,” in INFOCOM, 2014
Proceedings IEEE, April 2014, pp. 1069–1077.
[5] J. G. Andrews, F. Baccelli, and R. K. Ganti, “A new tractable model
for cellular coverage,” in Communication, Control, and Computing
(Allerton), 2010 48th Annual Allerton Conference on, Conference Proceedings, pp. 1204–1211.
[6] A. G. J. G. A. Thomas David Novlan, Radha Krishna Ganti, “Analytical
evaluation of fractional frequency reuse for ofdma cellular networks,”
IEEE TRANSACTIONS ON WIRELESS COMMUNICATIONS, vol. 10,
pp. 4294–4305, 2011.
[7] H. S. Dhillon, R. K. Ganti, F. Baccelli, and J. G. Andrews, “Modeling
and analysis of k-tier downlink heterogeneous cellular networks,”
Selected Areas in Communications, IEEE Journal on, vol. 30, no. 3, pp.
550–560, 2012. [Online]. Available: />6171989/06171996.pdf?tp=&arnumber=6171996&isnumber=6171989
[8] M. A. Stegun and I. A., Handbook of Mathematical Functions with Formulas, Graphs, and Mathematical Tables, 9th ed. Dover Publications,
1972.
The 22nd Asia-Pacific Conference on Communications (APCC2016)
[9] S. C. Lam and K. Sandrasegaran, “Analytical coverage probability
of a typical user in heterogeneous cellular networks,” Journal
of Networks, vol. 11, no. 2, 2016. [Online]. Available: http:
//ojs.academypublisher.com/index.php/jnw/article/view/jnw11025661
[10] S. C. Lam, R. Heidary, and K. Sandrasegaran, “A closed-form expression
for coverage probability of random cellular network in composite
rayleigh-lognormal fading channels,” in Telecommunication Networks
and Applications Conference (ITNAC), 2015 International, Nov 2015,
pp. 161–165.
978-1-5090-0676-2/16/$31.00 ©2016 IEEE
487