DSpace at VNU: Contemporary genetic structure of an endemic freshwater turtle reflects Miocene orogenesis of New Guinea
Bạn đang xem bản rút gọn của tài liệu. Xem và tải ngay bản đầy đủ của tài liệu tại đây (632.87 KB, 17 trang )
bs_bs_banner
Biological Journal of the Linnean Society, 2014, 111, 192–208. With 3 figures
Contemporary genetic structure of an endemic
freshwater turtle reflects Miocene orogenesis of
New Guinea
ARTHUR GEORGES1*, XIUWEN ZHANG1, PETER UNMACK1, BRENDEN N. REID2,
MINH LE3,4,5 and WILLIAM P. McCORD6
1
Institute for Applied Ecology, University of Canberra, Canberra, ACT 2601, Australia
Department of Forest and Wildlife Ecology, University of Wisconsin, 1630 Linden Drive, Madison,
WI 53706, USA
3
Faculty of Environmental Sciences, Hanoi University of Science, 334 Nguyen Trai Road, Hanoi,
Vietnam
4
Centre for Natural Resources and Environmental Studies, 19 Le Thanh Tong Street, Hanoi, Vietnam
5
Department of Herpetology, American Museum of Natural History, New York, NY 10024, USA
6
East Fishkill Animal Hospital, 455, Route 82, Hopewell Junction, NY 12533, USA
2
Received 20 July 2013; revised 25 August 2013; accepted for publication 26 August 2013
The island of New Guinea lies in one of the most tectonically active regions in the world and has long provided
outstanding opportunity for studies of biogeography. Several chelid turtles, of clear Gondwanal origin, occur in New
Guinea; all species except one, the endemic Elseya novaeguineae, are restricted to the lowlands south of the Central
Ranges. Elseya novaeguineae is found throughout New Guinea. We use mitochondrial and nuclear gene variation
among populations of E. novaeguineae throughout its range to test hypotheses of recent extensive dispersal versus
more ancient persistence in New Guinea. Its genetic structure bears the signature of Miocene vicariance events.
The date of the divergence between a Birds Head (Kepala Burung) clade and clades north and south of the Central
Ranges is estimated to be 19.8 Mya [95% highest posterior density (HPD) interval of 13.3–26.8 Mya] and the date
between the northern and southern clades is estimated to be slightly more recent at 17.4 Mya (95% HPD interval
of 11.0–24.5 Mya). The distribution of this endemic species is best explained by persistent occupation (or early
invasion and dispersal) and subsequent isolation initiated by the dramatic landform changes that were part of the
Miocene history of the island of New Guinea, rather than as a response to the contemporary landscape of an
exceptionally effective disperser. The driving influence on genetic structure appears to have been isolation arising
from a combination of: (1) the early uplift of the Central Ranges and establishment of a north-south drainage
divide; (2) development of the Langguru Fold Belt; (3) the opening of Cenderawasih Bay; and (4) the deep waters
of the Aru Trough and Cenderawasih Bay that come close to the current coastline to maintain isolation of the Birds
Head through periods of sea level minima (−135 m). The dates of divergence of turtle populations north and south
of the ranges predate the telescopic uplift of the central ranges associated with oblique subduction of the Australian
Plate beneath the Pacific Plate. Their isolation was probably associated with earlier uplift and drainage isolation
driven by the accretion of island terranes to the northern boundary of the Australian craton that occurred earlier
than the oblique subduction. The opening of Cenderawasih Bay is too recent (6 Mya) to have initiated the isolation
of the Birds Head populations from those of the remainder of New Guinea, although its deep waters will have
served to sustain the isolation through successive sea level changes. The molecular evidence suggests that the
Birds Head docked with New Guinea some time before the Central Ranges emerged as a barrier to turtle dispersal.
Overall, deep genetic structure of the species complex reflects events and processes that occurred during Miocene,
whereas structure within each clade across the New Guinea landscape relates to Pliocene and Pleistocene
times. © 2013 The Linnean Society of London, Biological Journal of the Linnean Society, 2014, 111, 192–208.
ADDITIONAL KEYWORDS: Birds Head – Chelidae – Elseya novaeguineae – Indonesia – Langguru Fold Belt
– molecular clock – Papua – tectonics – Vogelkop.
*Corresponding author. E-mail:
192
© 2013 The Linnean Society of London, Biological Journal of the Linnean Society, 2014, 111, 192–208
PHYLOGEOGRAPHY OF AN ENDEMIC TURTLE
INTRODUCTION
Phylogeography strives to understand contemporary
distribution patterns of species by integrating information on biological relationships among populations
with information on historical connectivity (Avise
et al., 1987). Depending on the timescale, past connectivity is influenced by such processes as plate
tectonics (Sanmartíin & Ronquist, 2004), sea level
change (Schultz et al., 2008), landscape surface processes (e.g. river capture: Hurwood & Hughes, 1998;
Burridge, Craw & Waters, 2006), habitat change (e.g.
aridification: Douady et al., 2003; Maguire & Stigall,
2008), and ecological interactions (Kennedy et al.,
2002). The island of New Guinea lies in one of the
most tectonically active regions in the world and has
long provided outstanding opportunity to study the
impact of these processes on biogeography (Wallace,
1860; Mayr, 1944; Polhemus & Polhemus, 1998;
Heads, 2002; Rawlings & Donnellan, 2003; Wüster
et al., 2005; Deiner et al., 2011; Nyári & Joseph,
2013). Originating from the collision of the
northward-moving Indo-Australian plate and the
westward-moving Pacific plate, the current topographic configuration of New Guinea is a relatively
young (approximately 10 Mya). It consists of a
complex composite of accreted oceanic and continental
terranes in the north, a relatively stable Australian
continental block underlying the lowlands in the
south, and a central range that has undergone dramatic uplift and deformation arising from collision
rates of up to 100 mm year−1 (Pigram & Davies, 1987;
van Ufford & Cloos, 2005; Stanaway, 2008). New
Guinea lies at the critical junction between the Asian
and Australasian bioregions, and so has played an
important role both in the invasion of Australia by
faunal elements of Asian origin (e.g. the murine
rodents: Rowe et al., 2008) and as a refuge for Australasian diversity (Hope & Aplin, 2007), decimated
elsewhere by progressive aridification of the Australian continent during the Tertiary (Magee et al., 2004;
Cohen et al., 2011). The exchange of fauna between
New Guinea and Australia has been complicated by
their recurrent interconnection and separation as sea
levels have varied in response to Pleistocene glacial
cycles (Lambeck & Chappell, 2001; Reeves et al.,
2008; Cook et al., 2012). Freshwater turtles provide
exemplary examples of the interplay between dispersal, vicariance, time, and morphological or genetic
divergence.
New Guinea, and particularly the tropical southern
lowlands, supports the highest species richness of
freshwater turtle species in Australasia. Species of
Asian origin include two softshell turtles in the genus
Pelochelys (Trionychidae), commonly found in estuarine areas, and considered to be capable of extensive
193
marine dispersal (Rhodin, Mittermeier & Hall, 1993).
Pelochelys bibroni occurs south of the Central Ranges,
and Pelochelys signifera occurs to the north (Georges
& Thomson, 2010). Both are closely related to
Pelochelys cantori of south-east Asia. Neither has
reached Australia. Carettochelys insculpta, now
restricted to southern New Guinea and northern
Australia (Georges & Thomson, 2010), belongs to a
family (Carettochelyidae) that was widespread in the
Tertiary, its distribution covering much of Laurasia by
the Eocene (Meylan, 1988). A fossil C. insculpta from
marine beds at the mouth of Mariana Creek, Vailala
River, Papua New Guinea (PNG), has been dated
as upper Miocene (Glaessner, 1942). Carettochelys
insculpta is considered to be of south-east Asian
origin (Cogger & Heatwole, 1981).
All remaining species of turtle in Australia and
New Guinea belong to the family Chelidae. These
are of clear Gondwanan origin because they are not
found outside their current range of South America
and Australasia even in the fossil record. Their fossil
record in Australia dates back to the mid Cretaceous, approximately 100–110 Mya (Smith, 2010). In
Australasia, chelid turtles achieve their highest
species richness in the Fly drainage of PNG (Georges,
Guarino & Bito, 2006). The species Chelodina parkeri,
Chelodina rugosa, Chelodina pritchardi, Chelodina
novaeguineae, Elseya branderhorsti, and Emydura
subglobosa each have clear relationships to sister
taxa in Australia (Georges & Adams, 1992, 1996).
The endemic short-necked chelid turtle Elseya
novaeguineae (Meyer, 1874) is unusual in that its
phylogenetic relationship with other Australasian
taxa is unclear (Boulenger, 1889; Goode, 1967;
McDowell, 1983; Georges & Thomson, 2010), confounded by the combination of absence of an alveolar
ridge on the triturating surfaces of the mouth (prominent in Elseya), an expanded parietal bridge leading
to extension of the head shield as lateral processes
extending almost to the tympanum (characteristic of
Myuchelys), and the usual presence of a cervical scute
(usually so in Emydura but not Elseya or Myuchelys)
(Georges & Thomson, 2010). Molecular data have
E. novaeguineae as sister to E. branderhorsti (Le
et al., 2013), sister to a clade consisting of Elseya
dentata, Elseya sp. aff. dentata [Magela] (Georges &
Adams, 1996) and E. branderhorsti (Todd et al., 2013),
or as a lineage falling between the Queensland Elseya
(Elseya albagula and relatives) and the northern
Elseya (E. dentata and relatives) (Georges & Adams,
1992).
Dispersal of most chelid turtles between Australia
and New Guinea probably occurred relatively
recently, in the late Pliocene, Pleistocene and Holocene, because these species are restricted to the
lowlands south of the Central Ranges. Elseya
© 2013 The Linnean Society of London, Biological Journal of the Linnean Society, 2014, 111, 192–208
194
A. GEORGES ET AL.
novaeguineae departs from this otherwise ubiquitous
distributional pattern in being abundant and widespread throughout New Guinea, in the tributaries
and flooded forests of the lowlands of southern and
northern New Guinea, and the Birds Head (Kepala
Burung) of West Papua (Georges & Thomson, 2010).
In the present study, we explore three potential
hypotheses to explain this unusual distribution. The
first and only published hypothesis (Rhodin et al.,
1993) is that E. novaeguineae dispersed to New
Guinea from Australia after the Central Ranges were
established but, by chance or exceptional dispersal
capability, made its way to the north of the island and
across to the Birds Head. This hypothesis suggests a
relatively recent dispersal throughout New Guinea,
and would have the southern form sister to a clade
comprising the populations of Birds Head and north
of the Central Ranges. A second explanation, herein
referred to as the ‘docking hypothesis’, is that
E. novaeguineae came to occupy and speciated on an
island terrane of continental origin that now forms
part of the Birds Head, presumably after it broke
away from the Australian craton in the Cretaceous
but before its current connection to the island of New
Guinea proper (Polhemus, 2007). After Birds Head
docked with greater New Guinea, E. novaeguineae
could have dispersed to the north and south of the
emerging Central Ranges. This hypothesis would
have the Birds Head populations as sister to a clade
comprising the southern and northern forms. A third
‘in situ hypothesis’ is that E. novaeguineae is a longstanding and persistent resident of the area that now
forms New Guinea before becoming fragmented by
vicariance associated with the development the
Langguru Fold Belt, the opening of Cenderawasih
Bay, and uplift of the Central Ranges. We address
these hypotheses using a fossil calibrated analysis of
mitochondrial and nuclear DNA from Australian
short-necked chelid turtles combined with a broad
geographical sampling of E. novaeguineae with multiple mitochondrial genes, and relate this structure to
current interpretations of the geological history of
New Guinea. We also explore phylogeographical patterns within each of the major clades emerging from
our analysis, relative to topography and opportunity
to disperse along exposed continental shelf during low
sea levels.
MATERIAL AND METHODS
Specimens of E. novaeguineae were collected from
throughout their range in Indonesian New Guinea
(Fig. 1) by Indonesian nationals under contract to
Bill McCord in support of other studies. The
region referred to in the present study as the Birds
Head (literally translated in Indonesian as Kepala
Burung) refers to the entire crustal block west of
Cenderawasih Bay, including Vogelkop Peninsula
(also known as Doberai Peninsula), Bomberai Peninsula, Binuturi Basin, as well as associated islands
of Salawati, Waigeo, and Misool (Fig. 1). Specimens of
E. novaeguineae and E. branderhorsti (outgroup
taxon) from the Bensbach, Morehead, Fly, and Kikori
rivers of PNG were collected as part of general
surveys (Georges et al., 2006, 2008). A sample of skin
was taken from the trailing edge of the vestigial toe
on the hind foot of each specimen and immediately
preserved in 90% ethanol. Samples were transported
to the University of Canberra or the American
Museum of Natural History where they were stored
at −20 °C until analyzed. Total genomic DNA was
extracted by salt extraction (sensu Miller, Dykes &
Polesky, 1988; FitzSimmons, Moritz & Moore, 1995),
or using Chelex (Bio-Rad) beads, or by using a commercially available DNeasy Tissue Kit (Qiagen Inc.)
in accordance with the manufacturer’s instructions
for animal tissues. The success of genomic extraction
was confirmed by gel electrophoresis and quantification using a Nanodrop ND-1000 spectrophotometer
(Fisher Thermo).
For each specimen, we amplified 1038 bp of
mitochondrial (mt)DNA sequence, comprising 257 bp
of control region (primers EmyThr 5′-CACCACCC
TCCTGAAATACTC-3′; H. B. Shaffer, pers. commun.;
TCR500, Engstrom, Shaffer & McCord, 2002), 533 bp
of the NADH dehydrogenase subunit 4 (ND4), a
further 70 bp of ND4 coding region, together with
71 bp of tRNA His, 59 bp of tRNA Ser, and the first
47 bp of tRNA Leu [primers ND4: Arévalo, Davis &
Sites (1994); ND4Int: Fielder et al. (2012); Leu+G
5′-GCATTACTTTTACTTGGATTTGCA CCA-3′ sensu
Arévalo et al. (1994)]. For each DNA fragment, two
products from two independent reactions were
sequenced in both directions to ensure sequence fidelity. This is referred to as the reduced gene set. Following preliminary analysis to identify major clades,
a further 269 bp of 12S [primers L1091 (pos 491) and
H1478 (pos 947): Kocher et al. (1989)], 370 bp of 16S
[primers M89(L) and M90(H): Georges et al. (1998)],
393 bp of CO1 [primers M72(L) and M73(H): Georges
et al. (1998)], 846 bp of cytochrome b (cyt b) [primers
GLUDGE: Palumbi et al. (1991); mt-E-Rev2: Barth
et al. (2004)] and a larger fragment of the ND4 gene
[866 bp, primers ND4/ND4_672(f): Engstrom et al.
(2002); Leu: Arévalo et al. (1994)] were sequenced for
three representative specimens from each major clade
and two specimens of E. branderhorsti. This is
referred to as the full gene set (total 2744 bp).
Polymerase chain reaction (PCR) products (50 μL of
each sample) were either precipitated with 50 μL of
20% polyethylene glycol, washed with 80% ethanol
and re-suspended in 13 μL of water or cleaned on a
© 2013 The Linnean Society of London, Biological Journal of the Linnean Society, 2014, 111, 192–208
PHYLOGEOGRAPHY OF AN ENDEMIC TURTLE
195
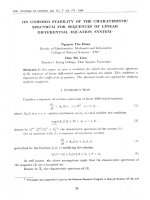
Figure 1. Sampling locations and distribution of major clades for Elseya novaeguineae (●) and Elseya branderhorsti
(■, green) on New Guinea and associated islands. The region comprising Vogelkop and Bomerai peninsulas is collectively
referred to as the Birds Head, the narrow area containing the Langguru Fold Belt as the Birds Neck, and the remainder
of the island as greater New Guinea. Distribution of haplotypes from the Birds Head clade is shown in red, the northern
clade in blue and the southern clade in yellow. Additional details on locations referred to in the text are provided in the
text (Specimens Examined) using the site numbers as a cross-reference. The light shaded oceanic region shows the extent
of exposure of the Arafura Shelf and coastal New Guinea at the sea level minima (approximately −135 m).
Biomek automated apparatus using the Ampure
system (Beckman-Coulter Inc.). The purified PCR
products were either packaged and sent to Macrogen
Inc. (World Meridian Venture Centre 10F) for
sequencing or cycle sequenced in-house at the
American Museum of Natural History’s Sackler
Institute for Comparative Genomics using BigDye
reagents (Perkin Elmer), after which cycle sequencing
products were ethanol-precipitated and run on an
ABI3770 automated sequencer (Applied Biosystems)
[GenBank Accession numbers: JN188812–188926,
sequence alignment deposited in Dryad (Georges
et al., 2013)]. Sequences were edited and aligned
using GENEIOUS PRO, version 5.3.3 (http://www
.geneious.com) and with final alignment by eye.
Maximum parsimony (MP) and maximum likelihood (ML) analyses were performed using PAUP*
4.0b10 (Swofford, 2002). Gaps were excluded from all
analyses. MP analyses were undertaken using default
parameter values. Support for clades was calculated
using 10 000 bootstrap replicates obtained by heuristic search, each of which was based on 100 random
addition sequence replicates. We consider bootstrap
values in excess of 70% to be indicative of support for
the associated node, and bootstrap values in excess of
90% to be strong support. ML analyses were performed as heuristic searches (as-is stepwise addition
followed by tree bisection–reconnection branch swapping) under the best fit model of molecular evolution
(TrN+G+I; sensu Tamura & Nei, 1993) and the substitution estimates and gamma parameter estimated
by MODELTEST, version 3.06 (Posada & Crandall,
1998). Support for clades was calculated using 1000
bootstrap replicates. Mean rates of nucleotide substitution calculated from the reduced gene dataset
(uncorrected and corrected TrN+I+G distances)
were compared between major clades within
E. novaeguineae (E. branderhorsti as outgroup) using
relative rate tests (Takezaki, Rzhetsky & Nei, 2004)
as implemented in PHYLTEST (Kumar, 1996). Elseya
© 2013 The Linnean Society of London, Biological Journal of the Linnean Society, 2014, 111, 192–208
196
A. GEORGES ET AL.
branderhorsti was used as the outgroup based on the
analysis of Le et al. (2013).
To provide broader context for dating the divergences between E. novaeguineae lineages, we calibrated a molecular clock with known fossils and
incorporating broader taxonomic sampling than just
E. novaeguineae and E. branderhorsti. We used
mitochondrial sequences for ND4, cyt b, several
tRNAs and the nuclear R35 intron from Le et al.
(2013) for the Australian short-necked chelid radiation (hereafter taken to consist of the genera Elseya,
Elusor, Emydura, Myuchelys, and Rheodytes, but not
Pseudemydura). The Le et al. (2013) dataset was
reduced to single representatives per species (to
comply with the assumption of the Yule model of
complete taxon sampling, with each operational taxonomic unit representing a different taxon; Ho et al.,
2008). Myuchelys purvisi (Flaviemys purvisi of Le
et al., 2013) was excluded from the analysis because
there is substantial conflict between mitochondrial
DNA and nuclear DNA topologies for that species.
The sequences for E. dentata referred to by Le et al.
(2013) were identified as Elseya irwini and the misidentification was corrected. Sequence data for Elusor
macrurus, Myuchelys latisternum, and Elseya dentata
used by Le et al. (2013) were missing certain genes, in
which case we replaced their entire sequences with
data from unpublished whole mitochondrial genome
sequences and added additional data for the nuclear
R35 locus [sequence alignment was deposited in
Dryad (Georges et al., 2013)]. Sequences were aligned
with the online version of MAFFT, version 7.046
(Katoh & Standley, 2013) using the very slow G-INS-i
algorithm with the scoring matrix for nucleotide
sequences set to 1PAM/K = 2, a gap opening penalty
of 1.53, and an offset value of 0.5.
BEAST 2.0.2 (Bouckaert et al., 2013) was used to
estimate molecular divergence times of lineages based
on fossil age estimates. Input files were generated
using BEAUti 2.0.2 (Bouckaert et al., 2013). The
analysis used an uncorrelated lognormal relaxed
molecular clock with rate variation following a tree
prior using the calibrated Yule model. We separated
the data into two partitions: one for the mitochondrial
data and one for the nuclear data. For the model of
nucleotide substitution, we used the RB BEAST addon, which automatically adjusts the analysis to choose
the best model of nucleotide substitution for each
partition. The topology was fixed based on a previous
BEAST run, which included a sequence of Chelodina
rugosa (GenBank: NC_015986.1 and AY339641.1) as
an outgroup along with our fossil calibrations. This
provided a suitable tree with branch lengths consistent with our priors. We fixed this topology in our
analysis and allowed BEAST to estimate branch
lengths only.
Turtles are commonly found in the Australian fossil
record, although the osteology of extant forms has been
poorly studied (Thomson & Georges, 2009; Smith,
2010). Hence, diagnostic characters are often unavailable and placing fossils into a phylogeny of living
species is difficult. Fossils from only two time horizons
(Thomson & Mackness, 1999; Mackness, Whitehead &
McNamara, 2000; de Broin & Molnar, 2001) have
sufficient information that they can be used as calibrated constraints in a molecular clock analysis. Fossil
remains from the Redbank Plains Formation were
identified as representing two species from the Australian short-necked chelid radiation (the Emydura
group of de Broin & Molnar, 2001) but could not be
assigned to genus because of a lack of diagnostic
features (de Broin & Molnar, 2001). These were placed
at the basal node of the Australian short-necked chelid
radiation. The age of the Redbank Plains Formation is
Eocene, with an estimated age of 55.0–58.5 Mya
(Langford et al., 1995), and the Redbank Plains fossils
are consistent with other similarly aged fossils likely to
be part of the Australian short-necked radiation from
the Pilbara (Boongerooda Greensand, Paleocene) and
Proserpine (possibly Eocene) (de Broin & Molnar,
2001). We used this calibration in our analysis with a
lognormal distribution and an offset of 52 Mya to set
the minimum age (allowing for some error in the
geological age estimation of the formation), a mean of
4.75 and an SD of 0.5. Turtle fossils from Bluff Downs
in the Allingham Formation are closely related to
Elseya irwini (Thomson & Mackness, 1999). The age of
the Allingham Formation is between 3.6–5.2 Mya
based on dating of lava flows (Mackness et al., 2000).
The turtle fossils were found in the lower sections of
the formation, suggesting that they were deposited
earlier in the history of the formation. For this
calibration in our analysis we used a lognormal distribution with an offset of 3.6 Mya to set the minimum
age, with a mean of 1 and an SD of 0.5 on the
node between the sister species E. irwini and
E. lavarackorum. Three separate analyses were conducted using both calibration points in the same
analysis, plus one analysis with each calibration used
individually to evaluate their influence on estimated
dates. Analyses were also conducted excluding
sequence data to check that posterior distributions
were not heavily driven solely by our priors rather
than the sequence data.
BEAST analyses were run for 50 million generations, with parameters logged every 10 000 generations. Multiple runs were conducted to check for
stationarity and to ensure that independent runs were
converging on a similar result. The log and tree files
from four runs were combined in LOGCOMBINER,
version 2.0.2 (Bouckaert et al., 2013), with a 10%
burn-in. Individual and combined log files were
© 2013 The Linnean Society of London, Biological Journal of the Linnean Society, 2014, 111, 192–208
PHYLOGEOGRAPHY OF AN ENDEMIC TURTLE
examined in TRACER, version 1.5 (Rambaut &
Drummond, 2007), whereas the combined tree file was
summarized using TREEANNOTATOR, version 1.7.5
(Bouckaert et al., 2013) (version 2.0.2 was providing
false values) with the mean values placed on the
maximum clade credibility tree.
SPECIMENS
EXAMINED
(FIG. 1)
Data are the species, drainage (drainage number of
Fig. 1), latitude and longitude, and specimen
number(s) (Wildlife Tissue Collection, University of
Canberra, UC<Aus> in GenBank).
Papua New Guinea: Elseya novaeguineae, Kikori
River [7] (7.3056S 144.1684E) AA036613/15/17,
(7.2326S 144.0110E) AA036607, (7.0975S 143.9929E)
AA036609, (7.1367S 144.3653E) AA036130/33;
Morehead River [2] (8.4450S 141.7940E) AA042861/
62; Elseya branderhorsti, Fly River [3] (8.294S,
141.91E) AA042986; Merauke River [35] (7.5104S
140.8609E) AA042067; Morehead River [4] (8.93S,
141.561E) AA042628; Bensbach River [5] (8.618S,
141.135E) AA42682. West Papua, Indonesia: Aer
Besar River [12] (2.9316S 132.3340E) AA042047/97;
Aika River [29] (4.7801S 136.8457E) AA042026/63;
Bian River [34] (7.3289S 140.6641E) AA042256/80;
Bira River [11] (2.1246S 132.1657E) AA042044/049/
148; Kaimana Peninsula [18] (3.6606S 133.7613E)
AA042122; Klamaloe River(?) [9] (0.8711S 131.2535E)
AA042037/69; Kuri River [16, 17] (2.9806S 134.0313E)
AA042132/50 (2.5323S 133.9655E) AA042077/88;
Lorenz River [31] (4.0949S 138.9471E) AA042247;
Mamberamo River [21] (2.1448S 137.8375E)
AA042039/125; Memika River [30] (4.6184S
136.4716E) AA042133/58; Merauke River [35]
(7.5104S 140.8609E) AA042035/111; Misool Island [6]
(1.8304S 129.8235E) AA042081/94; Mumi River [14]
(1.6144S 134.0654E) AA042131/147/186/194/255;
Muturi River [15] (2.0682S 133.7212E) AA042027/038/
050/143/213/217; Pauwasi River [24] (3.5522S
140.5706E) AA042195/234; Ransiki River [13]
(1.5065S 134.1669E) AA042058; Salawati Island [7]
(1.0132S 131.0774E) AA042141; Sanoringga River [20]
(2.5019S 136.5568E) AA042029/34; Sepik River [25]
(4.2967S 140.9572E) AA042123/91; Tami River [22, 23]
(2.9105S
140.7678E)
AA042024/210,
(2.6939S
140.9798E) AA042053/151/172/236/283, (2.6777S
140.9835E)
AA042041,
(2.6330S
141.1410E)
AA042028/32; Tunguwatu River, Aru Island [27]
(5.7689S 134.4163E) AA042030/046/114/204/257;
Urumbuwe River [32] (5.1683S 138.6343E) AA042100/
142/154/229; Uta River [28] (4.5351S 135.9938E)
AA042033/40; Waigeo Island [8] (0.3335S 131.1698E)
AA042083; Wanggar River [19] (3.4636S 135.3174E)
AA042055/59; Waromge River [10] (1.5031S
132.1681E) AA042157/84; Yalingi River [26] (3.2056S
197
142.1935E) AA042057. Voucher numbers are for the
Wildlife Tissue Collection at the University of
Canberra ( />.cgi); photo vouchers are available on request.
RESULTS
For the reduced gene set, we identified 34 haplotypes
from the 82 specimens of E. novaeguineae for which
we had sequence data for control region, ND4, and
associated tRNAs. Of the 1038 bp of combined
sequence, 848 positions were invariant, and 22 were
parsimony uninformative, leaving 168 parsimony
informative characters (increasing to 190 when
outgroup E. branderhorsti is included). Indels
accounted for 11 positions that were excluded from
the phylogenetic analysis of sequence data. Some
were, however, parsimony informative. A single
nucleotide indel in control region united the
haplotypes from the Kikori drainage of the Gulf Province of PNG. A single nucleotide indel in the control
region, a second indel of 3 bp in control region, and a
single nucleotide indel in tRNASer were concordant as
a synapomorphy uniting the northern populations
of Mamberamo [21], Sepik [25], Tami [22,23],
Sanoringga [20], and Wanggar [19] (Fig. 1).
The MP analysis of the reduced gene set yielded 57
equally shortest trees (378 character state changes)
and the strict consensus tree is shown in Figure 2.
There are three distinct and well supported clades:
one comprising haplotypes from the Birds Head and
associated islands (hereafter the Birds Head Clade),
one comprising haplotypes from north of the Central
Ranges (hereafter the Northern Clade), and one comprising haplotypes from south of the Central Ranges,
including the island of Aru (hereafter the Southern
Clade) (Fig. 1). All three clades received 100% bootstrap support. Within these clades, there was strong
support for all structure within the Birds Head Clade,
and for a distinct Kikori clade within the Southern
Clade (Fig. 1). Differences between the 57 trees arose
from rearrangements of closely-related haplotypes
within the Northern and Southern Clades. The topology of the ML tree (single tree, –log likelihood
3405.62) did not differ in any important respects from
that of the MP tree (Fig. 2).
Addition of further sequence data from 12 s, 16 s,
CO1, and cyt b for the full gene set (total of 2572
characters, 2210 of which were constant and 57 parsimony uninformative and 305 informative characters) did not alter the topology and marginally
increased bootstrap support for the node uniting the
Northern and Southern Clade to the exclusion of the
Birds Head Clade (Fig. 2). It rose to 86% for the MP
analysis and 83% in the ML analysis compared to the
respective values of 79% and 78% for the full and
© 2013 The Linnean Society of London, Biological Journal of the Linnean Society, 2014, 111, 192–208
198
A. GEORGES ET AL.
10 bp
Bira [11] Moetoeri [15]
100/100
95/86
100/100
Klamaloe [9] Waromge [10] Bira [11]
Waigeo Is. [8]
Misool Is. [6]
97/80
100/96
74/76
82/83
100/100
Birds Head
Clade
Kiamana [18]
Salawati Is. [7] Aer Besar [12]
Koeri [16,17] Moemi [14]
Ransiki [13] Moemi [14]
Moetoeri [15] Koeri [16,17]
Moetoeri [15]
Tami [22]
Tami [23] Sepik [25]
73/-Tami [22, 23]
Northern
Clade
Tami [22]
Sepik [25]
Pauwasi [24]
Pauwasi [24]
100/100
Sanoringga [20]
Wanggar [19]
79/86
Mamberamo [21]
Kikori [1]
100/100
Kikori [1]
Kikori [1]
100/100
Morehead [2]
94/78
Urumbuwe [32]
Urumbuwe [32]
Uta [28]
Southern
Clade
Aika [29] Memika [30]
92/88
Merauke [35] Bian [34]
Merauke [35]
Lorenz [31]
Urumbuwe [32]
Lorenz [31]
80/78
93/96
100/100
Aru Is. [27]
Aru Is. [27]
Fly [3]
Elseya
branderhorsti
Morehead [4]
Bensbach [5]
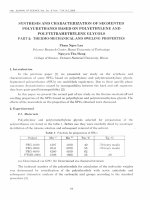
Figure 2. Maximum parsimony (MP) phylogeny for the mitochondrial haplotypes of the New Guinea turtle Elseya
novaeguineae from the full gene set. Terminal names are those of drainage basins; the reference numbers refer to locations
shown in Fig. 1 in square brackets. Colours for the three major clades are Birds Head in red, northern clade in blue and
southern clade in yellow with the outgroup (Elseya branderhorsti) in green. Bootstrap values (> 70%) for the major clades
are drawn from analysis of the full gene set, with the MP values followed by the maximum likellihood (ML) values.
Bootstrap values for minor clades are drawn from analysis of the reduced gene set. The topology of the ML tree did not
differ in any substantial way from the MP tree.
reduced gene sets respectively. Thus, the best supported topology has the Birds Head Clade as basal to
the Northern and Southern Clades with significant,
although there is less than 100% bootstrap support.
There were no informative indels in the additional
sequences of the full gene set.
Rates of sequence divergence for cyt b and ND4
(Table 1) did not differ between the three
E. novaeguineae clades measured against the
outgroup taxon E. branderhorsti (Birds Head versus
Southern: Z = 0.10, P = 0.92; Birds Head versus
Northern: Z = 0.97, P = 0.32; Northern versus Southern: Z = 1.18, P = 0.24, PHYLOTEST, version 2;
Kumar, 1996), suggesting that the rate of sequence
evolution is constant across these clades.
Dates of divergence using the two calibration constraints singly and in combination in BEAST for
E. novaeguineae are presented in Table 2 and
Figure 3 (see also Supporting information, Fig. S1).
Table 1. Mean among and within clade p-distances for
Elseya novaeguineae from the Birds Head (BH), north and
south of the New Guinea Central Ranges for coding ND4
and Cytb mitochondrial DNA genes (from the full gene set)
Elbran
Vogel
North
South
Elbran
BH
North
South
1.2%
7.7%
7.0%
7.8%
1.2%
6.7%
7.3%
0.5%
6.2%
0.3%
Elseya branderhorsti (Elbran) is from the Transfly of
Papua New Guinea. Lower matrix, percentage divergence
based on uncorrected p-distances; diagonal, mean withinclade p-distances.
© 2013 The Linnean Society of London, Biological Journal of the Linnean Society, 2014, 111, 192–208
PHYLOGEOGRAPHY OF AN ENDEMIC TURTLE
199
Table 2. Results of BEAST dating analyses using different combinations of calibrations: calibration based on fossils from
both the Redbank Plains and the Bluff Downs formations, on the Redbank Plains formation only, and on the Bluff Downs
formation only
Comparison
BH versus Rest
(Mya)
Nth versus
Sth (Mya)
mtDNA
(%/Mya)
nDNA
(%/Mya)
Both
Redbank Plains
Bluff Downs
18.8 (12.5–25.6)
19.8 (13.3–26.8)
9.3 (3.6–15.8)
16.5 (10.2–23.1)
17.4 (11.0–24.5)
8.2 (3.0–14.1)
0.40
0.38
0.86
0.34
0.32
0.74
The mean and 95% highest posterior densities are given for the specific nodes of interest: Birds Head (BH) Clade versus
Northern and Southern Clades (BH versus Rest) and Northern versus Southern Clades (Nth versus Sth). The mean
percentage (pairwise) per million year rate of evolution estimated for the mitochondrial (mt)DNA and nuclear (n)DNA are
also given from each BEAST analysis
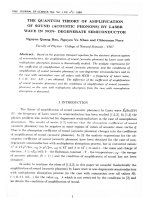
Figure 3. Bayesian molecular clock estimates for the Australian short-necked chelid radiation based on analysis of
mitochondrial and nuclear DNA. The numbers by the nodes represent the mean ages in millions of years; horizontal bars
represent the 95% highest posterior density ranges. The hash symbol (#) indicates the node where the fossil calibration
was placed. The colour by the operational taxonomic unit (OTU) name matches the distribution of the clades in Fig. 1 and
the identification of clades in Fig. 2.
Running the identical analysis (but without data)
confirmed that our input settings reproduced the
prior probability distributions on our calibrated nodes
and that our data were responsible for our results
rather than our priors. Most statistics from all three
analyses had equivalent sample size scores > 3000,
demonstrating the chains were well sampled. When
the single calibration for the Bluff Downs fossils was
used, all dates were much younger than for the
Redbank Plains analysis and for the combined analysis (Table 2; see also Supporting information, Fig. S1).
The results from the combined calibrations were
similar to the results from Redbank Plains analysis
alone (typically within 10%), except that the node
defined by the Bluff Downs calibration had a mean
age estimate of 4.9 Mya [95% highest posterior
density (HPD) interval of 3.9–6.2 Mya] versus 7.9
Mya (95% HPD interval of 3.9–12.8 Mya) (Fig. 3).
Using the single Bluff Downs calibration doubled the
rates of evolution for both genes in comparison with
the rate estimates involving the Redbank Plains fossil
(Table 2). Mean rates of evolution were moderately
low (which is consistent with turtles having an
overall slower rate of evolution than many vertebrates (Shaffer et al., 2013), with the Bluff Downs
calibrated analysis rates being slightly more than
twice the rate for those from Redbank Plains or the
combination analyses (Table 2).
© 2013 The Linnean Society of London, Biological Journal of the Linnean Society, 2014, 111, 192–208
200
A. GEORGES ET AL.
DISCUSSION
Mitochondrial and nuclear sequences of the populations of E. novaeguineae from north of the Central
Ranges, south of the Central Ranges, and on the
Birds Head are highly divergent, which suggests a
history of isolation that extends deep in time. Dating
these divergences using molecular data is challenging, particularly calibration of the molecular clock
that is needed to convert the relative rates of DNA
change to a temporal scale (Muller & Reisz, 2005;
Joyce et al., 2013). Furthermore, the chelid fossil
record is difficult to interpret because knowledge of
osteology of extant forms is poor, and assigning fossils
even to genus is problematic (Gaffney, 1979; de Broin
& Molnar, 2001). We could identify only two fossilbearing formations with sufficient certainty of identity to provide calibration constraints useful in
dating. Using the Redbank Plains fossils alone
yielded mean estimates for dates of divergence of the
Birds Head Clade from the Northern and Southern
Clades of 19.8 Mya (95% HPD interval of 13.3–26.8
Mya) and the divergence of the clades north and
south of the Central Ranges at 17.4 Mya (95% HPD
interval of 11.0–24.5 Mya; Fig. 3). Using the Bluff
Downs fossils alone yielded somewhat younger mean
estimates of 9.3 Mya (95% HPD interval of 3.6–15.8
Mya) and 8.2 Mya (95% HPD interval of 3.0–14.1
Mya), respectively, with limited overlap between their
95% HPD intervals (see Supporting information,
Fig. S1).
It is clear that our Redbank Plains and Bluff Downs
calibrations are in conflict because all age estimates
differ by almost half when the latter calibration is
used (see Supporting information, Fig. S1). When the
two calibrations are used in the same analysis, the
only node with different estimates to the analysis
with Redbank Plains alone is the one calibrated by
Bluff Downs (mean 7.9 Mya, 95% HPD interval of
3.9–12.8 Mya versus mean 4.5 Mya, 95% HPD interval of 3.8–5.3 Mya; see Supporting information,
Fig. S1). We argue the Redbank Plains fossil calibration is more reliable than the Bluff Downs calibration.
Placing fossils within a molecular phylogeny is
greatly influenced by the nearest sister lineage to the
lineage to which the fossil belongs. The Bluff Downs
fossils were described as Elseya nadibajagu, which is
the sister species to E. irwini (Thomson & Mackness,
1999). Because we are limited to extant species in our
molecular phylogeny, we had to place the fossil calibration for E. nadibajagu fossils at the node for
E. irwini and E. lavarackorum. We argue that this
calibration is underestimating divergence times and
that the Bluff Downs fossils most likely represent
separation from E. irwini that is more recent than the
separation of E. irwini and E. lavarackorum. For
these reasons, we have greater confidence in the
placement of our Redbank Plains fossils (Fig. 3) than
those from Bluff Downs (see Supporting information,
Fig. S1).
The Redbank Plains formation calibration is not
without its difficulties. All fossil calibrations have
uncertainty associated with them (Donoghue &
Benton, 2007) arising from inaccuracy in the molecular phylogeny, in the geological dates of the formation
in which the fossils are found, in identification of the
fossils, which are commonly fragmentary, in their
placement within the phylogeny, and arising from
operational decisions to accommodate the time lag
between lineage divergence and evolution of diagnostic synapomorphies in fossils for both sister lineages.
Fossils do not provide a calibration event at a particular time of lineage divergence because they are
more likely to reside on branches of the phylogeny
than on nodes. Fossils yield instead a minimum age
constraint, by placing the fossil on the appropriate
node within the topology (Donoghue & Benton, 2007).
Placing the fossils within our phylogeny was a principal limitation because the Redbank Plains fossils
could only be assigned broadly to the Australian
short-necked chelid radiation. Thus, the calibration
constraint was placed deeper in the phylogeny than
might have been the case had more definitive information been available on morphology to allow the
fossils to be resolved to specific genera. However, if
the two fossil taxa from Redbank Plains had been
assigned to extant genera, the result would be to
increase the age estimates for E. novaeguineae divergences. From this perspective, our estimates and the
credible ranges associated with them are minimum
age estimates. It is also possible that the Redbank
Plains fossils (and other likely related fossils of
similar age from the Pilbara and Proserpine; de Broin
& Molnar, 2001) represent multiple genera that
diverged earlier than the Australian short-necked
chelid radiation we have defined, although those
genera subsequently went extinct. If this were the
case, our estimates would be too old. However, no
Tertiary Australian chelid fossil turtles have been
assigned to extinct genera (Thomson & Mackness,
1999; de Broin & Molnar, 2001).
Irrespective of which calibration is considered accurate, it is clear that E. novaeguineae has an old
history in New Guinea. The Central Ranges of New
Guinea formed as a result of the collision of the
Australian craton with oceanic terranes, a process
that began in the Late Oligocene with the docking of
the Sepik Terrane, approximately 25 Mya (Pigram &
Davies, 1987). The ranges continued to form with
increasing vigour through the late Miocene, Pliocene,
and Pleistocene with the docking of the East Papua
composite terranes (14 Mya, latest middle Miocene),
© 2013 The Linnean Society of London, Biological Journal of the Linnean Society, 2014, 111, 192–208
PHYLOGEOGRAPHY OF AN ENDEMIC TURTLE
the docking of the West Papua composite terrane, and
the northern island-arc terranes of central New
Guinea (10 Mya, early late Miocene) (Pigram &
Davies, 1987; Pigram & Symonds, 1991). However, it
is generally accepted that the telescopic uplift of the
central fold belt to form the Central Ranges began in
the late Miocene, 8–11 Mya, with the commencement
of oblique subduction of the Australian Plate beneath
the Pacific Plate. At some point in the above process,
estimated by our dating to be early Miocene (mean
age 19.8 Mya, 95% HPD interval of 13.3–26.8 Mya;
Fig. 3), the Central Ranges became a barrier to dispersal of E. novaeguineae that has not been subsequently breached. Our dates suggest that this
isolation occurred during the early phases of uplift,
driven by the accretion of island terranes to the north,
rather than the subsequent telescopic uplift associated with the oblique subduction that came later
(Pigram & Davies, 1987; Pigram & Symonds, 1991).
Isolation from the perspective of the turtles would
have occurred early in the uplift process, when
lowland river tributaries no longer interdigitated and
their drainages became isolated by uplands that were
modest relative to the relief of the current Central
Ranges.
The unusual distribution of E. novaeguineae in
relation to the Central Ranges is thus best explained
as the species having a former distribution in the
Miocene that extended into the continental region
now supporting the island of New Guinea. There, its
populations were isolated by the early stages of the
formation of the Central Ranges to yield two distinct
and highly divergent clades. Other species of chelid
turtle appear to have invaded New Guinea after its
orogenesis was well established, and are consequently
restricted to the lowlands south of the Central
Ranges. The proposition that E. novaeguineae was
among them but, by chance, dispersed across the
Central Ranges to the north of the island, is not
supported by our data, neither by our dates, nor the
topology of our phylogeny.
Interpretation of the divergence of the Birds Head
Clade from the Northern and Southern Clades
is more complex. One interpretation called the
‘docking hypothesis’ is that, in the early Miocene,
E. novaeguineae came to occupy and speciated on
an island terrane of continental origin that now
forms part of the Birds Head, presumably after it
broke away from the Australian craton in the
early Cretaceous but before its current docking to
mainland New Guinea (Polhemus, 2007). Presumably,
E. novaeguineae dispersed to the Birds Head during
an earlier connection, which may have been possible
as the result of a persistent close relationship of the
island terrane and the Australian continent (including New Guinea) (Polhemus & Polhemus, 1998). Two
201
of the major terranes that make up the Birds Head,
Kemum and Misool, are clearly continental in origin:
both Australia and the Birds Head share fossil
Glossopteris flora from the late Paleozoic–early Mesozoic (Chaloner & Creber, 1990), and the two have
similar paleomagnetic polar wander paths from the
late Carboniferous and Triassic (Giddings, Sunata &
Pigram, 1993). Paleomagnetic data indicate that the
Kemum Terrane detached from the main continental
landmass in the early Cretaceous and had a history
of movement independent of the Australian craton
until at least the Miocene (Pigram & Davies, 1987;
Giddings et al., 1993). During this period, the Kemum
Terrane was expanded by the fusion of both continental terranes (e.g. the Misool Terrane to its western
margin in the Late Oligocene) and oceanic terranes
(e.g. the Tamrou Terrane to its northern edge in the
late Miocene-early Pliocene) (Pigram & Davies, 1987).
The composite is then assumed to have moved eastward to integrate with greater New Guinea in the
late Miocene, via the Langguru Terrane, which, at
that time, may have already been attached to the
Australian craton (Pigram & Davies, 1987; Decker
et al., 2009). Once docked, E. novaeguineae would
have been able to disperse between the Birds Head
and mainland New Guinea, before the collisional
process described above drove the development of the
Langguru Fold Belt as an effective barrier to turtle
dispersal.
An alternative interpretation, called the ‘in situ
hypothesis’, arises because some geologists regard the
evidence for an allochthonous origin for the continental terranes of Kemum and Misool as unconvincing
(Dow & Sukamto, 1984; Charlton, 2000). They argue
that, on the contrary, the geological evidence strongly
supports a relatively local origin. Charlton (2000)
argues that the present structural isolation of the
Birds Head terranes from autochthonous Australia
has resulted from processes acting after initial collision of a coherent Australian continent with an island
arc system, rather than the pre-collisional disaggregation of the Australian margin of the allochthonous
terrane models. Here, the formation of the Langguru
Fold Belt arose through deformation from the counterclockwise rotation of the Birds Head, rather than a
more direct collisional process.
Under the in situ hypothesis, E. novaeguineae was
widespread before becoming fragmented by vicariance
events associated with the development of the Central
Ranges, the Langguru Fold Belt, and Cenderawasih
Bay. Formation of the Langguru Fold Belt in the
Birds Neck region (Bailly et al., 2009), coupled with
the opening of Cenderawasih Bay by counterclockwise
rotation of the Birds Head that began in the Early
Pliocene (Charlton, 2000), would have effectively isolated the populations to the west, on Birds Head and
© 2013 The Linnean Society of London, Biological Journal of the Linnean Society, 2014, 111, 192–208
202
A. GEORGES ET AL.
associated islands. It is important to note that the
very narrow continental shelf surrounding the Birds
Neck region would have maintained this isolation
through the periods of Pleistocene sea level lows (+1
to −135 m; Clark & Mix, 2002); the deep waters of the
Aru Trough and Cenderawasih Bay occur close to the
current coastline on either side of the Birds Neck
(Fig. 2) (Jongsma et al., 1989; Voris, 2000).
The in situ hypothesis fits less comfortably with the
molecular dates than the docking hypothesis because
the key geological events (creation of Cenderawasih
Bay – early Pliocene, 6 Mya; formation of Langguru
Fold Belt – Late Miocene, 11 Mya) (Charlton, 2000;
Bailly et al., 2009) are much younger than our
mean molecular dates of DNA divergence (19.8 Mya).
Also, the topology of the three major clades of
E. novaeguineae in the phylogeny is more directly
consistent with the docking hypothesis than the in
situ hypothesis because the Birds Head haplotypes
are collectively sister to a clade comprising the Northern and Southern Clades (Fig. 3). Regardless of which
hypothesis comes to prevail, the deeper divergence
of the Birds Head Clade than between the Northern
and Southern Clades in the present study is evidence
that the mechanisms of isolation of the Birds Neck
region predate the emergence of the Central Ranges
as a barrier to turtle dispersal. The opening of
Cenderawasih Bay is too recent (6 Mya) to have
initiated the isolation of the Birds Head populations
from those of the remainder of New Guinea, although
its deep waters will have served to sustain the isolation through successive sea level changes.
Our data challenge aspects of the geological history
of the relationship between the drifting Birds Head
terrane relative to mainland New Guinea because
our fossil calibrated molecular clock results find
much earlier divergences than predicted. This incongruence with the geological history is best evaluated by comparison with other biogeographical
and phylogeographical studies across the region.
Unfortunately, the taxonomy and biogeography of
many groups is poorly known within New Guinea.
Mitochondrial sequence variation among the passerine Little Shrike-Thrush Collurincincia megarhyncha, common and widespread in New Guinea, also
showed remarkable divergence among lineages, comparable to that observed among different species or
even genera of birds (5–11%). These divergences were
considered to be concordant with the estimated time
of formation of topographical barriers (Deiner et al.,
2011). A pattern of high genetic divergence north and
south of the Central Ranges has been demonstrated
for a range of taxa (LeCroy & Diamond, 1995;
Polhemus & Polhemus, 1998; McGuigan et al., 2000;
Dumbacher & Fleischer, 2001; Rawlings & Donnellan,
2003; Zwiers, Borgia & Fleischer, 2008; Unmack,
Allen & Johnson, 2013), which suggests isolation via
central montane orogenesis. Other species do not
respect the Central Ranges as a barrier and, instead,
show an east–west pattern of genetic structure
(Joseph et al., 2001; Murphy, Double & Legge, 2007);
for some, this may reflect ancient vicariance origins
on emergent terranes (Heads, 2002). Several studies
highlight the significance of the biota of the Birds
Head. Within birds, differences between Birds Head
and the remainder of New Guinea are referred to as
the ‘zoogeographers gap’ (Hartert et al., 1936), with
many species or subspecies of birds having concordant
disjunctions between Birds Head and northern and
southern regions (LeCroy & Diamond, 1995). In
aquatic organisms, Birds Head is noted as a distinct
biogeographical region for fishes (Allen, 1991: 268).
Aquatic Heteroptera of the Birds Head show strong
local endemism at the species level, and the Birds
Head shares almost all genera with greater New
Guinea, indicating close proximity of these two
regions since at least the beginning of the Tertiary
(Polhemus & Polhemus, 1998). Unfortunately, few
phylogenetic results exist for widespread taxa in New
Guinea that are comparable to the distribution of
E. novaeguineae. One study examined phylogenetic and morphological patterns in New Guinea
logrunners (Joseph et al., 2001). They found a deep
divergence (7.2% sequence divergence) between Birds
Head and species from remaining New Guinea.
The strongest evidence for congruence in phylogenetic and molecular clock estimates with
E. novaeguineae comes from rainbowfishes (McGuigan
et al., 2000; Unmack et al., 2013). Rainbowfishes
yielded remarkably similar dates of divergence for
three clades concordant with those of E. novaeguineae.
The majority of species in the family (approximately
77) are in the genera (Melanotaenia, Chilatherina, and
Glossolepis), distributed over most lowland regions of
New Guinea. Unmack et al. (2013) found three major
clades across New Guinea, with Birds Head comprising the first branching lineage, followed by a northern
and a southern clade. Molecular clock estimates were
based on a standard rate of molecular evolution.
Separation of Birds Head and mainland New Guinea
was estimated to have a mean age of 32.7 Mya (95%
HPD interval of 28.4–37.3 Mya), whereas separation
north and south of the Central Ranges was estimated
with a mean age of 27.0 Mya (95% HPD interval of
23.8–30.8 Mya) (Unmack et al., 2013). Although these
age estimates are older than for E. novaeguineae, the
use of a standard rate is only an approximate estimation. Similar to the results for E. novaeguineae, the
rainbowfish ages also challenge aspects of the geological interpretations for New Guinea. Only examination
of additional groups can shed further light on the
generality of these results.
© 2013 The Linnean Society of London, Biological Journal of the Linnean Society, 2014, 111, 192–208
PHYLOGEOGRAPHY OF AN ENDEMIC TURTLE
Mitochondrial variation within each of the three
major clades of E. novaeguineae shows some structure, which can be interpreted in the context of
different geomorphic conditions that influence connectivity between rivers occupied by the three clades.
Low sea levels during glacial maxima will have
increased connectivity between drainages in the
southern lowland owing to river coalescence on
the exposed continental shelf (Fig. 1). By contrast, the
northern region and most of the Birds Head changes
little because the continental shelf is very narrow
(Fig. 1). The topography of the three regions differs
considerably too because much of the lowlands in the
southern region has relatively little topographic relief
between drainages that would facilitate turtle movements between rivers (Fig. 1). Northern New Guinea
is more topographically complex, although there are
three major rivers (Ramu, Sepik, Mamberamo rivers)
with vast east–west extents that extend, and thus
facilitate, turtle movement across most of northern
New Guinea. By contrast, the Birds Head lacks larger
river basins and many drainages are isolated by
rugged topography, although some extensive flood
plain regions exist in the south (Fig. 1). These
geomorphic settings predict lower genetic divergences
across southern New Guinea, moderate divergences
in northern New Guinea, and highest divergences in
the Birds Head.
Based on haplotype divergences, our results are
broadly consistent with predicted patterns. Haplotype
divergences average only 0.3% in the south, 0.5% in
the north and 1.2% in the Birds Head (Table 1). Quite
a number of drainages in all three regions had evidence of contemporary interconnections provided by
the shared haplotypes, which is partially indicative of
the mobility of E. novaeguineae across lowland terrestrial environments. In the southern region, shared
haplotypes were found between the Bian [34] and
Merauke [35] rivers, and along the Timika Coast (Uta
[28], Aika [29], and Memika [30] rivers). Similar
haplotype exchange has occurred between the Tami
[23] and Sepik [25] rivers in the northern lowlands
and in the eastern Vogelkop Peninsula, between
the Ransiki [13], Mumi [14], Muturi [15], and Kuri
[16, 17] rivers (facilitated by the wetlands of the
Binituri basin); between the Klamaloe [9], Waromge
[10], and Bira [11] rivers; and between the Bira [11]
and Muturi [15] rivers of the southern Vogelkop
Peninsula.
The main divergence within the Southern Clade is
the group of haplotypes in the Kikori Delta [1]
(Fig. 2), presumably isolated from the drainages to
the west by the southern projection of the Darai
Plateau and associated uplands, as well as being
separated from other populations by a greater geographical distance (Fig. 1). In both the southern and
203
northern regions, most drainages show some structure between them, although, in the Southern Clade,
divergences are slightly lower and Lorentz [31] and
Urumbuwe [32] are paraphyletic, whereas most
drainages in the Northern Clade are reciprocally
monophyletic (except Tami [22, 23] and Sepik [24])
(Fig. 2). Results for the Southern Clade suggest that
the past few glacial cycles of low sea levels (which
exposed a large area of continental shelf; Fig. 1) have
not led to extensive sharing of turtle haplotypes; thus,
either the rivers that we sampled remained somewhat isolated or the turtles avoided the exposed continental shelf (they are yet to be recorded from
Australia which was connected via the exposed continental shelf). In the Birds Head region, there was a
greater number of shared haplotypes between rivers
but much deeper divergences within the clade (Fig. 2).
The deepest split within Birds Head Clade (with
100% bootstrap support) separates most drainages of
the southern lowlands of Vogelkop Peninsula (drainages [9], [10], [11], and [15] of Fig. 1) from those to the
east across the Binaturi Gulf in the Kiamana Peninsula [12], from the north-eastern and eastern portions
of Birds Head [13, 14, 16–18], and a geographically
eclectic population from Salawati Island [7], which is
otherwise geographically nested within the clade on
eastern Vogelkop Peninsula. Another unexpected
result was the lack of deeper divergence for the population from Waigeo Island [8] because the channel
between Waigeo Island and Vogelkop Peninsula is too
deep to have been exposed by sea level change.
Overall, the stronger mtDNA structuring within the
Birds Head Clade has most likely resulted from the
more complex landscape of the region compared with
the north and south of the remainder of New Guinea.
The taxonomy of E. novaeguineae is clearly in need
of revision given the deep divergences found between
the three clades (Fig. 2). The three major clades of
E. novaeguineae have long independent evolutionary
trajectories. Rhodin & Genorupa (2000) regard
E. novaeguineae as restricted to the north of the
Central Ranges and to the Birds Head, from
the Popondetta region of north-eastern PNG to the
Vogelkopf Peninsula in the west. They admit the
possibility that Elseya schultzei from the Tami River
near Jayapura might represent a distinct taxon, as
might the north-western Vogelkop populations from
around Sarong, the Sepik and eastern PNG, and the
isolated population on Waigeo Island. They regard the
populations to the south of the Central Range as a
distinct but undescribed species (they refer to it as
Elseya sp. 1), distinguished from those of the north
and Birds Head by the combination of a striking red
plastron in juveniles and subadults, and a generally
rounder carapace: the northern forms have a yellow
plastron at all ages and a more oval shell. This
© 2013 The Linnean Society of London, Biological Journal of the Linnean Society, 2014, 111, 192–208
204
A. GEORGES ET AL.
southern species is distributed from the Purari drainage of PNG to the Timika region of West Papua.
Rhodin & Genorupa (2000) identify another possible
species (Elseya sp. 2) in the Berau Gulf region, distinguished by a prominently serrated and keeled
shell. The Aru Islands population is also identified as
warranting further taxonomic investigation.
Our data provide support for the contention of
Rhodin & Genorupa (2000) that the populations to
the north of the central ranges comprise a distinct
species, schultzei (Vogt, 1911), and that the populations represented by our southern clade require
further investigation as a possible undescribed third
species. However, there is no strong evidence in our
data to warrant further subdivision at the species
level. The mtDNA of the Aru Island form falls clearly
within the south clade, and the Berau Gulf form falls
clearly within the Birds Head clade. The northern
and southern clades show lower genetic structure,
and the Birds Head clade shows somewhat more
structure. However, in the absence of a rigorous morphological analysis to identify characters that can be
used consistently to diagnose the taxa, and also infer
reproductive isolation, we do not regard there to be
more than one species represented within any of our
three clades.
New Guinea. Our data favour the drifting Birds Head
terrane hypothesis over the in situ hypothesis of an
early and persistent residence by E. novaeguineae in
the region of the Australian craton that is now the
Birds Head because both the topology of the phylogeny and the estimated dates of divergence more
strongly support the former than the latter hypothesis. This controversy is likely to be resolved definitively, if at all, only after we have concordance in
phylogeographical patterns from comparative studies
including other freshwater fauna, which support one
hypothesis more strongly than the other. What we can
say is that the historical driving influences on
contemporary genetic structure of E. novaeguineae
appear to have been early isolation, as subsequently
enforced by a combination of: (1) the early uplift of the
Central Ranges; (2) the development of the Langguru
Fold Belt; (3) the opening of Cenderawasih Bay; and
(4) the deep waters of the Aru Trough and
Cenderawasih Bay that come close to the current
coastline to maintain isolation of the Birds Head
through periods of sea level minima. Deep genetic
structure of the species complex reflects events and
processes that occurred during Miocene, whereas
structure within each clade across the New Guinea
landscape relates to Pliocene and Pleistocene times.
CONCLUSIONS
ACKNOWLEDGEMENTS
The present study is one of a number of recent
molecular studies that have demonstrated a surprisingly strong signature of geological history on genetic
substructuring of populations within species or
among closely-related species in New Guinea. Collectively, these previous studies, together with the
present study, demonstrate the value of biogeographical data in corroborating geological evidence for the
historical processes that have formed the modern
island of New Guinea, notwithstanding the limitations on geological dating arising from the complexity
of the tectonic history of New Guinea, and the uncertainties of molecular clock dating arising from a
paucity of fossils with sufficient definition to assign
reliable and precise dates for calibration. Our data do
not support the hypothesis of E. novaeguineae as a
relatively recent disperser to New Guinea in the
Pleistocene, as well as its subsequent chance dispersal across contemporary physiography that has
served as a barrier to the other six species of chelid
turtles in southern New Guinea. By contrast, the
exceptionally deep divergences of the three clades of
E. novaeguineae establish the distribution of this
endemic species as one best explained by early occupation (or invasion and dispersal) and subsequent
isolation by the dramatic landform changes that are
part of the middle and late Miocene of the island of
The authors would like to thank the Hermon Slade
Foundation for funding this work, and for their
patience with respect to delays in completing it. Work
conducted at the AMNH was supported by the
Alfred P. Sloan foundation. ML was supported by
grant 106.15–2010.30 from the National Foundation for Science and Technology Development
(NAFOSTED) of Vietnam. We would also like to
thank the many people who assisted us in the field,
and, in particular, Enzo Guarino, and the many villages that we visited for sharing their knowledge with
us. W.P.M. was responsible for securing the specimens
from Indonesian Papua and West Papua. Carla
Eisemberg collected many of the tissue samples from
the Kikori. Benedict Yaru, Jack Kaiwari, Mathew
Wa’abiya, Stephen Dekene, Andrew Nema, Arnold
Moi, Robert Kiapranis, Morgan Veao, Sarah Ekali
(Oil Search Ltd), Ken Webb (KOI), Lydia Kaia,
Dennis Badi, Felix Kinginapi (WWF), Cathy Alex and
Veronika Kenisi (CDI), and Jim Robins (NRI) assisted
greatly with logistics in PNG. The PNG Department
of Environment and Conservation and Lance Hill of
the University of PNG sponsored the work in PNG.
This project received logistic support from Oil Search
Ltd and the Worldwide Fund for Nature. Rachael
Walsh, Erika Alacs, and Marion Hoen of the Wildlife
Genetics Laboratory at the University of Canberra
© 2013 The Linnean Society of London, Biological Journal of the Linnean Society, 2014, 111, 192–208
PHYLOGEOGRAPHY OF AN ENDEMIC TURTLE
generated some of the sequence data of the restricted
gene set, for which we are most grateful. Tim
Charlton, Dan Janes, Kate Hodges, members of the
Science Writers Workshop, and three anonymous
reviewers provided valuable comments on drafts of
this paper.
REFERENCES
Allen GR. 1991. Field guide to the freshwater fishes of New
Guinea. Madang: Christensen Research Institute.
Arévalo E, Davis SK, Sites J. 1994. Mitochondrial DNA
sequence divergence and phylogenetic relationships among
eight chromosome races of the Sceloporus grammicus
complex (Phrynosomatidae) in Central Mexico. Systematic
Biology 43: 387–418.
Avise JC, Arnold J, Ball RMJ, Bermingham E, Lamb T,
Neigel JE, Reed CA, Saunders NC. 1987. Intraspecific
phylogeography: the mitochondrial DNA bridge between
population genetics and systematics. Annual Review of
Ecology and Systematics 18: 489–522.
Bailly V, de Sigoyer J, Pubellier M, Ringenbach JC.
2009. Deformation zone jumps, in a young convergent
setting; the Lengguru fold-and-thrust belt, New Guinea
Island. Lithos 113: 306–317.
Barth D, Bernhard D, Fritzsch G, Fritz U. 2004.
The freshwater turtle genus Mauremys (Testudines:
Geoemydidae) – a textbook example of an east-west disjunction or a taxonomic misconcept? Zoologica Scripta 33: 213–
221.
Bouckaert R, Heled J, Kühnert D, Vaughan TG, Wu CH,
Xie D, Suchard MA, Rambaut A, Drummond AJ. 2013.
BEAST2: a software platform for Bayesian evolutionary
analysis. Available at:
Boulenger GA. 1889. Catalogue of the chelonians,
rhynchocephalians, and crocodiles in the British Museum
(Natural History). London: British Museum.
de Broin LF, Molnar RE. 2001. Eocene chelid turtles
from Redbank Plains, Southeast Queensland, Australia.
Geodiversitas 23: 41–79.
Burridge CP, Craw D, Waters JM. 2006. River capture,
range expansion, and cladogenesis: the genetic signature of
freshwater vicariance. Evolution 60: 1038–1049.
Chaloner WG, Creber GT. 1990. Fossil plants as indicators
of Late Palaeozoic plate positions. Geological Society of
London, Memoirs 12: 363–379.
Charlton TR. 2000. Tertiary evolution of the Eastern Indonesia collision complex. Journal of Asian Earth Science 18:
603–631.
Clark PU, Mix AC. 2002. Ice sheets and sea level of the Last
Glacial Maximum. Quaternary Science Reviews 21: 1–7.
Cogger HG, Heatwole H. 1981. The Australian reptiles:
origins, biogeography, distribution patterns and island evolution. In: Keast A, ed. Ecological biogeography of Australia.
The Hague: Dr W. Junk, 1331–1374.
Cohen TJ, Nanson GC, Jansen JD, Jones BG, Jacobs Z,
Treble P, Price DM, May J-H, Smith AM, Ayliffe LK,
205
Hellstrom JC. 2011. Continental aridification and the vanishing of Australia’s megalakes. Geology 39: 167–170.
Cook BD, Adams M, Mather P, Hughes JM. 2012. Statistical phylogeographic tests of competing ‘Lake Carpentaria
hypotheses’ in the mouth-brooding freshwater fish,
Glossamia aprion (Apogonidae). Marine and Freshwater
Research 63: 450–456.
Decker J, Bergman SC, Teas PA, Baillie P., Orange DL.
2009. Constraints on the tectonic evolution of the Bird’s
Head, West Papua, Indonesia. 33rd Annual Convention of
the Indonesian Petroleum Association. 491–514.
Deiner K, Lemmon AR, Mack AL, Fleischer RC,
Dumbacher JP. 2011. A passerine bird’s evolution corroborates the geological history of the island of New Guinea.
PLoS ONE 6: e19479, 1–15.
Donoghue PCJ, Benton MJ. 2007. Rocks and clocks: calibrating the Tree of Life using fossils and molecules. Trends
in Ecology and Evolution 22: 424–431.
Douady CJ, Catzeflis F, Raman J, Springer MS,
Stanhope MJ. 2003. The Sahara as a vicariant agent, and
the role of Miocene climatic events, in the diversification of
the mammalian order Macroscelidea (elephant shrews).
Proceedings of the National Academy of Sciences of the
United States of America 100: 8325–8330.
Dow DB, Sukamto R. 1984. Western Irian Jaya: the end
product of oblique plate convergence in the Late Tertiary.
Teconophysics 106: 109–140.
Dumbacher JP, Fleischer RC. 2001. Phylogenetic evidence
for colour pattern convergence in toxic Piohuis: Mullerian
mimicry in birds? Proceedings of the Royal Society of
London Series B, Biological Sciences 268: 1971–1976.
Engstrom TN, Shaffer HB, McCord W. 2002. Phylogenetic
diversity of endangered and critically endangered southeast
Asian softshell turtles (Trionychidae: Chitra). Biological
Conservation 104: 173–179.
Fielder D, Vernes K, Alacs E, Georges A. 2012.
Mitochondrial variation among Australian freshwater
turtles (genus Myuchelys) with special reference to the
endangered M. bellii. Endangered Species Research 17:
63–71.
FitzSimmons NN, Moritz C, Moore S. 1995. Conservation
and dynamics of microsaltellite loci over 300 million years of
marine turtle evolution. Molecular Biology and Evolution
12: 432–440.
Gaffney ES. 1979. Fossil chelid turtles of Australia. American Museum Novitates 2681: 1–23.
Georges A, Adams M. 1992. A phylogeny for Australian
chelid turtles based on allozyme electrophoresis. Australian
Journal of Zoology 40: 453–476.
Georges A, Adams M. 1996. Electrophoretic delineation of
species boundaries within the shortnecked chelid turtles of
Australia. Zoological Journal of the Linnean Society,
London 118: 241–260.
Georges A, Alacs E, Pauza M, Kinginapi F, Ona A,
Eisemberg C. 2008. Freshwater turtles of the Kikori
Drainage, Papua New Guinea, with special reference to the
pig-nosed turtle, Carettochelys insculpta. Wildlife Research
35: 700–711.
© 2013 The Linnean Society of London, Biological Journal of the Linnean Society, 2014, 111, 192–208
206
A. GEORGES ET AL.
Georges A, Birrell J, Saint K, McCord WP, Donnellan S.
1998. A phylogeny for side-necked turtles (Chelonia:
Pleurodira) based on mitochondrial and nuclear gene
sequence variation. Biological Journal of the Linnean
Society, London 67: 213–246.
Georges A, Guarino F, Bito B. 2006. Freshwater turtles of
the TransFly Region of Papua New Guinea – notes on
diversity, distribution, reproduction, harvest and trade.
Wildlife Research 33: 373–384.
Georges A, Thomson S. 2010. Diversity of Australasian
freshwater turtles, with an annotated synonymy and keys
to species. Zootaxa 2496: 1–37.
Georges A, Zhang X, Unmack P, Reid BN, Le M, McCord
WP. 2013. Data from: Contemporary genetic structure of an
endemic freshwater turtle reflects Miocene orogenesis of
New Guinea. Dryad Digital Repository. doi: 10.5061/
dryad.tf8q1.
Giddings JW, Sunata W, Pigram CJ. 1993. Reinterpretation of palaeomagnetic results from the Bird’s Head, Irian
Jaya: new constraints on the drift history of the Kemum
Terrane. Exploration Geophysics 24: 283–290.
Glaessner MF. 1942. The occurrence of the New Guinea
turtle (Carettochelys) in the Miocene of Papua. Records of
the Australian Museum 21: 106–109.
Goode J. 1967. Freshwater tortoises of Australia and New
Guinea (in the family Chelidae). Melbourne: Lansdowne
Press.
Hartert E, Paludan K, Rothschild W, Stresemann E.
1936. Ornithologische Ergebnisse der Expedition Stein
1931–1932. IV. Die Vogel des Weyland-Gebirges und seines
Vorlandes. Mitteilungen aus dem zoologischen Museum in
Berlin 21: 11–240.
Heads M. 2002. Birds of paradise, vicariance biogeography
and terrane tectonics in New Guinea. Journal of Biogeography 29: 261–283.
Ho SY, Larson G, Edwards CJ, Heupink TH, Lakin KE,
Holland PW, Shapiro B. 2008. Correlating Bayesian date
estimates with climatic events and domestication using a
bovine case study. Biology Letters 4: 370–374.
Hope GS, Aplin KP. 2007. Paleontology of Papua. In: Hall R,
Holloway JD, eds. Biogeography and geological evolution of
SE Asia. Leiden: Backhuys Publishers, 246–254.
Hurwood DA, Hughes JM. 1998. Phylogeography of
the freshwater fish, Mogurnda adspersa, in streams of
northeastern Queensland, Australia: evidence for altered
drainage patterns. Molecular Ecology 7: 1507–1517.
Jongsma D, Huson W, Woodside JM, Suparka S,
Sumantri T, Barber AJ. 1989. Bathymetry and geophysics of the Snellius-II triple junction and tentative seismic
stratigraphy and neotectonics of the northern Aru Trough.
Netherlands Journal of Sea Research 24: 231–250.
Joseph L, Slikas B, Alpers D, Schodde R. 2001. Molecular
systematics and phylogeography of New Guinean
logrunners (Orthonychidae). Emu 101: 273–280.
Joyce WG, Parham JF, Lyson TR, Warnock RCM,
Donoghue PCJ. 2013. A divergence dating analysis of
turtles using fossil calibrations: an example of best practices. Journal of Paleontology 87: 612–634.
Katoh K, Standley DM. 2013. MAFFT multiple sequence
alignment software version 7: improvements in performance
and usability. Molecular Biology and Evolution 30: 772–
780.
Kennedy TA, Naeem S, Howe KM, Knops JMH, Tilman
D, Reich P. 2002. Biodiversity as a barrier to ecological
invasion. Nature 417: 636–638.
Kocher TD, Thomas WK, Meyer A, Edwards SV, Pääbo
S, Villablanca FX, Wilson AC. 1989. Dynamics of
mitochondrial DNA: evolution in animals – amplification
and sequencing with conserved primers. Proceedings of
the National Academy of Sciences of the United States of
America 86: 6196–6200.
Kumar S. 1996. PHYLTEST: phylogenetic hypothesis testing
software, Version 2.0. University Park, PA: Pennsylvania
State University.
Lambeck K, Chappell J. 2001. Sea level change through the
last glacial cycle. Science 292: 679–686.
Langford RP, Wilford GE, Truswell EM, Isern AR. 1995.
Palaeogeographic atlas of Australia, Vol. 10 – cainozoic.
Australian geological survey organisation. Canberra: Australian Geological Survey Organisation.
Le M, Reid BN, McCord WP, Naro-Maciel E, Raxworthy
CJ, Georges A. 2013. Resolving the phylogenetic history of
the short-necked turtles, genera Elseya and Myuchelys
(Testudines: Chelidae) from Australia and New Guinea.
Molecular Phylogenetics and Evolution 68: 251–258.
LeCroy M, Diamond J. 1995. Plumage variation in the
broad-billed fairy-wren Malurus grayi. Emu 95: 185–193.
Mackness BS, Whitehead PW, McNamara GC. 2000. New
potassium-argon basalt date in relation to the Pliocene Bluff
Downs Local Fauna, northern Australia. Australian Journal
of Earth Science 47: 807–811.
Magee JW, Miller GH, Spooner NA, Questiaux D. 2004.
A continuous 150 k.y. monsoon record from Lake Eyre,
Australia: insolation-forcing implications and unexpected
Holocene failure. Geology 32: 885–888.
Maguire KC, Stigall AL. 2008. Paleobiogeography of
Miocene equinae of North America: a phylogenetic biogeographic analysis of the relative roles of climate, vicariance,
and
dispersal.
Palaeogeography,
Palaeoclimatology,
Palaeoecology 267: 175–184.
Mayr E. 1944. Wallace’s line in the light of recent zoogeographic studies. Quarterly Review of Biology 19: 1–14.
McDowell SB. 1983. The genus Emydura (Testudines:
Chelidae) in New Guinea with notes on the penial morphology of Pleurodira. In: Rhodin A, Miyata K, eds. Advances in
herpetology and evolutionary biology: essays in honour of
Ernest E. Williams. Cambridge, MA: Harvard University,
Museum of Comparative Zoology, 169–189.
McGuigan K, Zhu D, Allen GR, Moritz C. 2000.
Phylogenetic relationships and historical biogeography of
melanotaeniid fishes in Australia and New Guinea. Marine
and Freshwater Research 51: 713–723.
Meyer AB. 1874. Platemys novaeguineae sp. nov. Dr. W. H.
Peters legte vor: Eine mittheilung von Hrn. Adolf Bernhard
Meyer uber die von ihm auf Neu-Guinea under den Inseln
Jobi, Mysore und Mafoor im Jahre 1873 gesammelten
© 2013 The Linnean Society of London, Biological Journal of the Linnean Society, 2014, 111, 192–208
PHYLOGEOGRAPHY OF AN ENDEMIC TURTLE
Amphibien. Monatsberichte der Königlich preussischen
Akademie der Wissenschaften zu Berlin 39: 128–140.
Meylan PA. 1988. Peltochelys Dollo and the relationships
among the genera of Carettochelyidae (Testudines:
Reptilia). Herpetologica 44: 440–450.
Miller S, Dykes D, Polesky H. 1988. A simple salting out
procedure for extracting DNA from human nucleated cells.
Nucleic Acids Research 16: 1215.
Muller J, Reisz RR. 2005. Four well-constrained calibration
points from the vertebrate fossil record for molecular clock
estimates. BioEssays 27: 1069–1075.
Murphy SA, Double MC, Legge SM. 2007. The
phylogeography of palm cockatoos, Probosciger aterrimus, in
the dynamic Australo-Papuan region. Journal of Biogeography 34: 1534–1545.
Nyári ÁS, Joseph L. 2013. Comparative phylogeography
of Australo-Papuan mangrove-restricted and mangroveassociated avifaunas. Biological Journal of the Linnean
Society 109: 574–598.
Palumbi S, Martin A, Romano S, McMilln WO, Stice L,
Grabowski G. 1991. The simple fool’s guide to PCR,
Version 2.0. Honolulu, HI: University of Hawaii.
Pigram CJ, Davies HL. 1987. Terranes and the accretion history of the New Guinea Orogen. BMR Journal of
Australian Geology and Geophysics 10: 193–211.
Pigram CJ, Symonds PA. 1991. A review of the timing of
the major tectonic events in the New Guinea orogen.
Journal of Southeast Asian Earth Sciences 6: 307–318.
Polhemus DA. 2007. Tectonic geology of Papua. In: Marshall
AJ, Beehler BM, eds. The ecology of Papua. Part 1. Singapore: Periplus Press, 137–164.
Polhemus DA, Polhemus JT. 1998. Assembling New Guinea:
40 million years of island arc accretion as indicated by the
distributions of aquatic Heteroptera (Insecta). In: Hall R,
Holloway JD, eds. Biogeography and geological evolution of
SE Asia. Leiden: Backhuys Publishers, 327–340.
Posada D, Crandall K. 1998. Modeltest: testing the model of
DNA substitution. Bioinformatics 14: 817–818.
Rambaut A, Drummond AJ. 2007. Tracer v1.4. Available at:
/>Rawlings LH, Donnellan SC. 2003. Phylogeographic analysis of the green python, Morelia viridis, reveals cryptic
diversity. Molecular Phylogenetics and Evolution 27: 36–44.
Reeves JM, Chivas AR, Garcia A, Holt S, Couapel MJJ,
Jones BG, Cendon DI, Fink D. 2008. The sedimentary
record of palaeoenvironments and sea-level change in the
Gulf of Carpentaria, Australia, through the last glacial
cycle. Quaternary International 183: 3–22.
Rhodin AGJ, Genorupa VR. 2000. Conservation status of
freshwater turtles in Papua New Guinea. Chelonian
Research Monographs 2: 129–136.
Rhodin AGJ, Mittermeier RA, Hall PM. 1993. Distribution, osteology and natural history of the Asian giant
softshell turtle, Pelochelys bibroni, in Papua New Guinea.
Chelonian Conservation and Biology 1: 19–30.
Rowe KC, Reno ML, Richmond DM, Adkins RM, Steppan
SJ. 2008. Pliocene colonization and adaptive radiations in
Australia and New Guinea (Sahul): multilocus systematics of
207
the old endemic rodents (Muroidea: Murinae). Molecular
Phylogenetics and Evolution 47: 84–101.
Sanmartíin I, Ronquist F. 2004. Southern hemisphere biogeography inferred by event-based models: plant versus
animal patterns. Systematic Biology 53: 216–243.
Schultz MB, Erodiaconou DA, Smith SA, Horwitz P,
Richardson AMM, Crandall KA, Austin CM. 2008. Sealevel changes and palaeo-ranges: reconstruction of ancient
shorelines and river drainages and the phylogeography of the
Australian land crayfish Engaeus sericatus Clark (Decapoda:
Parastacidae). Molecular Ecology 17: 5291–5314.
Shaffer HB, Minx P, Warren DE, Shedlock AM, Thomson
RC, Valenzuela N, Abramyan J, Amemiya CT,
Badenhorst D, Biggar KK, Borchert GM, Botka CW,
Bowden RM, Braun EL, Bronikowski AW, Bruneau
BG, Buck LT, Capel B, Castoe TA, Czerwinski M,
Delehaunty KD, Edwards SV, Fronick CC, Fujita MK,
Fulton L, Graves TA, Green RE, Haerty W, Hariharan
R, Hernandez O, Hillier LW, Holloway AK, Janes D,
Janzen FJ, Kandoth C, Kong L, de Koning APJ, Li Y,
Literman R, McGaugh SE, Mork L, O’Laughlin M,
Paitz RT, Pollock DD, Ponting CP, Radhakrishnan S,
Raney BJ, Richman JM, St John J, Schwartz T,
Sethuraman A, Spinks PQ, Storey KB, Thane N, Vinar
T, Zimmerman LM, Warren WC, Mardis ER, Wilson
RK. 2013. The western painted turtle genome, a model for
the evolution of extreme physiological adaptations in a
slowly evolving lineage. Genome Biology 14: R28.
Smith ET. 2010. Early Cretaceous chelids from Lightning
Ridge, New South Wales. Alcheringa 34: 375–384.
Stanaway R. 2008. PNG on the move – GPS monitoring of
plate tectonics and earthquakes. 42nd Association of Surveyors PNG Congress. Port Moresby.
Swofford DL. 2002. PAUP*. Phylogenetic analysis using parsimony (*and other methods), Version 4. Sunderland, MA:
Sinauer Associates.
Takezaki N, Rzhetsky A, Nei M. 2004. Phylogenetic test of
the molecular clock and linearized trees. Molecular Biology
and Evolution 12: 823–833.
Tamura K, Nei M. 1993. Estimation of the number
of nucleotide substitutions in the control region of
mitochondrial DNA in humans and chimpanzees. Molecular
Biology and Evolution 10: 512–526.
Thomson S, Georges A. 2009. Myuchelys gen. nov. – a new
genus for Elseya latisternum and related forms of Australian freshwater turtle (Testudines: Pleurodira: Chelidae).
Zootaxa 2053: 32–42.
Thomson SA, Mackness B. 1999. Fossil turtles from the
early Pliocene Bluff Downs Local Fauna, with a description
of a new species of Elseya. Transactions of the Royal Society
of South Australia 123: 101–105.
Todd EV, Blair D, Georges A, Lukoschek V, Jerry DR.
2013. A biogeographic history and timeline for the evolution
of Australian snapping turtles (Elseya: Chelidae) in Australia and New Guinea. Journal of Biogeography. In press.
van Ufford AQ, Cloos M. 2005. Cenozoic tectonics of New
Guinea. AAPG Bulletin (American Society of Petroleum
Geologists) 89: 119–140.
© 2013 The Linnean Society of London, Biological Journal of the Linnean Society, 2014, 111, 192–208
208
A. GEORGES ET AL.
Unmack PJ, Allen GR, Johnson JB. 2013. Phylogeny
and biogeography of rainbowfishes (Melanotaeniidae) from
Australia and New Guinea. Molecular Phylogenetics and
Evolution 67: 15–27.
Vogt T. 1911. Emydura schultzei, sp. nov. Reptilien und
Amphibien aus Neu Guinea. Sitzungsberichte der
Gesellschaft naturforschender Freunde zu Berlin 9: 410–
412.
Voris HK. 2000. Maps of Pleistocene sea levels in Southeast
Asia: shorelines, river systems and time durations. Journal
of Biogeography 27: 1153–1167.
Wallace AR. 1860. On the zoological geography of the Malay
archipelago. Journal of the Linnean Society, London 4: 172–
184.
Wüster W, Dumbrell AJ, Hay C, Pook CE, Williams DJ,
Fry BG. 2005. Snakes across the Strait: trans-Torresian
phylogeographic relationships in three genera of Australasian snakes (Serpentes: Elapidae: Acanthophis, Oxyuranus,
and Pseudechis). Molecular Phylogenetics and Evolution 34:
1–14.
Zwiers PB, Borgia G, Fleischer RC. 2008. Plumage based
classification of the bowerbird genus Sericulus evaluated
using a multi-gene, multigenome analysis. Molecular
Phylogenetics and Evolution 46: 923–931.
ARCHIVED DATA
Data deposited in the Dryad digital repository (Georges et al., 2013).
SUPPORTING INFORMATION
Additional Supporting Information may be found in the online version of this article at the publisher’s web-site:
Figure S1. Bayesian molecular clock estimates for the Australian short-necked chelid radiation based on
analysis of mitochondrial and nuclear DNA. The numbers by the nodes represent the mean ages in Mya;
horizontal bars represent the 95% highest posterior density intervals. A hash symbol (#) indicates the node
where the fossil calibrations were placed.
© 2013 The Linnean Society of London, Biological Journal of the Linnean Society, 2014, 111, 192–208