Service quality and customer satisfaction A case study of hotel industry in Vietnam
Bạn đang xem bản rút gọn của tài liệu. Xem và tải ngay bản đầy đủ của tài liệu tại đây (405.32 KB, 14 trang )
Seediscussions,stats,andauthorprofilesforthispublicationat: />
ServiceQualityandCustomerSatisfaction:A
CaseStudyofHotelIndustryinVietnam
ArticleinAsianSocialScience·March2015
DOI:10.5539/ass.v11n10p73
CITATIONS
READS
5
488
4authors:
MinhNguyen
NguyenThuHa
YokohamaNationalUniversity
VietnamNationalUniversity,Hanoi
3PUBLICATIONS5CITATIONS
3PUBLICATIONS16CITATIONS
SEEPROFILE
SEEPROFILE
PhanChiAnh
YoshikiMatsui
VietnamNationalUniversity,Hanoi
YokohamaNationalUniversity
17PUBLICATIONS148CITATIONS
34PUBLICATIONS300CITATIONS
SEEPROFILE
SEEPROFILE
AllcontentfollowingthispagewasuploadedbyYoshikiMatsuion02August2016.
Theuserhasrequestedenhancementofthedownloadedfile.Allin-textreferencesunderlinedinblueareaddedtotheoriginaldocument
andarelinkedtopublicationsonResearchGate,lettingyouaccessandreadthemimmediately.
Asian Social Science; Vol. 11, No. 10; 2015
ISSN 1911-2017
E-ISSN 1911-2025
Published by Canadian Center of Science and Education
Service Quality and Customer Satisfaction: A Case Study of Hotel
Industry in Vietnam
Nguyen Hue Minh1,2, Nguyen Thu Ha1, Phan Chi Anh1 & Yoshiki Matsui2
1
Faculty of Business Administration, University of Economics and Business, Vietnam National University,
Vietnam
2
College of Business Administration, Yokohama National University, Japan
Correspondence: Nguyen Hue Minh, Faculty of Business Administration, University of Economics and Business,
Vietnam National University, Vietnam; College of Business Administration, Yokohama National University,
Japan. Tel: 81-80-3591-8590. E-mail: ;
Received: July 19, 2014
doi:10.5539/ass.v11n10p73
Accepted: January 1, 2015
Online Published: April 20, 2015
URL: />
Abstract
The purpose of this study is to empirically examine the relationship between service quality and customer
satisfaction in Vietnamese hotels, survey questionnaire was constructed with 23 service quality items covering 5
service quality dimensions based on SERVQUAL model. Data were collected from 432 guests of 33 three-star
hotels in Vietnam in 2013. Analysis results indicate that Reliability, Responsiveness, Assurance, and Empathy
significantly impact on the customer satisfaction. The study implies that service quality plays an important role
as a driver for higher customer satisfaction level in hotel service. Managers would focus on Empathy, Reliability,
Responsiveness, and Assurance to achieve high degree of customer satisfaction which leads to customer loyalty
and business profit.
Keywords: customer satisfaction, hotel, service quality
1. Introduction
Quality has attracted the attention of practitioners and academicians over the years but mostly in the
manufacturing sector at the first stage. Since 1980s, however, the importance of quality for business performance
in service sector has been also widely recognized in the literature through the great impacts on different
dimensions of business performance. To study service quality, several measurement frameworks were
established such as Technique and functional quality model Gronroos (1984), SERVQUAL (Parasuraman et al.,
1985, 1988), Synthesized model of service quality (Brogowicz et al., 1990); SERVPERF (Cronin & Taylor,
1992), Antecedents and mediator model (Dabholkar et al., 2000). Based on those frameworks, researchers found
the benefits of service quality include the improvement of customer satisfaction and customer retention, positive
word of mouth, the decline in staff turnover and operating costs, the enlargement of market share, and the growth
of profitability (Kandampully & Suhartanto, 2000; Sureshchandar et al., 2002; Kang & James, 2004; Ladhari,
2009). The researchers also highlighted the importance of service quality with direct effects on customer
satisfaction as well as indirect effects on customer loyalty (Hossain, 2012; Al Khattab & Aldehayyat, 2011;
Karunaratne & Jayawardena, 2010).
Tourism is often viewed as a “smokeless industry” bringing tremendous values to the global economies. Asia is
one of amazing and most popular destinations for tourists which offer a wide-range of attractions in terms of
landscape, culture, and people. Especially, tourism in ASEAN countries has seen considerable development by
attracting a huge and increasing number of arrivals with 73.7 million tourists in 2010, 81.2 million in 2011, and
89.2 million in 2012 (Association of Southeast Asian nations, 2014).
In Vietnam, tourism business is considered as a promising prospect to this nation's development. It welcomed
more than 5 million visitors in 2010, more than 6 million visitors in 2011, and nearly 7 million visitors in 2012
(Association of Southeast Asian nations, 2014). Total revenue of tourism industry has increased rapidly from 4.8
billion USD in 2010 to 6.5 billion USD in 2011, and to 8 billion USD in 2012. It has contributed over 5% to
Vietnamese GDP and created jobs for more than 334,000 direct labors and approximately 710,000 indirect labors
(Thornton, 2012).
73
www.ccsenet.org/ass
Asian Social Science
Vol. 11, No. 10; 2015
Hotel service is recently regarded as one of core businesses making up the tourism complex system which is one
of the fastest growing industries in Vietnam during the past decade. The intensively competitive market requires
hoteliers continuously renew and improve themselves to attract customers. In this context, the attention to
service quality from the customer’s perspective is considered as one of the most important factors deciding the
success of tourism and hotel businesses. Therefore, the measurement of service quality and the evaluation of its
impact on the customer satisfaction have been a great concerned topic for academics and practitioners in many
service industries including tourism and hotel industries. To measure service quality in hotel, lodging, hospitality
business, several frameworks have been developed such as LODGSERV (Knutson et al., 1990), LQI (J. M. Getty
& R. L. Getty, 2003) and HOLSERV (Mei et al., 1999); and many studies adopted these scales to evaluate
perceived quality in hotel services such as Wilkins et al., (2007), Ladhari, (2009), Al Khattab and Aldehayyat
(2011), Boonitt and Rompho (2012), Karunaratne and Jayawardena (2010), Hossain (2012), Markovic and
Raspor (2010), Juwaheer (2004), Juwaheer and Ross (2003). These studies provided mixed results on the
impacts of different service quality dimensions on customer satisfaction and customer loyalty in various regions
including Asian countries. However, the application of such frameworks in measuring service quality in
Vietnamese hotel businesses is still limited.
To fill this gap, our study is conducted to empirically investigate hotel service quality in Vietnam. The main
objectives of this study are to measure perceived service quality at Vietnamese hotels and its impact on customer
satisfaction.
The paper starts with reviewing the empirical literature of service quality and customer satisfaction. A simple
analytical framework is introduced in the third section, which is followed by research methodology, data
collection, measurement testing, and hypotheses testing. The last two sections are discussions and implications,
and conclusions.
2. Literature Review
The importance of service quality for business performance has been recognized in the literature through the
direct effect on customer satisfaction and the indirect effect on customer loyalty (Al Khattab and Aldehayyat,
2011). Various scales and indexes to measure service quality such as Technical and Functional Quality model
(Gronroos, 1984), SERVQUAL (Parasuraman et al., 1985, 1988), Synthesized model of service quality
(Brogowicz et al., 1990); SERVPERF (Cronin & Taylor, 1992), Antecedents and mediator model (Dabholkar et
al., 2000) have been developed and extensively used by academics and practitioners. Among them, SERVQUAL
is often considered as the most commonly applied in a numerous empirical studies across various service
industries and in many countries.
SERVQUAL scale was originally developed by Parasuraman et al. in 1985 by comparing expectations with
perceptions on 10 service quality aspects. By 1988, this scale was further identified with 5 dimensions of service
quality namely Tangible, Reliability, Responsiveness, Assurance and Empathy. These five dimensions are thus
assessed by a total of 44 items in which 22 items to measure the general expectations of customers concerning a
service; and the remaining 22 items to measure the perceptions of customers regarding the levels of service
actually provided by the company within that service category (Ladhari, 2009).
However, SERVQUAL has been criticized on its confusion, and SERVPERF was proposed by Cronin and Taylor
(1992) in which “expectation” - (E) component of SERVQUAL be discarded and instead “performance” - (P)
component alone be measured by 22 items. Methodologically, the SERVPERF scale represents marked
improvement over the SERVQUAL scale by reducing the number of items by 50 per cent, and being able to
explain greater variance in the service quality measured through the use of single-item scale (Jain & Gupta,
2004).
Although the SERVQUAL scale is a very useful instrument as its concept, it is still needed to be adapted for
specific service industry. Guided by SERVQUAL, LODGSERV scale was specifically tailored to the lodging
industry by Knutson et al. (1990). This scale initially contained 36 items designed to tap various aspects of the 5
service quality dimensions namely Tangible, Reliability, Responsiveness, Assurance, and Empathy. The items
were used to measure consumers’ expectations for service quality in a hotel experience. After three testing
instruments including validity, reliability and utility, 10 of the original 36 questions were shown to not contribute
meaning to the index, and final version of LODGSERV was completed with 26 question items.
74
www.ccsenet.org/ass
Asian Social Science
Vol. 11, No. 10; 2015
Table 1. Summary of empirical studies on hotel service quality
Authors
Hossain (2012)
Study
Impact of perceived
service quality on
satisfaction of tourists
visiting Cox’s Bazar
in Bangladesh
Survey instruments and data collection
- 5 dimensions: Tangibles, Reliability,
Responsiveness,
Assurance
and
Empathy
- 22 question items, 5-point Likert scale
from “strongly disagree” to “strongly
agree”
- Sample size: 385 tourists
Boonitt
&
Rompho (2012)
Al Khattab &
Aldehayyat
(2011)
Markovic
&
Raspor (2010)
Karunaratne &
Jayawardena
(2010)
Measuring
Service
Quality Dimensions
and
comparing
between boutique and
business hotels in
Thailand
Measuring
hotels’service quality
performance
from
customer perspective
in Jordan
- Sample size: 108 responses
- 5 dimensions: Tangibles, Reliability,
Responsiveness,
Assurance
and
Empathy
- 26 question items, 5-point Likert scale
from “strongly disagree” to “strongly
agree”
- Sample size: 280 responses
Measuring perceived
service quality of 15
hotels in the Opatija
Riviera (Croatia) to
determine the factor
structure of service
quality perception
- 4 dimensions: Reliability, Empathy
and competence of staff, Accessibility,
Tangibles
Assessment
of
customer satisfaction
of a five-star hotel
located in Kandy
district, Sri Lanka,
- 5 dimensions: Tangibility, Reliability,
Responsiveness,
Assurance
and
Empathy.
Exploring perceptions
of international
Juwaheer
(2004)
- Customized SERVQUAL model with
29 indicators, 5-point Likert scale from
“very low” to “very high”
tourists about hotel
service quality in
Mauritius
- 29 question items, 7-point Likert scale
from “very low perceptions” to “very
high perceptions”
- Sample size: 253 responses
- 49 question items, 5-point Likert scale
- Sample size: 60 residential customers
- 9 dimensions: Reliability, Assurance,
Extra
room
amenities,
Staff
communication
and
additional
amenities sought, Room attractiveness
and décor, Empathy, Staff outlook and
accuracy, Food and service related,
Hotel surroundings and environmental
factors
- 39 question items, 5-point Likert scale
from “very low expectation” to “very
high expectation”
Main findings
Five service quality dimensions have
positively significant impact on
customer satisfaction. The strongest
factor is empathy, followed by
responsiveness, reliability, assurance
and tangibles.
Service quality was moderately low.
Hotels were not able to deliver
services as expected. Also, the
customer expectation of the services
of the boutique hotels was higher
than that of the business hotels.
Hotel customers are expecting more
improved services from the hotels in
all service quality dimensions. They
have the lowest perception scores on
empathy and tangibles.
‘Reliability,’
‘empathy
and
competence of staff,’ ‘accessibility’
and ‘tangibles’ are the key factors
that best explained customers’
expectations. Among the four
dimensions, ‘reliability’ has emerged
as the most important predictor of
perceived service quality.
Majority of the customers expressed
their satisfaction with the overall
service they received from the hotel,
especially regarding Tangibility,
Responsiveness and Assurance. The
hotel had not fulfilled the customers’
satisfaction with regard to Reliability
and Empathy.
Room attractiveness and décor have
strongest affect perceptions of hotel
guests’ satisfaction, followed by Staff
outlook and accuracy, Reliability,
Hotel
surroundings
and
environmental factors, Food and
service related factors.
- Sample size: 410 international tourists
Juwaheer
&
Ross (2003)
Assessing customers’
expectations
and
perceptions of service
provided by hotels of
Mauritius
- Customized SERVQUAL with 39
attributes
- Sample size: 410 responses
75
Customers’ perception of service
quality in Mauritius hotel industry
fell short of their expectations, with
the “empathy” dimension having
largest gap.
www.ccsenet.org/ass
Asian Social Science
Vol. 11, No. 10; 2015
In 2003, another Lodging quality index (LQI) to assess customers’ perception of quality delivery was proposed
by J. M. Getty & R. L. Getty (2003). The study began with the same 10 original dimensions that were used to
develop SERVQUAL namely Tangibility, Reliability, Responsiveness, Competence, Courtesy, Credibility,
Security, Access, Communication, and Understanding with initial 63-item instrument to measure customers’
perception of delivered quality. After reliability and validity testing through empirical evidence, final lodging
quality index (LQI) comprised 26 items covering 5 dimensions namely Tangibility, Reliability (includes original
reliability and credibility dimensions), Responsiveness, Confidence (includes original competence, courtesy,
security, and access dimensions), and Communication (includes original communication and understanding
dimensions).
More significantly, Mei et al. in 1999 examined the dimensions of service quality in the hospitality industry and
proposed HOLSERV scale by extending the SERVQUAL scale to include 27 items with 8 new items. This study
tested the reliability and validity of HOLSERV and determined which dimension is the best predictor of overall
service quality. Key findings of the study are that service quality is represented by three dimensions in the
hospitality industry, relating to employees (behavior and appearance), tangibles and reliability, and the best
predictor of overall service quality is the dimensions referred to “employees”.
Customer satisfaction has become a vital concern for companies and organizations in their efforts to improve
product and service quality, and maintain customer loyalty within a highly competitive marketplace (Awwad,
2012). Through previous three decades, a number of customer satisfaction indicators have been developed and
applied across different countries. The first national customer satisfaction index was introduced in 1989 namely
Swedish customer satisfaction barometer (SCSB) by Claes Fornell (1992). In 1996, Fornell developed the
American Customer Satisfaction Index (ACSI) (Fornell, 1996) based on SCSB which then has been become
increasingly well-adopted scale in many countries. Moreover, the European Customer Satisfaction Index (ECSI)
was established and introduced in 11 European countries (Turkyılmaz, 2007). In these scales, customer
satisfaction items were identified based on the popular view point about customer satisfaction stated that
satisfaction is associated with performance that fulfills (equal to or above) expectations (Heung, 2000). In other
word, customer satisfaction items will measure whether or not the quality of a service meets a customer’s
expectations.
LODGSERV (Knutson et al., 1990), LQI (J. M. Getty & R. L. Getty, 2003), and HOLSERV (Mei et al., 1999)
are all developed on the basis of SERVQUAL scale to measure service quality in the lodging, hospitality industry.
Moreover, there have been numerous empirical studies supporting for the validity of the SERVQUAl model in
the hotel service industry (Wilkins et al., 2007; Ladhari, 2009). These study adapted SERVQUAL scale with
some modifications to measure hotel service quality such as Tsang and Qu (2000), Al Khattab & Aldehayyat
(2011), Boonitt & Rompho (2012), Karunaratne & Jayawardena (2010), Juwaheer & Ross (2003). Moreover,
there are studies which not only apply SERVQUAL to measure hotel service quality, but also use this
measurement to investigate the impact of service quality on customer satisfaction such as Hossain (2012),
Markovic & Raspor (2010), Juwaheer (2004).
In Vietnam, there are a few studies investigating the linkage between service quality and customer satisfaction in
Vietnamese tourism industry such as Analyzing factors that affect tourists’ satisfaction with service quality by Vu
(2012), Examining domestic tourists’ satisfaction with tourism service by Dinh et al., (2011). However, these
studies focus on several specific regions and need more intensive studies.
To address this need, the study, based on SERVQUAL model with some customizations, aims to empirically
examine the relationship between service quality and customer satisfaction in Vietnamese hotels.
3. Analytical Framework
SERVQUAL scale (Parasuraman et al., 1988) is one of the most widely used instruments to measure service
quality in various service fields including hotel business (Hossain, 2012; Boonitt & Rompho, 2012; Al Khattab
& Aldehayyat, 2011). This study adopted SERVQUAL scale with some customizations to measure perceived
service quality as well as examine the relationship between service quality and customer satisfaction in
Vietnamese hotels.
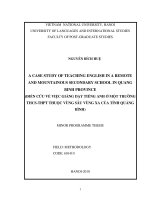
The analytical framework is proposed as following:
76
www.ccsenet.org/ass
Asian Social Science
Vol. 11, No. 10; 2015
Hotel service quality
H1
Tangible
H2
Reliability
H3
Customer satisfaction
Responsiveness
H4
Assurance
H5
Empathy
Figure 1. Analytical framework
This scale measures hotel service quality through five distinct dimensions namely Tangible, Reliability,
Responsiveness, Assurance, and Empathy. These dimensions have been also extensively accepted and applied by
many academics and practicing managers in various industries.
- Tangible: the appearance of hotel and hotel staff, physical facilities at hotel/rooms, visual materials for
customers.
- Reliability: hotel’s ability to perform services accurately and on time right at the first time.
- Responsiveness: hotel’s willingness and flexible to serve and help customers.
- Assurance: hotel’s ability to build trust in customers about hotel services, hotel staff’s knowledge and skills.
- Empathy: hotel’s attentions and cares to each individual customer.
Service quality measures how well the delivered service could match customer’s expectations while delivery
service quality refers to meeting and satisfying customer’s expectation consistently and positively (Parasuraman
et al., 1985). Based on literature, several empirical studies found the linkage between customer satisfaction with
Tangible (Al Khattab & Aldehayyat, 2011), Empathy (Hossain, 2012; Al Khattab & Aldehayyat, 2011),
Responsiveness (Karunaratne & Jayawardena, 2010), Relibility (Markovic & Raspor, 2010). The main target of
this study is to investigate the relationship between service quality and customer satisfaction. Therefore, we
proposed five hypotheses for this research model as followed:
- H1: Tangible component of service quality has positive impact on customer satisfaction;
- H2: Reliability component of service quality has positive impact on customer satisfaction;
- H3: Responsiveness component of service quality has positive impact on customer satisfaction;
- H4: Assurance component of service quality has positive impact on customer satisfaction;
- H5: Empathy component of service quality has positive impact on customer satisfaction.
After reviewing literature to model the analytical framework, a questionnaire was developed as an adapted
version of SERVQUAL (Parasuraman et al., 1988), and referenced to LODGSERV (Knutson et al., 1990), LQI (J.
M. Getty & R. L. Getty, 2003), and HOLSERV (Mei et al., 1999). The questionnaire was first developed in
English, and then translated into Vietnamese to be conveniently used in wide survey.
The original questionnaire for this study comprised 30 question items on service quality and customer
satisfaction. Then, a pilot testing with a convenient sample of 36 MBA students was conducted to get feedbacks
on how easy to answer the questionnaire. Together with in-depth interviews with academics and practitioners in
quality management and hotel operation fields, a more comprehensive questionnaire version was completed by
adding 3 new question items and rejecting 10 unclear question items.
77
www.ccsenet.org/ass
Asian Social Science
Vol. 11, No. 10; 2015
The questionnaire was divided into 3 parts. The first part contained questions relating to socio-demographic data
about respondents. The second part was designed to measure respondents’ perception about service quality
offered by hotels. The remaining part assessed respondents’ perception regarding to their satisfaction about hotel
services. This measurement bases on a five-point Likert scale (1 = strongly disagree, 3 = neither agree nor
disagree, 5 = strongly agree). The survey respondent is a mixed sample of individual and group visitors who
stayed at least one night at examined hotel in the period from May 2013 to June 2013.
Data collected will firstly be tested the scale reliability and validity. Then, regression analysis will be taken to
test the relationship between service quality and customer satisfaction of three-star hotels in Da Nang.
4. Data Collection and Measurement Test
4.1 Data Collection
Data in this research were acquired from guests of 33 three-star hotels in Da Nang city, one of the most favorite
places for tourists in Vietnam, an emerging city which has the highest developing speed and be ranked as the
most competitive region in Vietnam (CBRE, 2011). Moreover, this destination is more well-known and attractive
by hosting many famous events such as International Fireworks Competition, International Marathon
Competition, Miss Vietnam, and Culture Festivals. According to the statistics from Da Nang Culture, Sports and
Tourism Department, Da Nang welcomed 2.65 million arrivals including 2.02 million Vietnamese visitors and
0.63 million foreign visitors in 2012 which increase by 12% compared to 2011.
Huge contributions of three-star hotel, four-star hotel and five-star hotel classes for the economic growth in this
region have been taken under high consideration by many economists and researchers (Da Nang Culture, Sports
and Tourism Department, 2012). According to statistics from CBRE market review 2012, three-star hotels in Da
Nang present a largest serving capacity with 33 hotels and 1.984 rooms, followed by 8 five-star hotels with 1.649
rooms, and 3 four-star hotels with 563 rooms (CBRE, 2012). Statistics for three-star hotels in this region provide
evidence for the highest occupancy rate of 66.4% in 2011 (Thornton, 2012). However, three-star hotels are the
middle class hotels with limited investment and attention to service quality. Besides, literature reviewing in
Vietnam shows that there was not official research addressing quality aspects in Vietnamese three-star hotels
despite high necessity of this research topic in the national context in recent years.
Among 500 questionnaires provided to customers, 447 responses were collected. After inputting data and
screening questionnaires, 15 missing responses were rejected from the data set and the remaining 432 valid
responses have been used to analyze by SPSS 20.0. The sample data indicates that the majority respondent group
(88.2%) is the young tourist with the range of age between 20 to 30 years old. In addition, 89.6% of respondents
staying at three-star hotels in Da Nang with the purpose of travelling while just 8.6% of them staying there with
business trip purpose. Over 50% of respondents has a rather high income per month with about 300USD to
600USD. The percentage of guests with income under 300USD or ranging from 600USD to 1000USD is much
smaller with 25.9% and 17.6%, respectively.
Table 2. Demographic profiles of respondents
Age
Under 20
20-30
31-40
Over 40
N/A
%
3.7
88.2
6.2
1.6
0.2
Purpose
Travelling
Business trip
Other purpose
%
89.6
8.6
1.9
Income per month
Under 300USD
300-600USD
600-1000USD
Over 1000USD
%
25.9
51.6
17.6
4.9
4.2 Measurement Test
The first step of measurement testing process is reliability test. One method to measuring reliability is through
internal consistency which refers to the degree of inter-correlation among items that comprise the measure or
summated scale (Flynn et al., 1990). The most widely accepted measure of internal consistency is Cronbach’s
alpha which is the average of the correlation coefficient of each item with each other item (Cronbach & Meehl,
1955). In this study, calculated Cronbach’s alpha values for all scale exceeds the minimum acceptable alpha
value of 0.60 (Nunnally, 1978; Phan & Matsui, 2012). Most of the scales have alpha value greater than 0.70
indicating that the scales are internally consistent.
78
www.ccsenet.org/ass
Asian Social Science
Vol. 11, No. 10; 2015
Table 3. Reliability test
Measurement constructs
Tangible
Reliability
Responsiveness
Assurance
Empathy
Number of items
6
4
3
4
4
Cronbach’s Alpha
0.93
0.85
0.67
0.83
0.86
Mean
3.58
3.69
3.73
3.79
3.69
Standard deviation
0.86
0.77
0.74
0.79
0.79
Table 4. Contents of questionnaire survey
Code
T
T1
Attributes
TANGIBLE
Convenient location
T2
Comfortable facilities and equipment
T3
Appealing decoration
T4
Neat appearance staff
T5
T6
R
R1
Visually presented brochures and directories
Appropriate environment for taking a rest
RELIABILITY
Performs service accurately
R2
Provides service on time
R3
R4
S
Solves problem sincerely
Keeps confidential records
RESPONSIVENESS
S1
Willingness to serve guests
S2
Availability to respond to guests’ requests
S3
A
Flexibility according to guests’ demands
ASSURANCE
A1
Guests feel safe and secure in their stay
HOLSERV (Mei et al., 1999), LQI (J. M. Getty & R. L.
Getty, 2003)
A2
Staff with knowledge to provide guests
information about surrounding areas
(shopping, museum, place of interest…)
Customized from LQI (J. M. Getty & R. L. Getty, 2003)
A3
Staff with occupational skills
A4
Staff are courteous and polite
E
EMPATHY
E1
Provides guests individual attention
E2
Understands guest specific needs
E3
E4
Positive attitude when recieve feedback
from guests
Healthful menu
References/Origin
New
SERVQUAL (Parasuraman et al., 1988), LODGSERV
(Knutson et al., 1990), HOLSERV (Mei et al., 1999), LQI
(J. M. Getty & R. L. Getty, 2003)
LODGSERV (Knutson et al., 1990)
SERVQUAL (Parasuraman et al., 1988), LQI (J. M. Getty
& R. L. Getty, 2003)
Customized from HOLSERV (Mei et al., 1999)
Customized from LODGSERV (Knutson et al., 1990)
HOLSERV (Mei et al., 1999)
SERVQUAL (Parasuraman et al., 1988), LODGSERV
(Knutson et al., 1990), HOLSERV (Mei et al., 1999)
SERVQUAL (Parasuraman et al., 1988),
New
SERVQUAL (Parasuraman et al., 1988), HOLSERV (Mei
et al., 1999), LQI (J. M. Getty & R. L. Getty, 2003)
SERVQUAL (Parasuraman et al., 1988), HOLSERV (Mei
et al., 1999), LQI (J. M. Getty & R. L. Getty, 2003)
Customized from LODGSERV (Knutson et al., 1990)
Customized from HOLSERV (Mei et al., 1999) and
LODGSERV (Knutson et al., 1990)
SERVQUAL (Parasuraman et al., 1988), HOLSERV (Mei
et al., 1999), LQI (J. M. Getty & R. L. Getty, 2003)
SERVQUAL (Parasuraman et al., 1988), HOLSERV (Mei
et al., 1999)
SERVQUAL (Parasuraman et al., 1988), HOLSERV (Mei
et al., 1999)
New
LODGSERV (Knutson et al., 1990)
79
www.ccsenet.org/ass
Asian Social Science
Vol. 11, No. 10; 2015
The next step of measurement testing process is validity test to measure whether the item or scale truly measures
what it is supposed to measure and whether it measures nothing else. Validity test will be taken with content
validity and construct validity test.
Content validity of the questionnaire is confirmed by intensive literature reviewing and by opinions from experts
and operators in hotel industry. The main valuable references to construct question items for this study are
SERVQUAL (Parasuraman et al., 1988) - a multiple-item scale for measuring consumer perceptions of service
quality, LODGSERV (Knutson et al., 1990) - a service quality index for the lodging industry, LQI (J. M. Getty &
R. L. Getty, 2003) - lodging quality index to assess customers’ perceptions of quality delivery, and HOLSERV
(Mei et al., 1999) - a service quality measurement scale for the hospitality industry. Moreover, many empirical
studies have applied the above scales to measure service quality in hotels such as Tsang & Qu (2000), Al Khattab
& Aldehayyat (2011), Boonitt & Rompho (2012), Karunaratne & Jayawardena (2010), Juwaheer & Ross (2003)
are also valuable references for this study.
Construct validity is tested through factor analysis to ensure that the scale is an appropriate operational definition
of an abstract variable (Flynn et al., 1990). In this study, factor analysis is conducted with 5 summated scales Tangible, Reliability, Responsiveness, Assurance, and Empathy - simultaneously. In KMO and Bartlett's Test,
KMO value measuring the sampling adequacy equals to 0.840 (greater than 0.5) with significant value is 0.000.
These numbers confirm the validity of data for exploratory factor analysis. By Principal Component Analysis
and Varimax with Kaiser Normalization rotation method, 5 components are extracted with greater than 1
eigenvalues. The cumulative of variance is 75.75% which means that these 5 components explain 75.75% of
service quality variance. Factor loadings of all service quality items which indicate correlation between the
variables and the factor are greater than 0.5. These results would confirm that data are valid and could be use for
further analysis.
Table 5. Results of factor analysis
T1
T2
T3
T4
T5
T6
R1
R2
R3
R4
S1
S2
S3
A1
A3
A4
A5
E1
E2
E3
E4
Eigenvalues
% of Variance
Cumulative Variance
Component
1
0.811
0.740
0.679
0.862
0.860
0.762
2
3
4
5
0.782
0.648
0.569
0.581
0.846
0.734
0.557
9.501
45.242
45.242
0.783
0.747
0.798
0.849
2.085
9.930
55.172
80
1.911
9.098
64.27
0.683
0.763
0.728
0.605
0.501
1.399
6.663
70.933
1.012
4.821
75.754
www.ccsenet.org/ass
Asian Social Science
Vol. 11, No. 10; 2015
5. Data Analysis
Regression analysis is conducted to examine the relationship between hotel service quality and customer
satisfaction and to test the hypotheses as set in the above section. A multiple regression model is constructed with
customer satisfaction as the dependent variable and Tangible, Reliability, Responsiveness, Assurance, and
Empathy as the independent variables.
Prior to regression analysis, correlation analysis is conducted and the results are presented in Table 6. We found
the significant correlation between the customer satisfaction and all of 5 service quality dimensions. In addition,
we found also the high correlation coefficients between service quality dimensions. Therefore, the Variance
Inflation Factor (VIF) that measures the inflation in parameter estimate due to the collinearities among
independent variables is calculated for the regression model. The value of VIF for each variable is presented in
Table 7. By setting the acceptable value for VIF at 4 as suggested in the literature, it is found that model
variables are within the VIF limit indicating that their multi-collinearities do not have an undue influence on
least squares estimates. As the result, all the variables are retained in the model for further analysis.
Table 6. Correlation analysis
T
T
Pearson Correlation Sig. (2-tailed)
R
Pearson Correlation Sig. (2-tailed)
A
Pearson Correlation Sig. (2-tailed)
S
Pearson Correlation Sig. (2-tailed)
E
Pearson Correlation Sig. (2-tailed)
CE
Pearson Correlation Sig. (2-tailed)
1.000
R
.595
0.000
1.000
A
.485
0.000
.567
0.000
1.000
S
.440
0.000
.443
0.000
.615
0.000
1.000
E
.467
0.000
.533
0.000
.453
0.000
.403
0.000
1.000
CS
.479
0.000
.538
0.000
.525
0.000
.501
0.000
.632
0.000
1.000
Table 7. Regression analysis
R
R square
Sig.
(Constant)
T
R
S
A
E
0.716
0.512
0.000
B
t
Sig.
0.561
0.070
0.131
0.174
0.121
0.382
3.501
1.766
2.764
3.835
2.656
9.520
0.001
0.078
0.006
0.000
0.008
0.000
Collinearity Statistics
Tolerance
VIF
0.582
0.502
0.586
0.500
0.652
1.717
1.990
1.705
1.999
1.533
If we take the value of R2 to be the explanation power of regression model, these 5 service quality variables can
clearly explain 51.2% of the variation of the customer satisfaction. Considering the beta coefficient of each
independent variable and its significant level, we found that 4 intangible components of service quality including
Reliability, Responsiveness, Assurance, and Empathy show the significant impact on Customer satisfaction (at
the 5% significant level). Among them, Empathy expresses the strongest impact on Customer satisfaction with
highest coefficient value of 0.382. Reliability, Responsiveness and Assurance represent the relative smaller
impacts with coefficient values of 0.131, 0.174, and 0.121, respectively. Tangible component, however, is the
only independent variable which does not indicate the significant impact on customer satisfaction at the 5%
level.
81
www.ccsenet.org/ass
Asian Social Science
Vol. 11, No. 10; 2015
Table 8. The results of hypotheses testing
Hypotheses
H1: Tangible component of service quality has positive impact on customer satisfaction
H2: Reliability component of service quality has positive impact on customer satisfaction
H3: Responsiveness component of service quality has positive impact on customer satisfaction
H4: Assurance component of service quality has positive impact on customer satisfaction
H5: Empathy component of service quality has positive impact on customer satisfaction
Result
Not
supported
Supported
Supported
Supported
Supported
The regression results would support hypotheses related with Reliability, Responsiveness, Assurance, and
Empathy while would not support hypothesis related to Tangible dimension.
6. Discussions and Implications
This study adopted SERVQUAL approach to measure perceived service quality and its impact on customer
satisfaction in Vietnamese hotels. A framework with comprehensive questionnaire consists of 21 question items.
The research results demonstrate that the service quality is a strong driver for customer satisfaction in hotel
service in Vietnam. Among 5 quality dimensions, 4 intangible ones represent the significant impacts on the
customer satisfaction whereas tangible is the only one does not reveal this clear impact. A similar conclusion is
that the tourists would evaluate the importance of intangible elements of service quality higher than the tangible
elements can be found in the research on service quality in UK holiday market by Ekinci et al. (2003).
Data analysis result stresses the most significant impact of Empathy on Customer satisfaction. Empathy refers to
providing customers individual attention, understanding customer specific needs, having positive attitude when
recieve feedback from customers, and providing healthful menu. That means the hotels can considerably increase
their customer satisfaction level if they may better perform their empathy. This result was supported by the
research in Bangladesh’s tourism industry of Hossain (2012) which applied SERVQUAL scale to measure
service quality and examine the impact of these service quality dimensions on customer satisfaction. This
research result stressed Empathy with strongest impact on customer satisfaction.
Together with Empathy, three remaining intangible quality dimensions namely Responsiveness, Reliability, and
Assurance express positively significant influence on Customer satisfaction. Among these three dimensions,
Responsiveness which refer to the willingness to serve customers, availability to respond to customers’ requests
and flexibility to meet customers’ demands has the strongest impact on customer satisfaction. Reliability
contains attributes relating to performing services on time and accurately, solving problem sincerely, and keeping
records confidentially is the next strong impact dimension; followed by Assurance which regards to customers’
feeling safe and secure, staff’s knowledge of surrounding areas, staff’s occupational skills and staff’s courteous
attitude. This finding is highlighted in the research by Hossain (2012). Besides, Knutson et al. (1990) also
supported for this finding by pointing out consumers’ consistently high expectations for Reliability and
Assurance dimensions which refer to consistent and on time services, quickly corrected problems, trained
employees, knowledgeable staff, and customers’ comfortable feelings. Moreover, Mei et al. (1999) obtained
similar results of reflecting important influence from Employee dimensions which relating to prompt service,
willingness to help, confident in the delivery of service, polite, knowledgeable, skillful, caring, understanding,
sincere, neat and professional employees, and Reliability dimensions which referring to keeping promises,
accurate and timely service, safe and secure stay. Furthermore, in the research on international tourists’
perceptions of hotel operations in Mauritius by Juwaheer (2004), the research result also illustrated reliability
factor, staff outlook and accuracy as important service dimensions affecting hotel customers’ satisfaction.
The important role of 4 intangible quality dimensions implies suggestions for hoteliers to strongly focus on
improving these quality dimensions to better gain customer satisfaction. It can be seen that these quality
dimensions mostly rely on hotel staff’s knowledge and attitude. One concerning suggestions for hoteliers is that
they should appropriately allocate resources to provide training for hotel staff. As a result, hotel staff will be
more confident with occupational skills and knowledge to serve and help customers.
Different from the four intangible quality dimension, Tangible represent a non-significant impact on the
customer satisfaction although it also has positive correlation with customer satisfaction. It may be explained
that hotels in Da Nang are mostly constructed in some recent years with quite new facilities and equipments so
that customers do not regard this dimension as a differentiation factor among different hotels when they make
82
www.ccsenet.org/ass
Asian Social Science
Vol. 11, No. 10; 2015
decision. However, many previous studies found Tangible as one of significant factors affecting customer
satisfaction such as Hossain (2012), Mei et al. (1999), and Juwaheer (2004). Especially, Juwaheer (2004)
indicated that Room attractiveness and décor is the most significant factor affecting customer satisfaction.
Therefore, hoteliers also should not ignore this dimension in their operations.
One limitation of this study is that the survey was conducted with guests of three-star hotels in Da Nang city.
Moreover, time period to collected data were mostly in two months of tourism season - May and June 2013, with
limited valid responses of 432 ones. Thus, some conclusions may be improved in other more extensive studies.
Despite these limitations, the study contributes to enrich the literature of service quality and customer
satisfaction from a customer perspective. It enhances understanding of service quality and its impacts on
customer satisfaction in Vietnamese hotels. The findings and implications will benefit hoteliers working in
Vietnam who want to increase competitive advantage through quality dimensions.
In further research, this empirical evidence may be improved and better represent for hotel industry in any
regions in Vietnam or even in the whole Vietnam with larger sample and during-year data collection. Besides,
further research may deeply examine whether items used in this study are suitable to measure service quality in
hotels at other classes such as four-star hotels, five-star hotels. Additionally, different demographic variables may
be taken under the consideration as controlling variables to discuss the different impacts of service quality on
customer satisfaction among different sample groups.
7. Conclusions
This study adopted SERVQUAL to empirically investigate the impact of service quality components on
customer satisfaction in Vietnamese hotel business. Data were collected from an extensive survey with
customers from 33 three-star hotels in Vietnam. Analysis results indicated that the strong relationship between
service quality dimensions and customer satisfaction. Beside the importance of image, advertising, and
promotion factor, service quality plays an important role as a driver for higher customer satisfaction level in
service enterprises.
Four intangible components namely Empathy, Reliability, Responsiveness, and Assurance stress statistically
significant impacts on customer satisfaction with significant level at 5%. Empathy illustrates strongest impact on
customer satisfaction with the highest beta coefficient value, followed by Responsiveness, Reliability, and
Assurance, respectively. Tangible, however, is the only factor that does not reveal a statistical impact on
customer satisfaction. This result indicates that service quality confirms its role as an important driver of
customer satisfaction which leads to customer loyalty and the hotels’ profits. Therefore, service quality should be
taken into high consideration in both academic and practical activities.
References
Al Khattab, S. A., & Aldehayyat, J. S. (2011). Perceptions of Service Quality in Jordanian Hotels. International
Journal of Business and Management, 6(7), 226-233. />Association of Southeast Asian Nations. (2014). Tourists arrivals in ASEAN by selected partner country/region.
ASIAN Statistics. Retrieved from />Awwad, M. S. (2012). An application of the American Customer Satisfaction Index (ACSI) in the Jordanian
mobile phone sector. The TQM Journal, 24(6), 529-541. />Boonitt, S., & Rompho, N. (2012). Measuring Service Quality Dimensions: An Empirical Analysis of Thai Hotel
Industry. International Journal of Business Administration, 3(5), 52-63. />v3n5p52
Brogowicz, A. A., Delene, L. M., & Lyth, D. M. (1990). A synthesised service quality model with managerial
implications. International Journal of Service Industry Management, 1(1), 27-44. />09564239010001640
CBRE. (2011). MarketView Da Nang. CB Richard Ellis Vietnam.
CBRE. (2012). MarketView Da Nang. CB Richard Ellis Vietnam.
Cronbach, L. J., & Meehl, P. E. (1955). Construct validity in Psychological Tests. Psychological Bulletin, 52,
281-302. />Cronin, J. J., & Taylor, S. A. (1992). Measuring service quality: A reexamination and extension. Journal of
Marketing, 56(3), 55-68. />Dabholkar, P. A., Shepherd, C. D., & Thorpe, D. I. (2000). A comprehensive framework for service quality: An
83
www.ccsenet.org/ass
Asian Social Science
Vol. 11, No. 10; 2015
investigation of critical conceptual and measurement issues through a longitudinal study. Journal of
Retailing, 76(2), 131-139. />Dinh, C. T., Pham, L. H. N., & Truong, Q. D. (2011). Đánh giá mức độ hài lòng của khách nội địa đối với du lịch
tỉnh Sóc Trăng. Tạp chí Khoa Học, 20(a), 199-209.
Ekinci, Y., Prokopaki, P., & Cobanoglu, C. (2003). Service quality in Cretan accommodations: Marketing
strategies for the UK holiday market. International Journal of Hospitality Management, 22(1), 47-66.
/>Flynn, B., Sakakibara, S., Schroeder, R., Bates, K., & Flynn, E. (1990). Empirical research methods in
operations management. Journal of Operations Management, 9(2), 250-284. />-6963(90)90098-X
Fornell, C. (1992). A national customer satisfaction barometer: The Swedish experience. Journal of Marketing,
56(1), 6-21. />Fornell, C., Johnson, M., Anderson, E., Cha, J., & Bryant, B. (1996). The American Customer Satisfaction Index:
Nature, purpose, and findings. Journal of Marketing, 60(4), 7-18. />Getty, J. M., & Getty, R. L. (2003). Lodging quality index (LQI): Assessing customers’ perceptions of quality
delivery. International Journal of Contemporary Hospitality Management, 15(2), 94-104. />10.1108/09596110310462940
Gronroos, C. (1984). A service quality model and its marketing implications. European Journal of Marketing,
18(4), 36-44. />Heung, V. C. S. (2000). Satisfaction levels of mainland Chinese travelers with Hong Kong hotel services.
International Journal of Contemporary Hospitality Management, 12(5), 308-315. />09596110010339689
Hossain, M. J. (2012). Impact of service quality on customer satisfaction: A case of tourism industry in
Bangladesh. International Journal of Research in Finance & Marketing, 2(2), 1-25.
Jain, S. K., & Gupta, G. (2004). Measuring Service Quality: SERVQUAL vs. SERVPERF Scales. Vikalpa, 29(2),
25-35.
Juwaheer, T. D. (2004). Exploring international tourists' perceptions of hotel operations by using a modified
SERVQUAL approach-a case study of Mauritius. Managing Service Quality, 14(5), 350-364. .
org/10.1108/09604520410557967
Juwaheer, T. D., & Ross, D. L. (2003). A study of hotel guest perceptions in Mauritius. International Journal of
Contemporary Hospitality Management, 15(2), 105-115. />Kandampully, J., & Suhartanto, D. (2000). Customer loyalty in the hotel industry: The role of customer
satisfaction and image. Managing Service Quality, 16(6), 346-351. />42559
Kang, G. D., & James, J. J. (2004). Service quality dimensions: An examination of Gro¨nroos’s service quality
model. Managing Service Quality, 14(4), 266-277. />Karunaratne, W. M. K. K., & Jayawardena, L. N. A. C. (2010). Assessment of Customer Satisfaction in a Five
Star Hotel-A Case Study. Tropical Agricultural Research, 21(3), 258-265.
Knutson, B., Stevens, P., Wullaert, C., Patton, M., & Yokoyama, F. (1990). Lodgserv: A Service Quality Index
for the Lodging Industry. Hospitality Research Journal, 14(2), 227-284.
Ladhari, R. (2009a). A review of twenty years of SERVQUAL research. International Journal of Quality and
Service Sciences, 1(2), 172-198. />Ladhari, R. (2009b). Service quality, emotional satisfaction, and behavioural intentions: A study in the hotel
industry. Managing Service Quality, 19(3), 308-331. />Markovic, S., & Raspor, S. (2010). Measuring Perceived Service Quality Using Servqual: A Case Study of the
Croatian Hotel Industry. Management, 5(3), 195-209.
Mei, A. W. O., Dean, A. M., & White, C. J. (1999). Analyzing service quality in the hospitality industry.
Managing Service Quality, 9(2), 136-143. />Nunnally, J. (1978). Psychometric theory. McGraw Hill, New York.
84
www.ccsenet.org/ass
Asian Social Science
Vol. 11, No. 10; 2015
Parasuraman, A., Zeithaml, V. A., & Berry, L. L. (1985). A conceptual model of service quality and its
implications for future research. Journal of Marketing, 49(Fall), 41-50. />Parasuraman, A., Zeithaml, V. A., & Berry, L. L. (1988). SERVQUAL: A multiple-item scale for measuring
consumer perceptions of service quality. Journal of Retailing, 64(Spring), 12-37.
Phan, C. A., & Matsui, Y. (2012). Contribution of total productive maintenance to quality performance:
Empirical evidence from Japanese manufacturing plants. The Journal of Japanese Operations Management
and Strategy, 3(1), 38-54.
Sureshchandar, G. S., Rajendran, C., & Anantharaman, R. N. (2002). Determinants of customer-perceived
service quality: A confirmatory factor analysis approach. Journal of Services Marketing, 16(1), 9-34.
/>Thornton, G. (2012). Report Overview-Vietnam Hotel Survey 2012. Grant Thornton Vietnam.
Tsang, N., & Qu, H. (2000). Service quality in China’s hotel industry: A perspective from tourists and hotel
managers. International Journal of Contemporary Hospitality Management, 12(5), 316-326. .
org/10.1108/09596110010339706
Türkyilmaz, A., & Özkan, C. (2007). Development of a customer satisfaction index model: An application to the
Turkish mobile phone sector. Industrial Management & Data Systems, 107(5), 672-687. />1108/02635570710750426
Vu, V. D. (2012). Khảo sát các nhân tố ảnh hưởng đến sự hài lòng của khách khi đến du lịch ở Bà Rịa- Vũng Tàu.
Tạp chí phát triển và hội nhập, 16(6), 26-32.
Wilkins, H., Merrilees, B., & Herington, C. (2007). Toward an understanding of total service quality in hotels.
International Journal of Hospitality Management, 26(4), 840-853. />07.006
Copyrights
Copyright for this article is retained by the author(s), with first publication rights granted to the journal.
This is an open-access article distributed under the terms and conditions of the Creative Commons Attribution
license ( />
85
View publication stats