2D Complex Shear Modulus Imaging in Gaussian Noise
Bạn đang xem bản rút gọn của tài liệu. Xem và tải ngay bản đầy đủ của tài liệu tại đây (596.03 KB, 4 trang )
2D Complex Shear Modulus Imaging in Gaussian Noise
Nguyen Thi Anh-Dao1,2, Tran Duc-Tan2, and Nguyen Linh-Trung2
2
1
University of Technology and Logistics, Bac Ninh, Vietnam
Electronics & Telecom., University of Engineering and Technology, Vietnam National University, Hanoi, Vietnam
Abstract— Dynamic shear-wave estimation of complex shear
modulus (CSM) has demonstrated the ability to detect tumors.
Ultrasound shear wave imaging is one of the methods for quantitatively estimating relevant elasticity parameters of tissues via the
wave number and propagation attenuation of ultrasound waves.
Maximum Likelihood Ensemble Filter (MLEF) has been efficiently applied for estimating the CSM parameters, but limited to
one-dimensional (1D) scenario. This paper extends this method to
detecting two-dimensional (2D) objects affected by Gaussian
noise during the Doppler acquisition. A ray scanning method is
used for modeling the propagation directions (lines) along each of
which the MLEF is used for estimating the CSM parameters.
The object 2D image is then reconstructed by transforming these
estimated CSM parameters from the polar coordinates to Cartesian coordinates. it is not necessary to increase the ensemble size
(which means an increase in the algorithm complexity) when the
noise level is low.
Keywords— Ultrasound shear wave imaging, maximum likelihood ensemble filter (MLEF), complex shear modulus
(CSM), elasticity imaging.
I. INTRODUCTION
Many pathological processes in tissues are recognized by
morphological changes that reflect alterations of mechanical
properties of soft tissues. Among various elasticity imaging
modalities, ultrasonic shear wave imaging technique has
been developed for estimating the complex shear modulus
(CSM) of biphasic hydro polymers including soft biological
tissues. Shear wave imaging has the potential to bridge molecular, cellular and tissue biology, and to support medical
diagnoses and patient treatment.
In 2004, Chen et al. found that the propagation speed of
shear waves is related to the frequency, the elasticity and
viscosity of the medium [1]. Hence, they proposed a method
to estimate shear elasticity and viscosity of a homogeneous
medium by measuring the shear wave speed dispersion. In
2009, Orescanin et al. applied the Kelvin–Voigt model to
estimate the CSM of the liver for shear wave frequencies
between 50 and 300 Hz [2]. Then, the Maximum Likelihood
Ensemble Filter (MLEF) was applied for CSM estimation
for homogeneous medium [3, 4]. It was extended to 1D heterogeneous medium in [5]. In this paper, we extended this
method to detecting two-dimensional objects1. In addition,
we study the effect of Gaussian noise corrupting the Doppler acquisition in conjunction with the effect of the ensemble size of the MLEF.
II.
MATERIALS AND METHODS
First, a needle vibrating with the frequency of (Hz) is
used for creating a shear wave whose velocities will then be
measured by a Doppler scanner [6]. Second, a ray scanning
method is used for modeling the propagation directions.
Denote
and
the shear wave attenuation coefficient and the wave number at the tracking location along
each ray; is defined in the polar coordinates as:
.
Third, the CSM of the tissue located at is then estimated
from
, which are the real and imaginary
and
parts of the CSM value, based on using the Kelvin-Voigt
model for a viscous medium [3]. Last, the 2D image of the
object is reconstructed by transforming these estimated
CSM parameters from the polar coordinates to Cartesian
coordinates.
A. Shear Wave Propagation
The needle vibrates along the vertical (z) axis. Under an
assumption of cylindrical shear wave propagation along the
radial axis, the particle velocity of ray is a spatio-temporal
function of the radial distance and time , and is given by
1
,
√
cos
,
1, … ,
(1)
where is number of ray, is the magnitude of the wave at
the source location,
is the angular shear frequency. In
discrete form, we have
1
cos
∆
,
(2)
where index denotes the discrete time, is the initial distance from the source, ∆ is discrete-time step and
represents the initial temporal phase.
Eq. (2) can be rewritten in a recursive form by:
1
Part of this study was presented in the 2013 International Conference on Green and Human Information Technology (ICGHIT
2013) as an in-progress work.
© Springer International Publishing Switzerland 2015
V. Van Toi and T.H. Lien Phuong (eds.), 5th International Conference on Biomedical Engineering in Vietnam,
IFMBE Proceedings 46, DOI: 10.1007/978-3-319-11776-8_94
385
386
N.T. Anh-Dao, T. Duc-Tan, and N. Linh-Trung
cos
1
sin
Δ
(3a)
1 Δ
sin
.
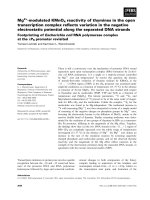
Fig. 1 Diagram of Kelvin-Voigt model
Given the effect of Gaussian noise
on the velocity
at each spatial location, we have the following model:
(3b)
:
.
B. Attenuation Coefficient and Wave Number Estimation
In this subsection, we apply the MLEF to estimate ks and
α in each ray. The state equation can be constructed from
Eq. (3a)as shown below:
,
(4)
, , , ,
, is a nonlinear function
where
modeling the spatial shear wave dynamics. The length of
vectors , and
equals to the number of spatial
locations. We can assume that would not be changed
as
during the time of the experiment; hence,
shown in Eq. (4).
By using the Doppler acquisition, the measurements of
velocities at every spatial locations are given by
0
,
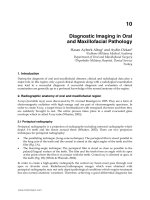
D. Detecting the Presence of 2 D Object
In this work, we verify the proposed method using a twoobject simulation scenario. Each object was ‘placed’ at a
. We use a “ray scanning”
certain spatial location
method to cover the area of interest, in steps of a constant
angle (see Fig. 2). The whole area is scanned by varying
from 0o to 90o in step of 1o, creating 90 rays of interest.
Given the availability of 43 elements in the in-use Doppler
scanner, we select 43 evenly-spaced spatial locations
along each ray. After collecting all information of these 90
rays, we estimated
and
. For a given CSM value
µ corresponding to a particular material of an object under
,
interest, we establish a detection threshold pair of
such that the object is detected to be present if the following
and
for all . In this paconditions:
per, the value of the threshold pair can be found empirically
via numerical simulation.
(5)
where is the measurement noise vector.
From Eqs. (4) and (5), the shear wave attenuation coefficient
and the wave number
of each ray are estimated by using MLEF according to the algorithm in [4].
C. CSM Estimation Using Kelvin-Voigt Rheological Model
We apply the Kelvin-Voigt model, as illustrated in Fig.1,
to estimate the CSM. For a viscous elastic medium, the
CSM is modeled by an elastic component
in parallel
with the dynamic viscous component as:
,
(6)
The complex wave number for a viscous medium is given by
/ .
Since
(7)
is complex, it can be written as
.,
From (7) and (8), by estimating
(8)
and α, we can obtain .
Fig. 2 Ray scanning illustration
III.
NUMERICAL RESULTS AND DISCUSSIONS
In this study, we examine the proposed method for detecting 2 circular objects whose elasticity properties are different
(i.e., the CSM values are different). Object 1 is placed at location (6 mm, 1.4 mm) with the radius of 1.4 mm. Object 2 is
placed at (10 mm, 8 mm) with the radius of 3 mm. The CSM
values of the two objects are (
900 Pa,
0.3 Pa/s) and
(
800 Pa, η 0.2 Pa/s) respectively. Accordingly, we
have (
67.5;
651.7) for Object 1 and (
54.3;
696) for Object 2. We asssum that the first spatial
location, , is close to the needle:
0.4 mm.
IFMBE Proceedings Vol. 46
2D Complex Shear Modulus Imaging in Gaussian Noise
387
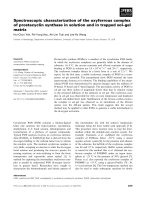
Fig. 10 provides an insight into the effect of the ensemble
size on the image reconstruction, measured by the peaksignal-to-noise ratio (PSNR), with respect to different noise
levels (SNR = 20 to 40 dB). It can be seen that at a highlevel of noise, a higher ensemble size offers a larger PSNR,
which means a better quality. However, it is not necessary
to increase the ensemble size (which means an increase in
the algorithm complexity) when the noise level is low.
900
80
850
k s (r) - Ray 4
60
α (r) - Ray 4
Base on empirical study, we found that the detection
50;
670)
threshold pair for Objects 1 and 2 are (
and and (
44;
710), respectively. The amplitude
and the phase are estimated using the first cycle of the
particle velocity at . These parameters are then used for
calculating the initial state vector of the MLEF. The initial
error square-root covariance matrix is Gaussianly randomly
generated. After only tens of iterations, the velocity is
denoised and the attenuation and wave number are
estimated. Based on the results obtained from the MLEF,
we apply Kelvin – Voigt rheological model to estimate
CSM. Finally, we construct the 2D image. The 2D image in
Cartesian coordinates of the simulation scenario is shown in
Fig. 3.
40
800
750
700
20
650
0
0
10
20
30
Space Steps (r)
600
40
0
10
20
30
Space Steps (r)
(a)
40
(b)
900
80
850
Fig. 3 Original image.
k s (r) - Ray 45
α (r) - Ray 45
60
40
800
750
700
20
650
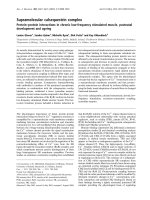
A. In Noise-Free Environment
0
from rays 4
Fig. 4 shows the estimated
and
and 45, which are chosenly specifically so that ray 4 passes
Object 1 and ray 45 passes Object 2, with no noise effect in
the Doppler acquisition. The solid curves are the estimated
attenuation and wave number, and the dashed curves are
ideal ones. It is show that Object 1 is detected to be present
in the interval of
11, 16 and Object 2 in that of
18, 30 . In this study, the MLEF ensemble size is
86, which is equal to twice the number of elements of
the Doppler scanner.
Then, the 2D reconstructed image and their 2D images of
attenuation and wave number are shown in Fig. 5. It is
obvious that the objects were detected. However, it can be
seen that the wave number was better estimated then the
attenuation.
0
10
20
30
Space Steps (r)
0
10
20
30
Space Steps (r)
(c)
Fig. 4
40
(d)
and
along ray 4 (top) and ray 45 (bottom);
(a)
86.
(c)
(b)
Fig. 5 Reconstructed image (a), Attenuation (b) Wave number (c) images
with ensemble size of
IV.
B. In Gaussian Environment
Figures 6 to 9 illustrate the effect of Gaussian noise and
the MLEF ensemble size on the reconstructed images and
their corresponding images of attenuation and wave number, tested for the signal-to-noise ratio (SNR) of 40 and
34 dB and the ensemble size of 43 and 86. With a large value of the ensemble size (
86), we were able to detect the
objects when the Doppler acquisition was corrupted by the
noise.
600
40
86.
CONCLUSIONS
Based on the MLEF approach, this paper has proposed a
ray-tracing based method to estimate the elasticity properties of 2D objects in shear wave imaging. The experiment is
quite simple when only a single vibration frequency is
needed to accurately estimate the CSM in the medium.
Quantitative analysis for different levels of Gaussian noise
affecting the Doppler acquisition, the ensemble size were
studied. In future work, it is desirable to examine further
IFMBE Proceedings Vol. 46
388
N.T. Anh-Dao, T. Duc-Tan, and N. Linh-Trung
thoroughly the optimal imaging thresholds pair,
,
,
used for detecting the objects under various practical CSM
values. In addition, better estimation of the attenuation
should be investigated.
11
Ensemble size of s = 43
Ensemble size of s = 86
10
9
8
PSNR
7
6
5
4
3
2
1
20
(a)
(b)
25
(c)
Fig. 6 Reconstructed (a), Attenuation (b), and Wave number images with
30
SNR (dB)
35
40
Fig. 10 Effects of noise and ensemble size.
43, SNR = 40 dB. The obtained PSNR = 10.4.
REFERENCES
(a)
(c)
(b)
Fig. 7 Reconstructed (a), Shear attenuation (b), and Wave number images
with
(a)
86, SNR = 40dB. The obtained PSNR = 10.31.
(b)
(c)
Fig. 8 Reconstructed (a), Shear attenuation (b), and Wave number images
with
(a)
43, SNR = 34 dB. The obtained PSNR = 6.58.
(b)
1. Chen, S et al.: Quantifying elasticity and viscosity from measurement
of shear wave speed dispersion. Journal of Acoustic Soc Am. 115,
2781-2785 (2004).
2. Marko Orescanin, et al.: Complex Shear Modulus of ThermallyDamaged Liver, pp127 – 130.Ultrasonics Symposium (IUS), 2009
IEEE International.
3. Orescanin, M. et al.: Model-based complex shear modulus reconstruction: A Bayesian approach. In: IEEE Int'l Ultrasonics Symposium, pp.
61-64. IEEE Press (2010).
4. Zupanski, M.: Maximum Likelihood Ensemble Filter: Theoretical Aspects. Monthly Weather Review. 133, 1710-1726 (2005).
5. Tan Tran-Duc, et al.: Complex shear modulus estimation using the
maximum likelihood ensemble filter, BME’04, 2012.
6. Orescanin et al.: Shear Modulus Estimation With Vibrating With
Needle Stimulation. IEEE Trans. Ultrasonics, Ferroelectrics, and Frequency Control. 57, 1358-1367 (2010).
Author:
Institute:
Street:
City:
Country:
Email:
Nguyen Thi Anh-Dao
University of Technology and Logistics
Ho town, Thuan Thanh district
Bac Ninh
Viet Nam
(c)
Fig. 9 (a) Reconstructed (a), Shear attenuation (b), and Wave number
images with
86, SNR = 34 dB. The obtained PSNR = 8.46.
IFMBE Proceedings Vol. 46