DSpace at VNU: Analysis of sediment distribution and transport for mitigation of sand deposition hazard in Tam Quan estuary, Vietnam
Bạn đang xem bản rút gọn của tài liệu. Xem và tải ngay bản đầy đủ của tài liệu tại đây (4.67 MB, 13 trang )
Environ Earth Sci (2016) 75:741
DOI 10.1007/s12665-016-5560-2
ORIGINAL ARTICLE
Analysis of sediment distribution and transport for mitigation
of sand deposition hazard in Tam Quan estuary, Vietnam
Do Minh Duc1 • Dinh Xuan Thanh1 • Dinh Thi Quynh1 • Patrick McLaren2
Received: 3 November 2015 / Accepted: 11 March 2016
Ó Springer-Verlag Berlin Heidelberg 2016
Abstract Tam Quan estuary in the Binh Dinh Province of
Vietnam provides shelter for about 2000 boats. Recently,
erosion and accretion associated with the mouth of the
estuary have badly affected marine transportation and
economic development. An 850-m-long jetty was constructed to mitigate the hazard. However, sand deposition
still continues to be an ongoing problem. This paper aimed
to assess the reasons for sand deposition in the estuary
based on sediment distributions and transport pathways.
Following an investigation of topography, geological and
hydrodynamic conditions, and sediment characteristics, an
analysis of sediment transport trends was undertaken.
Results show that medium sand is distributed along the
coast from the shoreline to 2.5 m water depth. Fine sands
are found in deeper areas of 10–13 m where there are also
medium sand deposits thought to be of ancient origin. Sand
deposition has intensively occurred in the estuary due to a
dominant north-to-south longshore sediment transport
regime. Sediment from this regime is presently trapped by
the jetty and deposited in the navigation channel. As a
solution, it is suggested that a properly designed jetty
stemming from the headland on the north side of the
estuary could effectively control the patterns of sediment
transport enabling the sand to bypass the entrance, thereby
avoiding entrapment inside its mouth.
& Do Minh Duc
1
Faculty of Geology, VNU University of Science, Vietnam
National University, Hanoi, 334 Nguyen Trai, Thanh Xuan,
Hanoi, Vietnam
2
SedTrend Analysis Limited, 7236 Peden Lane,
Brentwood Bay, BC V8M1C5, Canada
Keywords Estuary Á Sediment Á Sand deposition Á
Navigation channel Á Sediment trend analysis
Introduction
There has been extensive research worldwide on sediment
distribution and transport in estuaries. However, much of
this work has focused on coastal plain estuaries. Information on confined estuaries with steep slopes and floored by
sand- and gravel-sized sediments is rather limited (Portela
2008). Moreover, morphologic changes in estuaries are
occurring more seriously due to human and climate change
impacts (Duc et al. 2012; Zhang et al. 2014; Chalov et al.
2015; He et al. 2015) which may lead to deposition and/or
erosion hazards.
An early recognition of grain-size trends and sediment
transport (McCave 1978) showed how grain size along a
beach can coarsen in the direction of net wave-driven
transport. The cause was ascribed to progressive winnowing out of the finer fraction and its dispersal offshore by
tidal currents. Other situations without strong tidal currents
may allow the winnowed fines to be reintroduced to the
beach further down drift and yield a fining trend. The
concepts to predict the relative changes that will occur in
particle size distributions of sediments through erosion,
transport, and deposition were first presented in McLaren
(1981) followed by a more complete mathematical theory
(McLaren and Bowles 1985). On the basis of their theory,
several methods to carry out sediment trend analysis (STA)
have been developed. The McLaren and Bowles approach
is one dimensional, whereby the changes in grain-size
distributions along individual sample sequences are tested
for validity with the Z score statistic to determine the
preferred transport direction. However, following
123
741
Page 2 of 13
numerous testing of individual sample lines, a two
dimensional transport pattern is achieved. A practical
assessment of this approach is discussed in Hughes (2005).
Gao and Collins (1991, 1992) and Gao (1996) proposed a
two-dimensional vector approach to determine trends,
some elements of which were revised by Chang et al.
(2001). A different vector approach altogether was produced by Le Roux (1994) and Le Roux et al. (2002). A
summary of the various techniques is provided in Rios
et al. (2003) and Poizot et al. (2008).
The STA technique has still several uncertainties associated with the methodology including transport model
assumptions, sample spacing, bias of the mean, variance
and skewness of grain sizes in the log-normal distribution,
random environmental and measurement uncertainties. A
number of authors found their results to agree, either in
whole or in part, with a variety of other evidence including
direct measurements of processes, observations of bedform orientations and application of numerical modelling
(Livingstone 1989; Lanckneus et al. 1992; Van de Kreeke
and Robaczewska 1993; Gao and Collins 1994; Gao et al.
1994; Aldridge 1997; Bergemann et al. 1998; Van Der Wal
2000; Mallet et al. 2000; Duck et al. 2001). However, some
authors found no agreement between the STA and outside
evidence (Flemming 1988; Masselink 1992; Guillen and
Jimenez 1995). STA was accepted as a tool for investigation of coastal projects of US Army Corp of Engineers
(Hughes 2005).
STA was used to indicate the sediment pathways inside
a lagoon which can be related to the sediments sources,
wind-related water circulation and wind directions (Avramidis et al. 2008). STA in the integration of acoustic data
leads to a better understanding of the sedimentary, morphological and biological processes in a shallow lagoon in
different spatial and temporal scales (Papatheodorou et al.
2012). STA was also successfully applied for a study of
sediment pollution (McLaren and Singer 2008), coastal
change and sedimentation in estuaries (Van de Kreeke and
Robaczewska 1993; Bergemann et al. 1998; McLaren and
Beveridge 2006; McLaren et al. 2007; McLaren and Braid
2009; McLaren and Teear 2014).
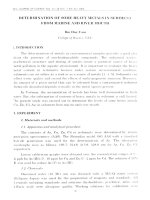
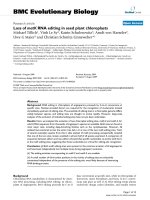
The estuaries on the central coast of Vietnam, situated in
the south-west sector of the Gulf of Tonkin and the East
Vietnam Sea (Fig. 1), are typical examples of such systems. In recent years, navigation channels in the estuaries
of the central part of Vietnam have been facing severe sand
deposition. Fishing boats are frequently unable to go in or
out of their harbours, resulting in a serious reduction in the
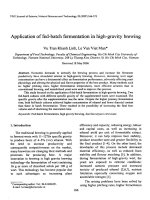
transport of aquacultural products. Some of the most typical estuaries are My A (Quang Ngai Province), Da Rang,
Da Dien (Phu Yen Province), and Tam Quan and Lai Giang
(Binh Dinh Province) (Fig. 2). As a contribution to
understand and solve this problem, this paper aimed to
123
Environ Earth Sci (2016) 75:741
clarify the reasons for sand deposition in Tam Quan estuary
based on the analysis of surface sediment distributions and
transport and then propose suitable countermeasures.
Study area
In the central part of Vietnam, high rainfall in the steep
hinterland results in an abundance of rivers and their
associated estuarine lagoons at the coast. Rivers with large
basin areas, usually larger than 500 km2, maintain open
inlets during the whole year. Because river discharge in the
central coast is strongly seasonal, river mouths and tidal
inlets tend to adjust to an equilibrium morphology associated with low flow conditions during the relatively long dry
period. The morphology of estuaries formed under normal
conditions may be altered dramatically by increased river
discharges (Tung 2011). The sediment concentrations in
the main rivers are usually around 50–150 mg/l, but during
floods the concentrations are greatly increased (Eriksson
and Persson 2014). This type of estuary with significant
influence of river flood flows is dominant. However, due to
construction of dams for agriculture, water discharge of
some small rivers is strongly interrupted and marine and
coastal dynamics are more important than river dynamics
at the river mouths. The coast is predominantly sandy as a
result of alluvial accumulation, which nourishes the beaches and sandy barriers that form across estuary mouths
and tidal inlets (Tung 2011). The 100-m contour line is just
about 10 km from the shoreline.
Tam Quan estuary is located in Hoai Nhon District,
Binh Dinh Province. This is the centre of coastal economic
development of the Binh Dinh Province where there is a
harbour frequently containing more than 2000 fishing
boats. The navigation channel into Tam Quan estuary is
about 150 m wide and 850 m long. Faced with the adverse
impacts of sand deposition, the local government, between
1998 and 2001, constructed a 400-m-long jetty extending
seaward from the northern tip of a barrier beach on the
south side of the harbour entrance. However, the navigation channel continued to infill with sand until 2004 after
which, between 2006 and 2008, the jetty was elongated a
further 450 m. A technical explanation for its expansion
does not, apparently, exist, and sand deposition has continued to be a problem since 2010 (Fig. 3) with the navigation channel requiring periodic dredging between
September 2012 and March 2014. The dredged sand
amounting to 61,600 m3 was used as filling materials for
local construction. Today, the sand deposition continues to
be a problem and dredging is frequently required to
maintain the navigation channel of Tam Quan estuary.
The area surrounding the Tam Quan estuary is underlain
by a variety of igneous and metamorphic rocks that include
Environ Earth Sci (2016) 75:741
Page 3 of 13
741
Fig. 1 River system and tidal
inlets in the central coast of
Vietnam
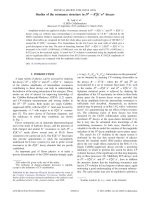
the Kim Son Formation and the Phu My, Ben Giang and
Hai Van complexes (Fig. 4). Quaternary marine sediments
are found mainly in the north as well as in small areas to
the south of the estuary which appear as low relief within
the confines of the valley. Also on the south side, there are
riverine–marine–swampy sediments. River sediments are
characterized by sand and gravel as well as cobbles containing a large variety of lithologies. Coastal dunes,
10–20 m high, 0.2–1.5 km wide and 2–5 km long, are
found along large portions of the coastline.
Waves are subject to seasonal changes with north-east waves
dominant from October to April. During June to September,
south and east waves dominate whereas May is a transitional
season during which time waves are low and their directions
irregular. Average wave heights are from 1.2 to 1.7 m with
maximum heights reaching 12 m during typhoon conditions.
Annually, south-east, south and east waves occur 47, 24 and
13 %, of the time, respectively (Table 1). For about 60 % of the
time, dominant wave heights range from 0.51 to 1.50 m; larger
waves (1.51–2.50 m) occur 20 % of the time.
123
741
Page 4 of 13
Environ Earth Sci (2016) 75:741
Fig. 2 Tidal inlets characterized by severe sand deposition in the central coast of Vietnam
Tides are irregular and diurnal. Tides more than 155 cm
occur only 1 % of the time. Long-term maximum spring
and neap tide ranges are 107 and -93 cm, respectively.
Storm surges have been recorded at a maximum of 1.7 m.
Tam Quan estuary receives water from only three small
streams, and turbidity measurements show that sediment
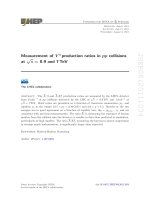
input from these rivers is negligible. Data of bottom currents (about 1 m above the sea floor) was retrieved during a
week in two periods of October 2012 and June 2013,
respectively (Fig. 5). The currents were monitored at two
stations (Fig. 6) which were set up at 6 m water depth. The
results show a dominant direction of currents from north to
south in October. Maximum velocity was recorded at about
27 cm/s with an average of 13 cm/s. In June, current
directions are mixed between north–south, south–north and
east–west. Velocities are 8 cm/s on average. However,
east–west current velocities reached 30–37 cm/s for some
short times due to strong south-west wind-induced waves.
Methods
A total of 130 sediment grab samples were collected along
the Tam Quan coastline to a depth of 20 m (Fig. 6). Based
on rectangular grid, samples were from 150 to 250 m apart
and were positioned by GPS to an accuracy of ±5 m.
Grain-size distributions were obtained by sieving the sandy
fraction (sieve sizes: 2, 1, 0.5, 0.35, 0.25, 0.18, 0.15, 0.125,
0.1, 0.074 and 0.063 mm, i.e. -1.0, 0, 1.0, 1.51, 2, 2.47,
2.74, 3.0, 3.32, 3.76 and 4.0 u) and the grain-size
123
parameters of mean, sorting and skewness were calculated
in u units (Folk 1966, 1980).
The mineral composition was analysed by thin section
using an optical microscope. Representative portions of
about 15 g from each sample were thoroughly washed
several times with water followed by a bath of dilute
hydrochloric and sulphuric acids to clean the grains of any
limonite coating or stains. After drying, the material was
sieved through a half-millimetre sieve. The portion of
grains smaller than 1 mm in size was separated by means
of bromoform having a specific gravity of 2.83. After each
process, the sands were weighed. Permanent slides of the
light and heavy portions of these sands were made for later
microscopic determination using Canada balsam as the
imbedding medium. The mineral composition was estimated by using point counting.
McLaren and Bowles (1985) demonstrated that when
two sediment samples (d1 and d2) are taken sequentially in
a known transport direction (e.g. from a river bed, where d1
is the up current sample and d2 is the down current sample),
the sediment distribution of d2 may become finer (case B)
or coarser (case C) than that of d1; if it becomes finer, the
skewness of the distribution must become more negative.
Conversely, if d2 is coarser than d1, the skewness must
become more positive. The sorting becomes better (i.e. the
value for variance decreases) for both cases. If either of
these two trends is observed, sediment transport from d1 to
d2 can be inferred. If the trend is different from the two
acceptable trends, the trend is unacceptable, and it cannot
be supposed that transport between the two samples has
Environ Earth Sci (2016) 75:741
Page 5 of 13
741
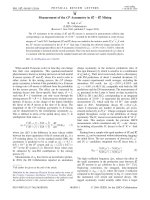
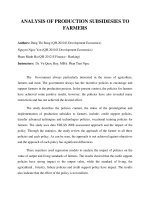
Fig. 3 Sand deposition in navigation channel of Tam Quan estuary.
The area of severe sand deposition was about 150 m long and 100 m
wide, which started from a point of 120 m from seaside head of the
jetty in May 2010. The navigation channel was 50 m wide at the
south side near the jetty; boats could go in and out during spring tide.
Sand deposition was then significantly enlarged and the navigation
channel shifted to the north side near the rock mountain in February
2014; boats can also go in and out during spring tide
taken place. In the preceding example, where the transport
direction is unequivocally known, d2(s) can be related to
d1(s) by a function X(s), where s is the grain size. The
distribution of X(s) may be determined by:
X(s) provides the statistical relationship between the two
deposits, and its distribution defines the relative probability
of each particular grain size being eroded, transported and
deposited from d1 to d2. The shape of the X(s) distribution
relative to the shapes of the d1(s) and d2(s) distributions
d2 ð s Þ ¼ d1 ð s Þ X ð s Þ
123
741
Page 6 of 13
Environ Earth Sci (2016) 75:741
Fig. 4 Geological settings at Tam Quan estuary
Table 1 Frequency (%) of
wave heights at the nearshore of
Tam Quan estuary
Wave height (m)
N
NE
\0.25
0.00
0.13
0.38
0.16
0.26–0.5
0.07
1.28
2.65
1.95
0.51–1.5
1.26
18.86
9.24
5.6
1.51–2.5
0.93
16.41
0.33
0.11
1.29
0.52
2.51–3.5
0.43
7.56
0.03
0.01
0.03
0.02
[3.5
0.34
3.37
0.02
0.00
0.00
0.00
0.00
0.01
Total
3.03
47.61
12.65
7.83
24.19
4.10
0.39
0.18
determines the behaviour (stability) of the sediments. There
are five defined categories for behaviour: (1) net erosion,
(2) net accretion, (3) equilibrium, (4) total deposition type
1 and (5) total deposition type 2 (McLaren and Singer
2008; McLaren and Braid 2009).
There is now a large body of literature that uses or
discusses sediment trend analysis (STA) (e.g. Gao and
Collins 1991, 1992; Gao 1996; Chang et al. 2001; Le Roux
1994; Le Roux et al. 2002; Hughes 2005; He´quette et al.
2008; Poizot et al. 2008; Duc et al. 2012; McLaren 2014;
McLaren and Teear 2014). As a result, a number of
methods have been developed to apply the theory to derive
transport pathways. For this paper, the STA was carried out
following the descriptions provided in McLaren and Beveridge (2006) and McLaren et al. (2007).
123
E
SE
S
SW
W
NW
Sub-total
0.04
0.00
0.00
0.01
0.71
1.60
0.10
0.39
0.03
8.08
21.23
3.46
0.00
0.04
59.69
0.00
0.06
19.65
0.00
0.03
8.11
3.76
100
Results
Sediment characteristics
Based on their characteristics (Table 2) and spatial distribution, sediments were classified into four types which
include nearshore coarse-medium sand, nearshore fine
sand, offshore medium sand and offshore fine sand
(Figs. 7, 8, 9). These are described as follows.
Nearshore coarse-medium sand
This sediment type extends from the coast line to water
depths of 2.5–3.0 m which is at a distance of about 200 m
from the shoreline. Sediments have mean grain diameters
Environ Earth Sci (2016) 75:741
Page 7 of 13
741
Fig. 5 Characteristics of currents at north shore of Tam Quan estuary (a from 30 September to 5 October 2012; b from 4 June to 9 June 2013)
Fig. 6 Sediment sampling locations
123
741
Page 8 of 13
Environ Earth Sci (2016) 75:741
Table 2 Characteristics of surface sediments in at the nearshore of Tam Quan estuary
Sediment
Nearshore coarsemedium sand
Grain-size parameters (u)
Mineral composition (%)
Mean
So
Sk
Quartz
Felspar
Kali
Biotite
Muscovite
Plagioclaz
Heavy
mineral
0.5–1.8 (1.2)a
0.4–1.1 (0.8)
-0.1 to 0.5 (0.1)
70
15
6
4
3
2
Nearshore fine sand
2.4–3.3 (2.8)
0.5–0.9 (0.6)
-0.4 to 0.1 (-0.3)
75
10
4
4
5
2
Offshore medium sand
1.1–1.9 (1.7)
0.7–0.9 (0.8)
-0.1 to 0.3 (0.1)
80
12
1
2
3
2
Offshore fine sand
2.1–3.1 (2.5)
0.6–1.3 (0.7)
-0.5 to 0.1 (-0.1)
80
12
1
2
3
2
a
0.5–1.8 (1.2): Min–Max (average)
Fig. 7 Sediment distribution at Tam Quan estuary
of 0.5–2.6 u, average value of 1.2 u. Sorting coefficients
are from 0.4 u (well sorted) to 1.1 u (poorly sorted),
average value of 0.8 u (moderately sorted). Similarly,
skewness varies from coarse skewed (-0.1 u) to strongly
fine skewed (0.5 u). The average value is near symmetrical (0.1 u). These characteristics suggest an environment of highly variable hydrodynamic conditions, which
is mainly controlled by the formation and migration of rip
currents, especially during time period of north-east
waves (from October to April next year) (Trinh et al.
2011; Tung 2011).
123
Nearshore fine sand
Offshore from the nearshore coarse-medium sand, this sediment type ranges from 2.5–3.0 to 10–12 m water depths to a
distance of 200–800 m from the shoreline. Mean grain
diameters vary from 2.4 to 3.3 u, with an average value of
2.8 u. Sorting coefficients are in a narrow range from 0.5 u
(moderately well sorted) to 0.9 u (moderately sorted), average value of 0.6 u (moderately well sorted). Skewness varies
from strongly coarse skewed (-0.4 u) to near symmetrical
(0.1 u), average value of -0.3 u (strongly coarse skewed).
Environ Earth Sci (2016) 75:741
Page 9 of 13
741
Fig. 8 Distribution of modern sediment grain-size mean value at the nearshore zone
Fig. 9 Distribution of modern sediment sorting value at the nearshore zone
Offshore medium sands
Offshore fine sands
Found in depths ranging from 10–12 to 20 m, these sediments have mean grain diameters of 1.1–1.9 u, with an
average value of 1.7 u. Sorting coefficients are slightly
varied from 0.7 to 0.9 u (moderately sorted). Skewness
changes from coarse skewed (-0.1 u) to fine skewed
(0.3 u). The average value is near symmetrical (0.1 u).
These sediments have mean grain diameters varying from
2.1 to 3.1 u, average value of 2.5 u. Sorting coefficients
are in a large range from 0.6 u (moderately well sorted) to
1.3 u (poorly sorted), average value of 0.7 u (moderately
well sorted). Skewness varies from strongly coarse skewed
(-0.5 u) to near symmetrical (0.1 u), average value of
123
741
Page 10 of 13
-0.1 u (coarse skewed). Like the offshore medium sands,
the offshore fine sands are also found from 10 to 12 m to m
of water and both sediment types have a similar colour to
the nearshore sands, but their grain-size characteristics fall
into much narrower ranges.
In terms of mineral composition, sediments are quite
homogenous (Table 2). Quartz dominates with contents of
75–80 % followed by kali feldspar which ranges from 10 to
15 %. Other minerals include small amounts (2–6 %) of biotite, muscovite, plagioclase and heavy minerals. These findings
suggest that the hydrodynamic conditions do not lead to any
significant differentiation in mineral compositions and that all
the sediment types are likely derived from a similar source.
Sediment transport at the nearshore zone of Tam
Quan estuary
Environ Earth Sci (2016) 75:741
•
•
The results of the STA, as shown Fig. 10, are listed as
follows:
•
Sediments are not transported from the coastline to
shallow water (up to about 2.5 m water depth) on either
side of the Tam Quan estuary. This supports the
concept that both northern and southern parts of the
beach are relatively stable and that the predominant
wave direction is almost perpendicular to the shoreline.
An exception occurs in a short segment of the Tam
Quan north shore (Fig. 8), where the coast is known to
have eroded in recent years.
Fig. 10 Transport of modern sediments at the nearshore zone
123
•
•
The dominant transport behaviour of sediment in the
north part of Tam Quan estuary is net accretion at water
depths of 2.5–10 m. It shows relative significant
strength of southward sediment transport which
matches well with the dominance of north–south
bottom currents in the area. Moreover, the net accretion
indicates a likely increase of available sediments for
transporting southwards. Around the Truong Xuan
headland, this mode was also found at the water depths
of 5–10 m but changes to net erosion at shallower water
depths of 2–5 m. Change in shoreline orientation at the
headlands leads to the formation of a high wave energy
surf zone in the shallow water. Sediment samples were
unable to be collected in the shallow water surrounding
the rocky headland precluding the determination of the
transport regime at 0–2 m water depths in this area.
Around the Tam Quan estuary, sediments are transported past the Truong Xuan headland generally as net
accretion but with occasional sample sequences showing net erosion or equilibrium.
Sediment trends were undefined in much of the
navigation channel, most likely the result of recent
dredging in the area. Sediments are transported along
the south side of the jetty in equilibrium and net
accretion. Near jetty’s head, sediments do not show any
transport.
In the south part of the estuary, sediment trends were
not defined at the water depths of 0–5 m near the jetty
(300–1000 m southwards). In the other parts (from 3 to
Environ Earth Sci (2016) 75:741
10 m water depths), sediment trends are net erosion and
then change to equilibrium further South.
Discussion
Spatial distribution of sediments
Pale yellow medium sands are found along the coast from
the shoreline to 2.5 m water depth. Fine sands with a light
grey colour occur in the deeper areas which are up to 11 m
in the north, 13 m opposite the mouth of the estuary and
10 m to its south. This spatial distribution was formed as a
result of current hydrodynamic conditions. Medium sands
exist in the high wave energy characterized by the surf
zone, and fine sands are more associated with the wave
propagating zone. Due to the impact of the jetty, fine sand
has accumulated on shoreline at the south side covering a
linear distance of 300 m (Fig. 5). In addition, a small
emerged bar of medium sand with better sorting coefficients was formed at the depth of 1.8–2.0 m (Fig. 7).
In the deeper area, dark yellow medium sands exposed.
The existence of these coarse sediments suggests that they
are not formed by current hydrodynamic conditions. The
shoreline of Vietnam in general and its central part in
particular has altered significantly during the Holocene
period as a result of sea level change (Korotky et al. 1995;
Nguyen et al. 2000; Funabiki et al. 2007; Tan et al. 2014)
causing the boundary between modern shoreline sediments
and the ancient deposits found in the deeper water (Fig. 5).
Such a boundary has been observed before in depths of
about 30 m in the vicinity of the Red River delta (Duc et al.
2007, 2012) and 15–20 m adjacent to the central part of the
coast (Korotky et al. 1995). These studies, based on sediment distribution, colour and grain size, suggest that the
boundary separates modern (late Holocene) sediments and
ancient (early Holocene) sediments. However, further work
to include radioactive dating and geochemical analyses will
be required to verify the ages of the two sediment types.
Reasons of sand deposition
As mentioned above, both northern and southern parts of
the beach are relatively stable and the predominant wave
direction is almost perpendicular to the shoreline. The
orientations of both shorelines are almost the same at about
333°; however, the direction of shoreline just north of the
estuary is significantly greater (about 351°) (Fig. 10). This
shoreline configuration results in southward transport and
sediment, as shown in Fig. 10, reaches the Tam Quan
estuary as it passes around the small headland. Sediments
are deposited in two different areas. One is after the north
Page 11 of 13
741
headland and another is close to the south jetty. The much
shallower bottom behind the headland causes a significant
dissipation of wave energy leading to net accretion in this
area. Sand then bypasses the navigation channel to accumulate on its other side. Trends of the bypassing cannot be
observed in the analysis due to frequent dredging of the
channel. However, net erosion in the nearby zone of the
jetty shows evidence of sediment transport southward to
the jetty. The head of the jetty, installed in 8 m of water,
serves as a sediment trap resulting in severe sand deposition in the navigation channel of the Tam Quan estuary. In
the long term, additional sand deposition in the channel can
be transported from the south towards the head of the jetty.
Impacts of south jetty
Prior to the jetty, sediment bypassed the estuary’s entrance
via the sand bar in front of the river mouth (Trinh et al.
2011). Even after its construction, the initial length of the
jetty was insufficient to result in the deposition that is
occurring today.
At Tam Quan estuary, before the jetty extension, it was
likely that sand naturally bypassed the estuary entrance.
However, after its extension, all sediment transported from
the north became trapped by the jetty and deposited in the
channel as shown in Fig. 3. The southern shoreline close
to the base of the jetty also advanced a little due to
incoming waves that could now become diffracted by its
presence.
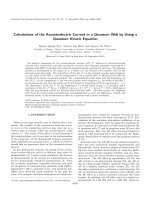
Proposal of engineering measures to prevent sand
deposition in channel
To prevent sedimentation in the channel, sediment transport
from north to south past the small headland requires controlling. A properly designed jetty at the north headland can
effectively control this sediment movement. There are two
ways to prevent sedimentation in the channel which are
illustrated in Fig. 11. The first is to trap sediment transported
to the south before entering the channel (Fig. 11a). The
other is to encourage the transport of sediment to bypass the
estuary’s mouth as it did in the past (Fig. 11b). The precise
design and locations of the two proposed jetty structures will
require a more complete investigation of the characteristics
of sediment movement. To maintain the fishery harbour in
the Tam Quan estuary, it will be necessary to consider the
location and shape of the north breakwater (ln), the length of
the existing jetty (le) as well as the location and shape of the
south breakwater (Fig. 11).
At this time, the length of the existing south jetty could
possibly be shortened provided that it can be shown to
prevent northward sediment transport caused by diffracted
123
741
Page 12 of 13
Environ Earth Sci (2016) 75:741
Fig. 11 Control of sediment
transport at Tam Quan estuary
by jetty (a sand trap by straight
upright jetty; b sand bypass by
inclined jetty)
waves around the newly constructed north jetty and the
extreme waves caused by typhoons, although the probability of their occurrences will not be so high.
Conclusions
Two types of sand deposits (modern and ancient) were
defined in the offshore area of the Tam Quan estuary. The
boundary between the two is in 11 m water depth in the
north, 13 m opposite the mouth and 10 m to the south of the
estuary. In addition, modern medium sand is distributed
along the coast from the shoreline to 2.5 m water depth and
finer sand is found in water depths of 2.5 to 10–13 m. In the
deeper area, ancient medium and fine sands are exposed.
Dominant longshore sediment transport is from north to
south at the Tam Quan estuary. Sediments are trapped by
the present jetty and resulting in severe sand deposition in
the navigation channel. As a solution, a properly designed
jetty at the north headland will effectively control this
sediment movement by either trapping the sand or helping
to ensure that the sand bypasses the estuary’s mouth as it
did prior to the construction of present entrance jetty.
Acknowledgments This research is funded by the Vietnam
National Foundation for Science and Technology Development
(NAFOSTED) under Grant number 105.99-2012.14.
References
Aldridge JN (1997) Hydrodynamic model predictions of tidal
asymmetry and observed sediment transport paths in Morecambe
Bay. Estuar Coast Shelf Sci 44:39–56
123
Avramidis P, Bouzos D, Antoniou V, Kontopoulos N (2008)
Application of grain size trend analysis and spatio-temporal
changes of sedimentation, as a tool for lagoon management.
Case study: the Kotychi lagoon (western Greece). Geol Carpath
59:261–268
Bergemann F, Lang G, Flugge G (1998) A particle method for
sediment transport modeling in the Jade Estuary. In: Spaulding
ML, Blumberg AF (eds) Proceedings of the 5th international
conference of estuarine and coastal modeling, Alexandria, VA
Chalov SR, Jarsjo¨ J, Kasimov NS, Romanchenko AO, Pietron J,
Thorslund J, Promakhova EV (2015) Spatio-temporal variation
of sediment transport in the Selenga River Basin, Mongolia and
Russia. Environ Earth Sci 73(2):663–680
Chang YH, Scrimshaw MD, Lester JN (2001) A revised grain-size
trend analysis program to define net sediment transport pathways. Comput Geosci 27(1):109–114
Duc DM, Nhuan MT, Ngoi CV, Nghi T, Tien DM, van Weering
TjCE, van den Bergh GD (2007) Sediment distribution and
transport at the nearshore zone of the Red River delta, Northern
Vietnam. J Asian Earth Sci 29(4):565–588
Duc DM, Nhuan MT, Ngoi CV (2012) An analysis of coastal erosion
in the tropical rapid accretion delta of the Red River, Vietnam.
J Asian Earth Sci 43:98–109
Duck RW, Rowan JS, Jenkins PA, Youngs I (2001) A multi-method
study of bedload provenance and transport pathways in an
estuarine channel. Phys Chem Earth B 26(9):747–752
Eriksson EL, Persson MH (2014) Sediment transport and coastal
evolution at Thuan An Inlet, Vietnam. MSc Thesis, Lund
University. />le&recordOId=4393060&fileOId=4393063. Accessed 24 Feb
2016
Flemming BW (1988) Process and pattern of sediment mixing in a
microtidal coastal lagoon along the westcoast of South Africa.
In: De Boer PL, Van Gelder A, Nio SD (eds) Tide-influenced
sedimentary environments and facies. D. Reidel Publishing
Company, Dordrecht, 275–288
Folk RL (1966) A review of grain-size parameters. Sedimentology
6:73–93
Folk RL (1980) Petrology of sedimentary rocks. Hemphill Publication
Co., Austin, p 185
Environ Earth Sci (2016) 75:741
Funabiki A, Haruyama S, Quy NV, Hai PV, Thai DH (2007)
Holocene delta plain development in the Song Hong (Red River)
delta, Vietnam. J Asian Earth Sci 30(3–4):518–529
Gao S (1996) A Fortran program for grain-size trend analysis to
define net sediment transport pathways. Comput Geosci
22(4):449–452
Gao S, Collins M (1991) A critique of the ‘‘McLaren method’’ for
defining sediment transport paths. J Sediment Petrol
61(1):143–146
Gao S, Collins M (1992) Net sediment transport patterns inferred
from grain-size trends, based upon definition of ‘‘transport
vectors’’. Sed Geol 80(1–2):47–60
Gao S, Collins M (1994) Analysis of grain size trends, for defining
sediment transport pathways in marine environments. J Coast
Res 10(1):70–78
Gao S, Collins MB, Lanckneus J, De Moor G, Van Lancker V (1994)
Grain size trends associated with net sediment transport patterns:
an example from the Belgian continental shelf. Mar Geol
121:171–185
Guillen J, Jimenez JA (1995) Processes behind the longshore
variation of the sediment grain size in the Ebro Delta coast.
J Coast Res 11(1):205–218
He X, Wang YP, Zhu Q, Zhang Y, Zhang D, Zhang J, Yang Y, Gao J
(2015) Simulation of sedimentary dynamics in a small-scale
estuary: the role of human activities. Environ Earth Sci
74(1):869–878
He´quette A, Hemdane Y, Anthony EJ (2008) Determination of
sediment transport paths in macrotidal shoreface environments: a
comparison of grain-size trend analysis with near-bed current
measurements. J Coast Res 24(3):695–707
Hughes SA (2005) Use of sediment trend analysis (STA) for coastal
projects. ERDC/CHL CHETN-VI-40. Vicksburg, MS: US Army
Corps of Engineers, p 17
Korotky AM, Razjigaeva NG, Ganzey LA, Volkov VG, Grebennikova TA, Bazarova VB, Kovalukh NN (1995) Late Pleistocene–Holocene coastal development of islands off Vietnam.
J SE Asian Earth Sci 11(4):301–308
Lanckneus J, De Moor G, De Schaepmeester G (1992) Residual
sediment transport directions on a tidal sand bank: Comparison
of the ‘McLaren model’ with bedform analysis. Bulletin de la
Societe belge d’Etudes Geographique—SOBEG 2:425–446
Le Roux JP (1994) An alternative approach to the identification of net
sediment transport paths based on grain-size trends. Sed Geol
94(1–2):97–107
Le Roux JP, O’Brian RD, Rios F, Cisternas M (2002) Analysis of
sediment transport paths using grain-size parameters. Comput
Geosci 28(5):717–721
Livingstone I (1989) Temporal trends in grain-size measures on a
linear sand dune. Sedimentology 26:1017–1022
Mallet C, Howa HL, Garlan T, Sottolichio A, Le Hir P, Michel D
(2000) Utilisation of numerical and statistical techniques to
describe sedimentary circulation patterns in the mouth of the
Gironde estuary. Earth Planet Sci 331:1–7
Masselink G (1992) Longshore variation of grain size distribution
along the coast of the Rhone Delta, Southern France: A test of
the ‘McLaren model’. J Coast Res 8(2):286–291
Page 13 of 13
741
McCave IN (1978) Grain size trends and transport along beaches: an
example from eastern England. Mar Geol 28:43–51
McLaren P (1981) An interpretation of trends in grain-size measurements. J Sediment Petrol 51:611–624
McLaren P (2014) Sediment trend analysis (STA): kinematic vs.
dynamic modeling. J Coasta l Res 30(3):429–438
McLaren P, Beveridge P (2006) Sediment trend analysis of the
Hylebos Waterway: implications for liability allocations. Integr
Environ Assess Manag 2(3):262–272
McLaren P, Bowles D (1985) The effects of sediment transport on
grain-size implications of the ‘Red Clay’ (North China) as
evidenced by grain-size distribution. J Quatern Sci 16(1):89–97
McLaren P, Braid M (2009) Sediment trend analysis in support of
unexploded explosive ordnance (UXO) risk assessment. J Am
Soc Test Mater Int 6(7):1–20
McLaren P, Singer J (2008) Sediment transport and contaminant
behavior in the Buffalo River, New York: implications for river
management. J Coast Res 24(4):954–968
McLaren P, Teear G (2014) A sediment trend analysis (STA) in
support of dredged material management in Lyttelton Harbour,
Christchurch, New Zealand. J Coast Res 30(3):438–447
McLaren P, Hill SH, Bowles D (2007) Deriving transport pathways in
a sediment trend analysis (STA). Sed Geol 202(3):489–498
Nguyen VL, Ta TKO, Tateishi M (2000) Late Holocene depositional
environments and coastal evolution of the Mekong River Delta,
Southern Vietnam. J Asian Earth Sci 18(4):427–439
Papatheodorou G, Avramidis P, Fakiris E, Christodoulou D, Kontopoulos N (2012) Bed diversity in the shallow water environment of Pappas Lagoon in Greece. Int J Sedim Res 27:1–17
Poizot P, Mear Y, Biscara L (2008) Sediment trend analysis through
the variation of granulometric parameters: a review of theories
and applications. Earth Sci Rev 86(1–4):15–41
Portela LI (2008) Sediment transport and morphodynamics of the
Douro River estuary. Geo-Mar Lett 28:77–86
Rios F, Ulloa R, Cerrea ICS (2003) Determination of net sediment
transport patterns in Lirquen Harbor, Chile through grain-size
analysis: a test of methods. Pesquisas em Geociencias 30(1):65–81
Tan MT, Dung LV, Bach LD, Bieu N, Nghi T, Long HV, Huong PV
(2014) Pliocene-Quaternary evolution of the continental shelf of
central Vietnam based on high resolution seismic data. J Asian
Earth Sci 79:529–539
Trinh LP, Long BH, Mau LD, Trung PB (2011) Typical hydrodynamic conditions causing erosion-accretion in the coast of
Vietnam Southern Central part. J Mar Sci Technol 11(3):15–30
(in Vietnamese)
Tung TT (2011) Morphodynamics of seasonally closed coastal inlets
at the Central coast of Vietnam. PhD Disertation, Technische
Universiteit Delft
Van de Kreeke J, Robaczewska K (1993) Tide-induced residual
transport of coarse sediment: application to the Ems Estuary.
Neth J Sea Res 31(3):209–220
Van Der Wal D (2000) Grain-size-selective aeolian sand transport on
a nourished beach. J Coast Res 16(3):896–908
Zhang X, Dai Z, Chu A, Du J (2014) Impacts of relative sea level rise
on the shoreface deposition, Shuidong Bay, South China.
Environ Earth Sci 71(8):3503–3515
123