DSpace at VNU: Inclusive W and Z production in the forward region at root s=7TeV
Bạn đang xem bản rút gọn của tài liệu. Xem và tải ngay bản đầy đủ của tài liệu tại đây (903.8 KB, 30 trang )
Published for SISSA by
Springer
Received: April 7, 2012
Accepted: May 25, 2012
Published: June 11, 2012
The LHCb collaboration
Abstract: Measurements of inclusive W and Z boson production cross-sections in pp
√
collisions at s = 7 TeV using final states containing muons are presented. The data sample
corresponds to an integrated luminosity of 37 pb−1 collected with the LHCb detector.
The W and Z bosons are reconstructed from muons with a transverse momentum above
20 GeV/c and pseudorapidity between 2.0 and 4.5, and, in the case of the Z cross-section,
a dimuon invariant mass between 60 and 120 GeV/c2 . The cross-sections are measured to
be 831 ± 9 ± 27 ± 29 pb for W + , 656 ± 8 ± 19 ± 23 for W − and 76.7 ± 1.7 ± 3.3 ± 2.7 pb for Z,
where the first uncertainty is statistical, the second is systematic and the third is due to the
luminosity. Differential cross-sections, W and Z cross-section ratios and the lepton charge
asymmetry are also measured in the same kinematic region. The ratios are determined to be
σW + →µ+ ν /σW − →µ− ν¯ = 1.27±0.02±0.01 and (σW + →µ+ ν +σW − →µ− ν¯ )/σZ→µµ = 19.4±0.5±
0.9. The results are in general agreement with theoretical predictions, performed at nextto-next-to-leading order in QCD using recently calculated parton distribution functions.
Keywords: Hadron-Hadron Scattering
ArXiv ePrint: 1204.1620
Open Access, Copyright CERN,
for the benefit of the LHCb collaboration
doi:10.1007/JHEP06(2012)058
JHEP06(2012)058
Inclusive W and Z production in the forward region
√
at s = 7 TeV
Contents
1
2 LHCb detector and Monte Carlo samples
3
3 Selection of W and Z events
3.1 Muon reconstruction and identification
3.2 Selection of Z → µµ candidates
3.3 Z → µµ event yield
3.4 Selection of W → µν candidates
3.5 W → µν event yield
4
4
4
4
6
9
4 Cross-section measurement
4.1 Cross-section definition
4.2 Signal efficiencies
4.3 Acceptance
4.4 Luminosity
4.5 Corrections to the data
4.6 Systematic uncertainties
10
10
10
13
13
13
13
5 Results
15
6 Conclusions
19
A Tables of results
21
The LHCb collaboration
26
1
Introduction
The measurement of the production cross-sections for W and Z bosons constitutes an important test of the Standard Model and provides valuable input to constrain the proton
parton density functions (PDFs). Theoretical predictions are known to next-to-next-toleading-order (NNLO) in perturbative quantum chromodynamics (pQCD). These calculations are in good agreement with recent measurements at the LHC from the ATLAS [1, 2],
and the CMS [3, 4] experiments as well as with the results from the p¯
p collider ex¯
periments at the SppS [5, 6] and the Tevatron [7–10]. The dominant theoretical uncertainty on the cross-sections arises from the present knowledge of the PDFs and the
–1–
JHEP06(2012)058
1 Introduction
The measurements of the inclusive W and Z cross-sections2 in pp collisions at a centreof-mass energy of 7 TeV, using final states containing muons, are presented in this paper.
The analysis is based on data taken by the LHCb experiment in 2010 with an integrated
luminosity of 37 pb−1 . The cross-sections are measured in a fiducial region corresponding to
the kinematic coverage of the LHCb detector, where the final state muons have a transverse
momentum, pµT , exceeding 20 GeV/c and lie within the pseudorapidity range 2.0 < η µ < 4.5.
This range is smaller than the LHCb acceptance in order to avoid edge effects for the
acceptance. In addition, the invariant mass of the muons from the Z boson must be in
the range 60 < Mµµ < 120 GeV/c2 . Results are presented for the total cross-sections
and cross-section ratios. Cross-sections are also measured in bins of muon pseudorapidity
for W , and in bins of Z rapidity (y Z ) for Z production. Because of the presence of the
neutrino, the production asymmetry between W + and W − cannot be reconstructed as a
function of the boson rapidity. Instead it is measured as a function of the experimentally
accessible muon pseudorapidity, η µ , and referred to as the lepton charge asymmetry Aµ =
(σW + →µ+ ν − σW − →µ− ν¯ )/(σW + →µ+ ν + σW − →µ− ν¯ ). To constrain the PDFs, it is useful
to measure Aµ for different pµT thresholds. The data are compared to NNLO and NLO
pQCD predictions with recent parametrisations for the PDFs. The signal efficiency and
background contribution are mostly derived from data.
The remainder of the paper is organised as follows. Section 2 describes the LHCb
detector and the Monte Carlo samples. Section 3 describes the selection of the W and Z
candidates, the backgrounds, the determination of the purity and the signal efficiencies.
The measurement of the cross-sections as well as the systematic uncertainties are discussed
in section 4. The results are presented in section 5 and conclusions in section 6.
1
The pseudorapidity η is defined to be η = − ln tan(θ/2), where the polar angle θ is measured with
respect to the beam axis.
2
Throughout this paper Z includes both the Z and the virtual photon (γ ) contribution.
–2–
JHEP06(2012)058
strong coupling constant. The accuracy strongly depends on the pseudorapidity1 range;
consequently, measurements by LHCb, which is fully instrumented in the forward region
2.0 < η < 5.0, can provide input to constrain the PDFs, both for pseudorapidities η > 2.5
and in the region which is common to ATLAS and CMS, 2.0 < η < 2.5. Besides the
determination of the W and Z boson cross-sections, the measurement of their ratios
RW Z = (σW + →µ+ ν + σW − →µ− ν¯ )/σZ→µµ and RW = σW + →µ+ ν /σW − →µ− ν¯ and of the W
production charge asymmetry constitute important tests of the Standard Model, as experimental and theoretical uncertainties partially cancel. The W charge asymmetry is
sensitive to the valence quark distribution in the proton [11] and provides complementary
information to the results from deep-inelastic scattering cross-sections at HERA [12] as
those data do not strongly constrain the ratio of u over d quarks at low Bjorken x, where x
is the proton momentum fraction carried by the quark. Measurements of W and Z boson
production at LHCb have a sensitivity to values of x as low as 1.7×10⁻⁴ and will contribute
significantly to the understanding of PDFs at low x and reasonably large four-momentum
transfer Q2 , which corresponds to the squared mass of the W or the Z boson.
2
LHCb detector and Monte Carlo samples
Several Monte Carlo (MC) simulated samples are used to develop the event selection,
estimate the backgrounds, cross-check the efficiencies and to account for the effect of the
underlying event. The Pythia 6.4 [14] generator, configured as described in ref. [15], with
the CTEQ6ll [16] parametrisation for the PDFs is used to simulate the processes Z → µµ,
Z → τ τ , W → µν and W → τ ν. The hard partonic interaction is calculated in leading
order pQCD and higher order QCD radiation is modelled using initial and final state
parton showers in the leading log approximation [17]. The fragmentation into hadrons
is simulated in Pythia by the Lund string model [18]. All generated events are passed
through a Geant4 [19] based detector simulation, the trigger emulation and the event
reconstruction chain of the LHCb experiment.
Samples of W → µν and Z → µµ simulated events with one muon in the LHCb
acceptance have been reweighted to reproduce the NNLO pµT distribution. These samples
are referred to as W -MC and Z-MC, respectively. In the first step a correction factor
is calculated as a function of the generated muon transverse momentum by determining
the ratio of the generated pµT spectrum, as simulated by the Powheg [20–22] generator
at NLO, to the generated pµT spectrum from Pythia. In the second step the events are
reweighted with a factor given by the ratio between the NNLO and NLO prediction as
calculated with Dynnlo [23]. This factor is calculated as a function of the rapidity of
the boson. As an alternative, Pythia samples have been reweighted to reproduce the pµT
distribution as calculated with Resbos [24–26]. Resbos includes a NLO calculation plus
next-to-next-to-leading-log resummation of QCD effects at low transverse momentum.
–3–
JHEP06(2012)058
The LHCb detector [13] is a single-arm forward spectrometer covering the pseudorapidity
range 2 < η < 5, designed for the study of particles containing b or c quarks. The detector includes a high precision tracking system consisting of a silicon-strip vertex detector
(VELO) surrounding the pp interaction region, a large-area silicon-strip detector (TT) located upstream of a dipole magnet with a bending power of about 4 Tm, and three stations
of silicon-strip detectors (IT) and straw drift-tubes (OT) placed downstream. The combined tracking system has a momentum resolution ∆p/p that varies from 0.4% at 5 GeV/c to
0.6% at 100 GeV/c, and an impact parameter (IP) resolution of 20 µm for tracks with high
transverse momentum. Charged hadrons are identified using two ring-imaging Cherenkov
detectors. Photon, electron and hadron candidates are identified by a calorimeter system
consisting of scintillating-pad and pre-shower detectors, an electromagnetic calorimeter and
a hadronic calorimeter. Muons are identified by a muon system composed of alternating
layers of iron and multiwire proportional chambers. The trigger consists of a hardware
stage, based on information from the calorimeter and muon systems, followed by a software stage which applies a full event reconstruction. To avoid the possibility that a few
events with high occupancy dominate the CPU time of the software trigger, a set of global
event cuts is applied on the hit multiplicities of most subdetectors used in the pattern
recognition algorithms.
3
Selection of W and Z events
3.1
Muon reconstruction and identification
3.2
Selection of Z → µµ candidates
Candidate Z → µµ events are selected by requiring a pair of well reconstructed tracks
identified as muons; the invariant mass of the two muons must be in the range 60 <
Mµµ < 120 GeV/c2 . Each muon track must have pµT > 20 GeV/c and lie in the range
2.0 < η µ < 4.5. The relative uncertainty on the momentum measurement is required to be
less than 10% and the probability for the χ2 /ndf for the track fit larger than 0.1%, where
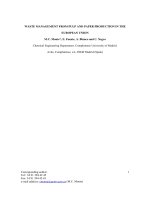
ndf is the number of degrees of freedom. In total, 1966 Z candidates are selected; their
mass distribution is shown in figure 1. The data are not corrected for initial or final state
radiation. A Crystal Ball [27] function for the Z peak, and an exponential distribution for
both the off-resonance Drell-Yan (γ ) production and the small background contribution
are fitted to the distribution. The fitted mass 90.7 ± 0.1 GeV/c2 and width 3.0 ± 0.1 GeV/c2 ,
where the uncertainties are statistical, are consistent with expectation from simulation.
3.3
Z → µµ event yield
The background contribution to the Z → µµ analysis is very low. Five different sources
are investigated.
1. Decays from Z → τ τ contribute, if both taus decay leptonically to muons and neutrinos. The tau background is estimated from simulation, with the Z cross-section
fixed to the cross-section measured in this analysis, to contribute 0.6 ± 0.1 events to
the total sample.
2. Decays of heavy flavour hadrons contribute to the background if they decay semileptonically (“heavy flavour” background). The contribution is estimated from a sample, which is enriched in background. “Non-isolated” muons are selected with pµT >
–4–
JHEP06(2012)058
Events with high transverse momentum muons are selected using a single muon trigger
with a threshold of pµT > 10 GeV/c. Tracks are reconstructed starting from the VELO,
within which particle trajectories are approximately straight, since the detector is located
upstream of the magnet. Candidate tracks are extrapolated to the other side of the magnet
and a search is made for compatible hits in the IT and OT sub-detectors. An alternative
strategy searches for track segments in both the VELO and IT/OT detectors and extrapolates each to the bending plane of the magnet, where they are matched. Once VELO
and IT/OT hits have been combined, an estimate of the track momentum is available and
the full trajectory can be defined. Finally, hits in the TT sub-detector are added if consistent with the candidate tracks. Thus, the presence of TT hits can be considered as an
independent confirmation of the validity of the track.
Muons are identified by extrapolating the tracks and searching for compatible hits in
the four most downstream muon stations. For the high momentum muons that concern
this analysis, hits must be found in all four muon stations. In total, the muon candidate
must have passed through over 20 hadronic interaction lengths of material.
Events / (2 GeV/c2)
LHCb
80
100
120
Dimuon invariant mass [GeV/c2]
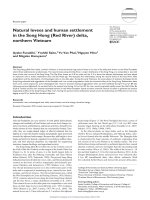
Figure 1. Invariant mass of the selected muon pairs. The fitted distribution to the data is shown
as a solid line and the contribution from background and off-resonance Drell-Yan production as a
dashed line.
15 GeV/c and Mµµ > 40 GeV/c2 and the scalar sum of the transverse momenta of all
tracks in a cone of half angle 0.5 in η-φ around the muons larger than 4 GeV/c; here φ
is the azimuthal angle measured in radians. A fit to the invariant mass distribution
at low masses is then used to estimate the background contribution in the Z mass
region. The heavy flavour contribution is estimated to be 3.5 ± 0.8 events.
3. Pions or kaons may be misidentified as muons if they decay in flight (“decay-inflight” background) or if they travel through the calorimeters and are identified by the
muon chambers (“punch-through” background). This background should contribute
equally in same-sign and opposite-sign combinations of the muon pair. No event is
found in the Z selection with both tracks having the same charge. The contribution
from muon misidentification is estimated to be less than one event.
4. W pair production contributes to the sample if both W bosons decay to a muon
and a neutrino. This contribution corresponds to 0.2 ± 0.1 events as estimated with
Pythia MC simulation.
5. Decays of top quark pairs may contribute if both top quarks decay semileptonically.
Pythia MC simulation predicts a contribution of 0.5 ± 0.2 events.
The total background contribution in the Z sample in the range 60–120 GeV/c2 amounts
to 4.8 ± 1.0 events. This corresponds to a purity ρZ = 0.997 ± 0.001. The purity is defined
as the ratio of signal to candidate events. No significant dependence on the boson rapidity
is observed.
–5–
JHEP06(2012)058
450
400
350
300
250
200
150
100
50
0
60
3.4
Selection of W → µν candidates
–6–
JHEP06(2012)058
In leading order QCD, W → µν events are characterised by a single high transverse momentum muon that is not associated with other activity in the event. As only the muon
can be reconstructed in LHCb, the background contribution is larger for the W than for
the Z candidates. Therefore, more stringent requirements are placed on the track quality
of the muon and additional criteria are imposed in order to select W candidates.
The optimisation of the W selection and the evaluation of the selection efficiency make
use of a “pseudo-W ” control sample obtained from the previously described Z selection,
where each of the muons is masked in turn, in order to mimic the presence of a neutrino
and fake a W → µν decay. Excellent agreement is observed for all variables of interest
between pseudo-W and W simulated samples with the exception of those that have an explicit dependence on the transverse momentum of the muon, as the underlying momentum
distribution differs for muons from Z and W .
The identification of W → µν candidate events starts by requiring a well reconstructed
track which is identified as a muon. The track must have a transverse momentum in the
range 20 < pµT < 70 GeV/c within a pseudorapidity range 2.0 < η µ < 4.5. The relative error
on the momentum measurement must be less than 10%, the probability for the χ2 /ndf of
the track fit must be greater than 1%, and there must be TT hits associated to the track.
The last requirement reduces the number of combinations of VELO and IT/OT information
that have been incorrectly combined to form tracks.
To suppress background from Z → µµ decays, it is required that any other identified
muon in the event has a transverse momentum below 2 GeV/c. This removes the events
where both muons have entered the LHCb acceptance.
Identified muons can originate from background processes of heavy flavour decays,
or misidentification of pions and kaons due to decay-in-flight or punch-through (“QCD
background”). In all such cases, the identified muon is usually produced in the same
direction as the other fragmentation products, in contrast to muons from W decays which
tend to be isolated. The isolation of the muon is described using the charged transverse
cone
momentum, pcone
T , and neutral transverse energy, ET , in a cone around the candidate
muon. The quantity pcone
is defined as the scalar sum of the transverse momentum of all
T
tracks, excluding the candidate muon, satisfying (∆φ)2 + (∆η µ )2 < 0.5, where ∆φ and
∆η µ are the differences in φ and η between the muon candidate and the track. The quantity
cone is defined in a similar way, but summing the transverse energy of all electromagnetic
ET
cone are
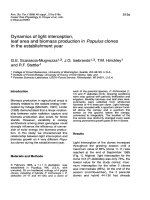
calorimeter deposits not associated with tracks. The distributions for pcone
and ET
T
µ
shown in figure 2 for pseudo-W data, W -MC and muons with pT > 20 GeV/c and an IP
larger than 80 µm. The IP of the muon is defined as the distance of closest approach
to the primary vertex calculated from the other tracks in the event excluding the muon
candidate. The sample with high IP is enriched with muons from decays of heavy flavour
hadrons, showing the typical shape of QCD background. There is agreement between
pseudo-W data and W -MC, while the shape for the heavy flavour events is quite different.
cone < 2 GeV.
To suppress QCD background, it is required that pcone
< 2 GeV/c and ET
T
Muons originating from semi-leptonic decays of heavy flavour hadrons can be further
suppressed by a cut on the IP. Due to the lifetimes of the B and D mesons, these muons
Event probability
1
LHCb
Pseudo-W (Data)
W → µν (Simulation)
IP > 80 µm (Data)
10-1
10-2
10-3
0
10
20
30
p cone [GeV/c]
Event probability
T
1
LHCb
Pseudo-W (Data)
W → µν (Simulation)
IP > 80 µm (Data)
10-1
10-2
10-3
10-4
0
10
20
Econe
T
30
[GeV]
cone
Figure 2. Distributions for pcone
(top) and ET
(bottom). The points are for muons from pseudoT
W data, the yellow (shaded) histograms are for W -MC simulation, while the open histograms are
for muons from QCD background with IP > 80 µm from data. All distributions are normalised to
unity.
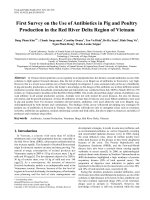
do not originate from the primary pp interaction. The IP distribution is shown in figure 3
for pseudo-W events, W -MC, and simulated semi-leptonic decays of hadrons containing a
b or c quark. The pseudo-W events and W -MC are in agreement and peak at low values
of IP, in contrast to the heavy flavour background. For the W candidate selection it is
required that IP < 40 µm. This cut also removes a large fraction of the background from
W → τ ν and Z → τ τ decays.
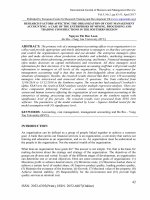
Pions and kaons that punch-through to the muon chambers can be distinguished from
true muons as they leave substantial energy deposits in the calorimeters. Figure 4 shows
the summed energy, E, in the electromagnetic and hadronic calorimeter associated with
–7–
JHEP06(2012)058
10-4
Event probability
1
LHCb
Pseudo-W (Data)
W → µν (Simulation)
b b → Xµ (Simulation)
cc → Xµ (Simulation)
10-1
10-2
10-3
0
0.1
0.2
0.3
0.4
0.5
IP [mm]
Event probability
Figure 3. Muon IP distribution for pseudo-W events as points, W -MC as a yellow (shaded)
histogram, and muons from simulated semi-leptonic decays of hadrons containing a b quark in the
full open histogram or a c quark in the dashed open histogram. All distributions are normalised to
unity.
1
LHCb
Pseudo-W (Data)
W → µν (Simulation)
Hadrons (Data)
10-1
10-2
10-3
10-4
0
0.5
1
1.5
E / pc
Figure 4. E/pc for pseudo-W events as points, W -MC as a yellow (shaded) histogram, and
for hadrons from randomly triggered events in the open histogram. The energy E is the sum
of the energies in the electromagnetic and hadronic calorimeter associated with the particle. All
distributions are normalised to unity.
the particle, divided by the track momentum, p, for pseudo-W events, W -MC, and hadrons
with pT > 20 GeV/c in randomly triggered events. By requiring E/pc < 0.04 the punchthrough contamination can be reduced to a negligible level. The disagreement between
pseudo-W data and simulated W -MC in figure 4 is caused by the different underlying
momentum distribution for muons from W and Z.
–8–
JHEP06(2012)058
10-4
3.5
W → µν event yield
After the W selection requirements are imposed 14 660 W + and 11 618 W − candidate events
are observed. The W → µν signal yield has been determined by fitting the pµT spectra of
positive and negative muons in data, to template shapes for signal and backgrounds in five
bins of η µ . The fit is performed with the following sources for signal and background with
the shapes and normalisations as described below.
1. The W → µν signal template is obtained using the W -MC. The normalisation is left
free to vary in each bin of η µ and for each charge.
3. The shape of the W → τ ν and Z → τ τ templates are taken from Pythia. The
Z → τ τ template is scaled according to the observed number of Z events. These τ
backgrounds constitute 2.7% of the total sample.
4. The heavy flavour template is obtained from data by requiring that the muon is not
consistent with originating from the primary vertex (IP > 80 µm). The normalisation
is determined from data applying all requirements except for the impact parameter
and fitting the resulting IP distribution to the two templates shown in figure 3: the
pseudo-W data to describe the signal, and the simulated heavy flavour events to
describe the background. The heavy flavour contribution is estimated to be (0.4 ±
0.2)% of the total sample.
5. The punch-through contribution from kaons and pions is largely suppressed by the
requirement on E/pc. The E/pc distribution in figure 4 is fitted to pseudo-W data
for the signal, and a Gaussian for the punch-through, in order to estimate the punchthrough contribution. This is found to be negligible (0.02 ± 0.01)% of the total
sample, and also has a shape very similar to the decay-in-flight component. Hence,
this component is not considered when determining the signal yield.
6. The decay-in-flight shape is found from data in a two-step procedure using all events
selected throughout 2010 by any trigger requirement. First, tracks with a transverse momentum between 20 and 70 GeV/c are taken to describe the pT spectrum
of hadrons; tracks that fired a muon trigger are excluded from the sample. Second,
this spectrum is weighted according to the probability for a hadron to decay-in-flight.
This probability is defined as the fraction of tracks identified as muons in randomly
triggered events and is parametrised as a function of the momentum, p, by a function
of the form
1 − e−α/p ,
(3.1)
–9–
JHEP06(2012)058
2. The shape of the template of the largest background, Z → µµ, is taken from the
Z-MC. The normalisation is fixed from data by counting the number of Z events,
scaled by the ratio of events with one muon in the LHCb acceptance to events with
both muons in the acceptance, as determined from Z-MC. The ratio is corrected for
the different reconstruction and selection efficiencies for W and Z as derived from
data. This gives an expectation of 2435 ± 101 background events ((9.3 ± 0.4)% of the
total sample) in good agreement with 2335 ± 25 events found from simulation.
as would be expected for a particle whose mean lifetime in the laboratory frame scales
with its boost. Consistent values for α are found in each pseudorapidity bin and are
in agreement with a calculation of the decay probability based on the mean lifetimes
for charged pions and kaons, and the distance to the electromagnetic calorimeter
before which the hadron must have decayed. The average of the determinations in
each pseudorapidity bin defines the central value for α. The relative normalisation of
positively to negatively charged tracks in each bin of pseudorapidity is fixed to that
observed in randomly triggered events, but the overall normalisation in each bin of
pseudorapidity is left free.
4
4.1
Cross-section measurement
Cross-section definition
Cross-sections are quoted in the kinematical range defined by the measurements. The
cross-sections are measured in bins of η µ for the W and in bins of y Z in case of the Z. The
cross-section in a given bin of y Z (η µ ) is defined as
σZ→µµ (y Z ) =
Z
ρZ fFSR
LAZ
N Z (ηiµ , ηjµ )
ηiµ ,ηjµ
εZ (ηiµ , ηjµ )
,
σW →µν (η µ ) =
W NW
ρW fFSR
,
LAW εW
(4.1)
where N Z (ηiµ , ηjµ ) is the number of Z candidates in the respective y Z bin with the two
muons in the bins ηiµ and ηjµ being reconstructed with the efficiency εZ (ηiµ , ηjµ ). Similarly,
N W is the number of W candidates with the muon in the η µ bin. The purity of the sample
(ρZ(W ) ), the acceptance (AZ(W ) ), the correction factor for final state radiation (FSR)
Z(W )
(fFSR ) and the efficiency (εW ) are determined per bin; L is the integrated luminosity.
The total cross-section is obtained by summing the contributions of the five y Z or η µ bins.
4.2
Signal efficiencies
The data are corrected for efficiency losses due to track reconstruction, muon identification,
and trigger requirements for both analyses. There is an additional selection efficiency in
the W analysis due to the requirements on the number of additional muons, IP, E/pc,
cone
pcone
T , ET , and on TT hits. All efficiencies are determined from data.
– 10 –
JHEP06(2012)058
The default fit has 15 free parameters: five parameters for the normalisation of W + in
each of the pseudorapidity bins, five parameters for W − , and five parameters for the
contribution coming from the decay-in-flight. The normalisation of the other sources is
fixed. The result of the fit is shown in figure 5. Integrated over both charges and pµT it
is found that (44.3 ± 1.2)% of the total sample is due to W + , (34.9 ± 1.1)% due to W − ,
(8.5 ± 0.8)% due to the decay-in-flight contribution and the remainder due to the other
backgrounds. The χ2 /ndf of the fit is 1.002. The fit is repeated with the Z → µµ and
W → µν template corrected with Resbos instead of NNLO, yielding (43.6 ± 1.2)% for W +
and (34.4 ± 1.1)% for W − with χ2 /ndf = 0.983. The average of the two fits, which gives
+
−
a purity ρW = 0.788 ± 0.021 for W + and ρW = 0.784 ± 0.025 for W − , is taken for the
final result; half of the difference is taken as the systematic uncertainty.
20 30 40 50 60 70 20 30 40 50 60 70
K/ π → µ ν
Data
µµ+
LHCb
(a)
700
600
Fit
Z → µµ
W → µν
W → τν & Z → ττ
Heavy Flavour
500
400
Events / (1 GeV/c)
Events / (1 GeV/c)
800
300
250
20 30 40 50 60 70 20 30 40 50 60 70
µµ+
LHCb
(b)
200
150
100
200
50
100
20 30 40 50 60 70 20 30 40 50 60 70
p µ [GeV/c]
2.5 < ηµ < 3.0
T
220 20 30 40 50 60 70 20 30 40 50 60 -70
µ
µ+
200 LHCb
(d)
180
160
140
120
100
80
60
40
20
0
20 30 40 50 60 70 20 30 40 50 60 70
p µ [GeV/c]
3.0 < ηµ < 3.5
T
Events / (1 GeV/c)
Events / (1 GeV/c)
(c)
250
200
150
100
50
0
100
LHCb
µ+
µ-
(e)
80
60
Events / (1 GeV/c)
20 30 40 50 60 70 20 30 40 50 60 70
µµ+
LHCb
300
25
µ+
µ-
(f)
20
15
40
10
20
5
0
20 30 40 50 60 70 20 30 40 50 60 70
p µ [GeV/c]
3.5 < ηµ < 4.0
T
LHCb
0
20 30 40 50 60 70 20 30 40 50 60 70
p µ [GeV/c]
4.0 < ηµ < 4.5
T
Figure 5. Distribution of muon pT for positively (left panel) and negatively (right panel) charged
muons in W candidate events, for the total fiducial cross-section (a). The plots (b) to (f) give
the same information for the different η µ bins. The data (points) are compared to the fitted
contributions from W − and W + (light shaded). The background contributions are, from top to
bottom in the legend: decay-in-flight, Z → µµ, τ decays of W and Z, and heavy flavour decays.
The efficiencies for track reconstruction and muon identification are obtained using a
tag-and-probe method in the Z sample. One of the muons in the Z sample (tag) satisfies all
the track criteria. The other muon (probe) is selected with looser criteria that depend on the
efficiency to be measured. The invariant mass of the dimuon candidates, reconstructed from
the tag and the probe muons, must lie in the window of 20 GeV/c2 around the nominal Z
mass. The tracking efficiency, which accounts for track reconstruction and the track quality
– 11 –
JHEP06(2012)058
20 30 40 50 60 70 20 30 40 50 60 70
µ
p µ [GeV/c]
2.0 < η < 2.5
T
Events / (1 GeV/c)
0
20 30 40 50 60 70 20 30 40 50 60 70
p µ [GeV/c]
2.0 < η < 4.5
T
µ
requirements, is studied using well reconstructed tracks in the muon stations which are
linked to hits in TT. The average track finding efficiency is about 90% in the Z sample and
about 86% for the muon in W events. The tracking efficiency for W is lower due to the more
restrictive cuts on the track quality. The muon identification efficiency is determined with
tracks without the muon identification requirement for the probe muon. The average single
muon efficiency is above 99%. Both the tracking and the muon identification efficiencies
agree with simulation within errors.
The W selection requires that there are no other muons with pµT > 2 GeV/c, pcone
<
T
cone
2 GeV/c, ET < 2 GeV, IP < 40 µm, and E/pc < 0.04. The selection efficiency is determined from the fraction of pseudo-W events that pass these requirements. A similar
method is used to evaluate the efficiency for the requirement of TT hits associated to the
muon track of the W candidate. Simulation studies show that with the exception of the
E/pc distribution, the pseudo-W data provide a consistent description of W → µν simulation, as shown in figures 2 and 3. However, the harder muon pT spectrum in pseudo-W
data leads to slightly lower values of E/pc than for muons produced in W decays. The
simulation is used to determine this difference, which is only significant for η µ between 2.0
and 2.5, where the efficiency for W events is estimated to be 2.1% lower than for pseudo-W
data. The selection efficiency is about 67% for 2.5 < η µ < 4.0 and drops to about 53% and
33% for the two bins at the edge of the acceptance with 2.0 < η µ < 2.5 and 4.0 < η µ < 4.5,
respectively.
All the efficiencies have been checked for possible dependences on pµT , the azimuthal
angle of the muon, magnet polarity, and η µ . Only the latter exhibits a significant dependence, which is taken into account. Since any charge bias of the efficiencies would directly
influence the measurement of the lepton charge asymmetry, it was checked there is no
significant charge dependence within the uncertainties of the efficiencies. The efficiency
corrections are applied as a function of the pseudorapidity of the muons except the GEC.
The efficiencies are uncorrelated between pseudorapidity bins but correlated for W + ,
W − and Z. These correlations are taken into account for the measurement of the lepton
charge asymmetry and the cross-section ratios.
– 12 –
JHEP06(2012)058
The trigger efficiency contains two components, the first due to the efficiency of the
single muon trigger and the other due to the global event cuts (GEC). The single muon
trigger efficiency is determined using the Z → µµ sample. One muon is required to fire
the single muon trigger. The trigger response of the other muon then defines the trigger
efficiency. The requirement on the occupancy of the events depends on the multiplicity
of the primary interactions. It was checked with a sample which did not have the GEC
applied, that no events are lost if there is only one primary vertex reconstructed. The GEC
efficiency as a function of the number of primary vertices is determined by adding randomly
triggered events to events with Z (W ) candidates with one primary vertex; on average it
amounts to 93%. The overall trigger efficiency is calculated for each event depending on
the lepton pseudorapidity and the primary vertex multiplicity. It is found to be about 88%
for the Z and 75% for the W sample.
4.3
Acceptance
4.4
Luminosity
The absolute luminosity scale was measured at specific periods during the data taking,
using both Van der Meer scans [28] where colliding beams are moved transversely across
each other to determine the beam profile, and a beam-gas imaging method [29, 30]. For the
latter, reconstructed beam-gas interaction vertices near the beam crossing point determine
the beam profile. Both methods give similar results and are estimated to have a precision of
order 3.5%. The knowledge of the absolute luminosity scale is used to calibrate the number
of tracks in the VELO, which is found to be stable throughout the data-taking period and
can therefore be used to monitor the instantaneous luminosity of the entire data sample.
The dataset for this analysis corresponds to an integrated luminosity of 37.1 ± 1.3 pb−1 .
4.5
Corrections to the data
The measured cross-sections are corrected to Born level in quantum electrodynamics (QED)
in order to provide a consistent comparison with NLO and NNLO QCD predictions, which
do not include the effects of FSR. Corrections have been estimated using Photos [31] interfaced to Pythia. The Pythia pT spectrum of the electroweak boson has been reweighted
to the NNLO spectrum as determined with Dynnlo [23]. The correction is taken as the
number of events within the fiducial cuts of the measurements after FSR divided by the
number of events generated within the fiducial cuts.
Pythia simulation is used to study bin-to-bin migrations for η µ and y Z . No significant
net migration is observed and no correction is applied.
4.6
Systematic uncertainties
Aside from the uncertainty on the luminosity measurement, the main sources of experimental uncertainties come from the efficiency determinations and the background estimate
in the W analysis. The following sources have been considered:
1. The relative uncertainties of the tracking, muon identification, trigger and GEC efficiencies are added in quadrature. They lead to a systematic uncertainty for the total
cross-sections of 4.3% (2.2%, 2.0%) for the Z (W + , W − ).
2. The statistical uncertainty on the efficiency of the additional selection cuts for the W
analysis translates into a 1.8% (1.7%) systematic uncertainty on the total W + (W − )
cross-section.
– 13 –
JHEP06(2012)058
The selection criteria for the W and Z define the fiducial region of the measurement.
Simulated events are used to determine the acceptance A, defined as A = Nrec /Ngen .
Here, Nrec is the number of reconstructed events satisfying the cuts on the pseudorapidity
and the minimal momenta of the reconstructed muons, as well as on the dimuon mass in
the case of the Z analysis. Similarly, Ngen is the number of generated events with the cuts
applied on the generated muons. The acceptance is estimated with W -MC and Z-MC. It
is found to be consistent with unity for the Z and above 0.99 for the W analysis. For the
latter, the acceptance corrects for the small loss of events with pµT > 70 GeV/c.
Source
∆σZ→µµ (%) ∆σW + →µ+ ν (%) ∆σW − →µ− ν¯ (%)
Signal purity
±0.1
±1.2
±0.9
Template shape (fit)
—
±0.9
±1.0
Efficiency (trigger, tracking, muon id)
±4.3
±2.2
±2.0
Additional selection
—
±1.8
±1.7
FSR correction
±0.02
±0.01
±0.02
Total
±4.3
±3.2
±2.9
Luminosity
±3.5
±3.5
±3.5
3. The uncertainty of the background contribution for the Z analysis is small; the
uncertainty in the determination of the sample purity leads to a 0.1% uncertainty on
the total cross-section.
4. Both the shape and normalisations of the templates used in the W fit are considered
as an additional source of uncertainty. To determine this systematic uncertainty
each of the following sources is varied in turn, the data are refitted to determine the
fraction of W + and W − events, and the deviations from the original signal yield are
combined in quadrature. The following variations are made:
• the difference of the two fits using different W and Z templates (see section 3.5)
leads to a variation on the W fractions of 0.8%;
• the normalisation of the Z component was changed by the statistical uncertainty
with which it was determined, leading to a variation in the W fractions of 0.3%;
• the normalisation of the W → τ ν template was changed by the statistical uncertainty with which it was determined, leading to a negligible change in the W
fractions, since this template shape is very similar to the decay-in-flight template
which is allowed to vary in the fit;
• the heavy flavour template has also been changed by the statistical uncertainty
with which it was determined leading to a negligible change in the W fractions;
• instead of leaving the relative normalisation of the decays-in-flight template
between pseudorapidity bins to be free in the fit, this is fixed to the values
observed in randomly triggered events, and the full fit performed with a single
free parameter for the background; the W fractions change by 0.2%;
• the shape of the decay-in-flight template has been changed using different values
for α (see eq. (3.1)) to describe the decay probability, corresponding to different
regions in which the hadron must have decayed;3 no difference in the W fractions
is observed.
3
Three different decay regions have been considered: from the interaction point, from the VELO and
from the TT stations up to the electromagnetic calorimeter.
– 14 –
JHEP06(2012)058
Table 1. Contributions to the systematic uncertainty for the total Z and W cross-sections. The
different contributions are discussed in section 4.6
5. The uncertainty on the FSR correction is evaluated for each bin as the maximum
of the statistical uncertainty of the correction factor and the difference between the
weighted and unweighted FSR correction factor.
The sources of systematic uncertainties are summarised in table 1, together with the size
of the resultant uncertainty on the W and Z total cross-sections. The total systematic
uncertainty is the sum of all contributions added in quadrature.
5
Results
σZ→µµ
σW + →µ+ ν
σW − →µ− ν¯
=
=
=
76.7 ± 1.7 ± 3.3 ± 2.7 pb
831 ± 9 ± 27 ± 29 pb
656 ± 8 ± 19 ± 23 pb ,
where the first uncertainty is statistical, the second systematic and the third is due to the
luminosity. All the measurements are dominated by the luminosity and the systematic
uncertainty. The latter is dominated by the limited number of events for the background
templates and in the determination of the efficiencies.
The ratios RW = σW + →µ+ ν /σW − →µ− ν¯ and RW Z = (σW + →µ+ ν + σW − →µ− ν¯ )/σZ→µµ
are measured to be
RW
RW Z
=
=
1.27 ± 0.02 ± 0.01
19.4 ± 0.5 ± 0.9 .
Here, the uncertainty from the luminosity completely cancels. The systematic uncertainty
on the trigger, muon identification, tracking and selection efficiencies, as well as the uncertainty on the purity are assumed to be fully correlated between W + and W − . No
correlation is assumed between the η µ bins, except for the purity. The uncertainty on the
Z cross-section from the reconstruction efficiency is correlated between boson rapidity bins.
The correlation of the uncertainty on the efficiencies between W and Z are estimated with
MC simulation to be 90%. The full correlation matrix is given in the appendix (table 2).
The ratio of the W to Z cross-section is measured, for each charge separately, to be
σW + →µ+ ν /σZ→µµ
σW − →µ− ν¯ /σZ→µµ
=
=
10.8 ± 0.3 ± 0.5
8.5 ± 0.2 ± 0.4 .
A summary of the measurements of the inclusive cross-sections σW + →µ+ ν , σW − →µ− ν¯
and σZ→µµ , and the ratios is shown in figure 6. The measurements are shown as a band
which represents the total and statistical uncertainties.
The results are compared to theoretical predictions calculated at NNLO with the
program Dynnlo [23] for the NNLO PDF sets of MSTW08 [32], ABKM09 [33], JR09 [34],
HERA15 [12] and NNPDF21 [35] and at NLO for the NLO PDF set CTEQ6m [16].4 The
4
Dynnlo sets αs to the value of αs at the mass of the Z boson as given by the different PDF sets.
– 15 –
JHEP06(2012)058
The inclusive cross-sections for Z → µµ and W → µν production for muons with pµT >
20 GeV/c in the pseudorapidity region 2.0 < η µ < 4.5 and, in the case of Z, the invariant
mass range 60 < Mµµ < 120 GeV/c2 are measured to be
LHCb, s = 7 TeV
Data stat
Data tot
65
MSTW08
ABKM09
JR09
70
700
75
750
600
17
9
7
850
1.2
18
19
8
20
σW - → µ-ν [pb]
750
21
1.5
22
23
9.5
σW + → µ+ν
σ W - → µ -ν
σ W + → µ + ν + σ W - → µ -ν
σZ → µµ
σW + → µ+ν
σZ → µµ
12
9
σZ → µµ [pb]
σW + → µ+ν [pb]
1.4
11
8.5
90
950
700
1.3
10
7.5
85
900
650
1.1
16
80
10
σ W - → µ -ν
σZ → µµ
Figure 6. Measurements of the Z, W + and W − cross-section and ratios, data are shown as
bands which the statistical (dark shaded/orange) and total (light hatched/yellow) errors. The
measurements are compared to NNLO and NLO predictions with different PDF sets for the proton,
shown as points with error bars. The PDF uncertainty, evaluated at the 68% confidence level, and
the theoretical uncertainties are added in quadrature to obtain the uncertainties of the predictions.
scale uncertainties are estimated by varying the renormalisation and factorisation scales by
factors of two around the nominal value, which is set to the boson mass. The uncertainties
for each set correspond to the PDF uncertainties at 68% and the scale uncertainties added
in quadrature.5
While the W − and Z cross-sections are well described by all predictions, the W +
cross-section is slightly overestimated by the ABKM09 and NNPDF21 PDF sets. The ratio of the W − to Z cross-sections agrees reasonably well with the predictions, but the W +
to the Z ratio is overestimated by most of the predictions. The systematic uncertainties
for the RW almost cancel and also the theoretical uncertainties are much reduced. The
RW measurement tests the Standard Model predictions with a precision of 1.7% which is
comparable to the uncertainty of the theoretical prediction. The ABKM09 prediction overestimates this ratio while all the other predictions agree with the measurement. Differential
distributions are measured in five bins in y Z for the Z and of η µ for the W. Figure 7 shows
the differential cross-section as a function of the rapidity of the Z boson together with
5
The uncertainties for the PDF set from CTEQ6m which is given at 90% CL are divided by 1.645.
– 16 –
JHEP06(2012)058
550
800
pµ > 20 GeV/c
T
µ
2.0 < η < 4.5
Z: 60 < mµµ < 120 GeV/c2
NNPDF21
HERA15
CTEQ6M (NLO)
d σZ → µµ/dyZ [pb]
80
LHCb, s = 7 TeV
70
60
Data stat
MSTW08
Data tot
ABKM09
JR09
50
NNPDF21
HERA15
40
CTEQ6M (NLO)
30
20
10
0
2
2.5
3
3.5
4
4.5
yZ
d σW → µν/dηµ [pb]
Figure 7. Differential cross-section for Z → µµ as a function of y Z . The dark shaded (orange)
bands correspond to the statistical uncertainties, the light hatched (yellow) band to the statistical
and systematic uncertainties added in quadrature. Superimposed are NNLO (NLO) predictions with
different parametrisations for the PDF as points with error bars; they are displaced horizontally for
presentation.
800
LHCb, s = 7 TeV
W + → µ +ν
MSTW08
W + → µ +ν
ABKM09
Data stat
700
Data tot
-
W → µ-ν
Data stat
W → µ-ν
Data tot
600
500
JR09
NNPDF21
HERA15
400
CTEQ6M (NLO)
300
200
100
0
p µ > 20 GeV/c
T
2
2.5
3
3.5
4
4.5
ηµ
Figure 8. Differential W cross-section in bins of muon pseudorapidity. The dark shaded (orange)
bands correspond to the statistical uncertainties, the light hatched (yellow) band to the statistical
and systematic uncertainties added in quadrature. Superimposed are NNLO (NLO) predictions as
described in figure 7.
– 17 –
JHEP06(2012)058
p µ > 20 GeV/c
T
2.0 < ηµ < 4.5
60 < Mµµ < 120 GeV/c2
Aµ
0.6
p µ > 20 GeV/c
T
0.4
0.2
0
-0.2
LHCb, s = 7 TeV
Data stat
MSTW08
Data tot
ABKM09
JR09
HERA15
CTEQ6M (NLO)
-0.6
0
1
2
3
4
ηµ
RW
Figure 9. Lepton charge asymmetry Aµ = (σW + →µ+ ν − σW − →µ− ν¯ )/(σW + →µ+ ν + σW − →µ− ν¯ )
in bins of muon pseudorapidity. The dark shaded (orange) bands correspond to the statistical
uncertainties, the light hatched (yellow) band to the statistical and systematic uncertainties added
in quadrature. Superimposed are NNLO (NLO) predictions as described in figure 7. The MSTW08
values for η µ < 2 represent the central value of the prediction.
2
1.8
1.6
1.4
1.2
1
0.8
0.6
0.4
0.2
0
0
p µ > 20 GeV/c
T
LHCb, s = 7 TeV
Data stat
MSTW08
Data tot
ABKM09
JR09
NNPDF21
HERA15
CTEQ6M (NLO)
1
2
3
4
ηµ
Figure 10. RW = σW + →µ+ ν /σW − →µ− ν¯ in bins of muon pseudorapidity. The dark shaded (orange)
bands correspond to the statistical uncertainties, the light hatched (yellow) band to the statistical
and systematic uncertainties added in quadrature. Superimposed are NNLO (NLO) predictions
with different parametrisations as described in figure 7. The MSTW08 values for η µ < 2 represent
the central value of the prediction.
– 18 –
JHEP06(2012)058
NNPDF21
-0.4
6
Conclusions
√
Measurements of inclusive W and Z boson production in pp collisions at s = 7 TeV
with final states containing muons have been performed using 37 pb−1 of data collected
with the LHCb detector. The inclusive cross-sections have been measured separately
for W + and W − production as well as the ratios σW + →µ+ ν /σW − →µ− ν¯ and (σW + →µ+ ν +
σW − →µ− ν¯ )/σZ→µµ and the lepton charge asymmetry (σW + →µ+ ν −σW − →µ− ν¯ )/(σW + →µ+ ν +
σW − →µ− ν¯ ). The results have been compared to five next-to-next-to-leading order QCD
predictions with different sets for the parton density functions of the proton and to one
calculation at next-to-leading order. There is general agreement with the predictions,
though some of the PDF sets overestimate the ratios of the cross-sections. The ratio
σW + →µ+ ν /σW − →µ− ν¯ =1.27 ± 0.02 ± 0.01 is measured precisely and allows the Standard
Model prediction to be tested with an accuracy of about 1.7%, comparable to the uncertainty on the theory prediction. These represent the first measurements of the W and Z
production cross-sections and ratios in the forward region at the LHC, and will provide
valuable input to the knowledge of the parton density functions of the proton. The uncertainty on the cross-section measurements is dominated by systematic uncertainties. Since
most of these are statistical in nature, the accuracy on the measurement with further data
is expected to significantly improve.
– 19 –
JHEP06(2012)058
NNLO (NLO) predictions with different parametrisation for the PDFs of the proton. The
predictions agree with the measurements within uncertainties though all the predictions
are lower than the measured cross-section for 2.5 < η µ < 3.0. The differential cross-sections
are listed in table 3 in the appendix.
The differential distribution of the W + and W − cross-section, the lepton charge asymmetry Aµ and the ratio RW as a function of the muon pseudorapidity are shown in figures 8, 9 and 10 and listed in tables 4 to 6 as a function of pµT . The measurement of
the charge asymmetry and the W ratio provides important additional information on the
PDFs particularly on the valence quark distributions [11].
Since the inclusive cross-section for W + is larger than for W − , due to the excess of u
over d quarks in the proton, the overall asymmetry is positive. The asymmetry and the
W cross-sections strongly vary as a function of the pseudorapidity of the charged lepton,
and Aµ even changes sign, owing to differing helicity dependence of the lepton couplings to
the boson. This behaviour is reflected in the differential W cross-sections, where at large
muon pseudorapidities the W − cross-section is higher than the W + cross-section, as a
consequence of the V − A structure of the W to lepton coupling. The cross-section and the
asymmetry measurements are compared to the NNLO (NLO) predictions with different
parameterisation for the PDFs. The ABKM09 prediction overestimates the measured
asymmetry in three of the five bins. The other predictions describe the measurement
within uncertainties.
The asymmetry is also measured for two higher pµT thresholds for the muons, at 25
and 30 GeV/c. The result is shown in figure 11 and listed in table 5. The NNLO prediction
with MSTW08 parametrisation for the PDF also describes the measured asymmetry with
the higher cuts on the transverse momentum of the muon.
Aµ
0.6
p µ > 25 GeV/c
T
0.4
0.2
0
-0.2
Data tot
Aµ
-0.6
2
2.5
3
3.5
0.6
4
4.5
ηµ
p µ > 30 GeV/c
T
0.4
0.2
0
-0.2
LHCb, s = 7 TeV
Data stat
MSTW08
-0.4
Data tot
-0.6
2
2.5
3
3.5
4
4.5
ηµ
Figure 11. Lepton charge asymmetry Aµ = (σW + →µ+ ν − σW − →µ− ν¯ )/(σW + →µ+ ν + σW − →µ− ν¯ ) for
muons with pµT >25 (top) and 30 GeV/c (bottom), respectively in bins of muon pseudorapidity. The
dark shaded (orange) bands correspond to the statistical uncertainties, the light hatched (yellow)
band to the statistical and systematic uncertainties added in quadrature. The statistical uncertainty
is undistinguishable from the total uncertainty. Superimposed are the NNLO predictions with the
MSTW08 parametrisation for the PDF.
Acknowledgments
We express our gratitude to our colleagues in the CERN accelerator departments for the
excellent performance of the LHC. We thank the technical and administrative staff at
CERN and at the LHCb institutes, and acknowledge support from the National Agencies: CAPES, CNPq, FAPERJ and FINEP (Brazil); CERN; NSFC (China); CNRS/IN2P3
(France); BMBF, DFG, HGF and MPG (Germany); SFI (Ireland); INFN (Italy); FOM
– 20 –
JHEP06(2012)058
LHCb, s = 7 TeV
Data stat
MSTW08
-0.4
and NWO (The Netherlands); SCSR (Poland); ANCS (Romania); MinES of Russia and
Rosatom (Russia); MICINN, XuntaGal and GENCAT (Spain); SNSF and SER (Switzerland); NAS Ukraine (Ukraine); STFC (United Kingdom); NSF (U.S.A.). We also acknowledge the support received from the ERC under FP7 and the Region Auvergne.
Tables of results
3 < η µ (y Z ) < 3.5
3.5 < η µ (y Z ) < 4
4 < η µ (y Z ) < 4.5
2 < η µ (y Z ) < 2.5
2.5 < η µ (y Z ) < 3
1
W−
0.87
1
Z
0.36
0.34
1
W+
0.02
0.02
0.35
1
W−
0.02
0.02
0.35
0.90
1
Z
0.47
0.44
0.45
0.45
0.45
1
W+
0.02
0.03
0.24
0.02
0.02
0.31
1
W−
0.02
0.02
0.29
0.02
0.02
0.37
0.89
1
Z
0.46
0.43
0.44
0.45
0.44
0.58
0.31
0.37
1
W+
0.04
0.05
0.35
0.04
0.04
0.45
0.05
0.04
0.44
1
W−
0.02
0.02
0.40
0.02
0.01
0.52
0.02
0.02
0.51
0.80
1
Z
0.32
0.29
0.30
0.30
0.30
0.39
0.21
0.25
0.39
0.30
0.35
1
W+
0.07
0.09
0.19
0.07
0.07
0.24
0.09
0.07
0.24
0.15
0.06
0.16
1
W−
0.01
0.01
0.28
0.01
0.01
0.37
0.01
0.01
0.36
0.02
0.01
0.24
0.57
1
Z
0.03
0.03
0.03
0.03
0.03
0.04
0.02
0.03
0.04
0.03
0.04
0.03
0.02
0.03
1
W+
W−
Z
W+
W−
Z
W+
W−
Z
W+
W−
Z
W+
W−
Z
3.5 < η µ (y Z ) < 4
3 < η µ (y Z ) < 3.5
2.5 < η µ (y Z ) < 3
W+
Table 2. Correlation coefficients between W + , W − and Z in the five bins considered. The
luminosity uncertainty is not included.
– 21 –
JHEP06(2012)058
2 < η µ (y Z ) < 2.5
4 < η µ (y Z ) < 4.5
A
yZ
dσZ→µµ /dy Z [pb]
Z
fFSR
2.0 − 2.5
25.5
±1.4
±1.0
±0.9
1.020 ± 0.001
2.5 − 3.0
66.8
±2.3
±2.7
±2.3
1.018 ± 0.001
3.0 − 3.5
49.8
±2.0
±2.2
±1.7
1.018 ± 0.001
3.5 − 4.0
11.1
±0.9
±0.6
±0.4
1.024 ± 0.001
4.0 − 4.5
0.074
±0.074
±0.004
±0.002
1.027 ± 0.027
ηµ
W+
W−
dσW →µν /η µ [pb]
W
fFSR
2.0 − 2.5
691
±12
±37
±24
1.0146 ± 0.0004
2.5 − 3.0
530
±9
±30
±19
1.0086 ± 0.0002
3.0 − 3.5
296
±7
±23
±10
1.0107 ± 0.0006
3.5 − 4.0
121
±5
±19
±4
1.0097 ± 0.0005
4.0 − 4.5
23.1
±3.2
±4.9
±0.8
1.0009 ± 0.0009
2.0 − 2.5
393
±9
±22
±13
1.0147 ± 0.0008
2.5 − 3.0
370
±8
±20
±13
1.0163 ± 0.0004
3.0 − 3.5
282
±7
±18
±10
1.0147 ± 0.0004
3.5 − 4.0
200
±6
±14
±7
1.0173 ± 0.0008
4.0 − 4.5
68
±5
±10
±2
1.0194 ± 0.0009
Table 4. Differential W → µν cross-section, dσW →µν /η µ , in bins of lepton pseudorapidity. The first
cross-section uncertainty is statistical, the second systematic, and the third due to the uncertainty
W
on the luminosity determination. The correction factor fFSR
which is used to correct for FSR is
listed separately.
ηµ
Aµ (pµT >20 GeV/c)
Aµ (pµT >25 GeV/c)
Aµ (pµT >30 GeV/c)
2.0−2.5 0.275
±0.014 ±0.003
0.256
±0.015 ±0.002
0.238
±0.018 ±0.002
2.5−3.0 0.178
±0.013 ±0.002
0.195
±0.015 ±0.001
0.219
±0.017 ±0.001
3.0−3.5 0.024
±0.016 ±0.009
0.054
±0.018 ±0.003
0.112
±0.022 ±0.002
3.5−4.0 −0.247 ±0.022 ±0.011 −0.203 ±0.027 ±0.005 −0.124 ±0.035 ±0.003
4.0−4.5 −0.493 ±0.058 ±0.051 −0.413 ±0.081 ±0.016 −0.353 ±0.122 ±0.008
Table 5. Lepton charge asymmetry, Aµ , in bins of muon pseudorapidity for a pµT threshold at 20,
25 and 30 GeV/c. The first uncertainty is statistical and the second systematic. The effect of FSR
is at the level of 10−4 and is not listed.
– 22 –
JHEP06(2012)058
Table 3. Differential Z → µµ cross-section, dσZ→µµ /dy Z , in bins of boson rapidity. The first
cross-section uncertainty is statistical, the second systematic, and the third due to the uncertainty
Z
on the luminosity determination. The correction factor fFSR
which is used to correct for FSR is
listed separately.
ηµ
2.0 − 2.5
2.5 − 3.0
3.0 − 3.5
3.5 − 4.0
4.0 − 4.5
1.76
1.43
1.05
0.60
0.34
RW
±0.05
±0.04
±0.03
±0.03
±0.05
±0.01
±0.01
±0.02
±0.01
±0.05
Table 6. W cross-section ratio, RW = σW + →µ+ ν /σW − →µ− ν¯ , in bins of muon pseudorapidity. The
first error is statistical and the second systematic. The effect of FSR is at the level of 10−4 and is
not listed.
References
[1] ATLAS collaboration, G. Aad et al., Measurement of the W → lν and Z/γ ∗ → ll production
√
cross sections in proton-proton collisions at s = 7 TeV with the ATLAS detector, JHEP 12
(2010) 060 [arXiv:1010.2130] [INSPIRE].
[2] ATLAS collaboration, G. Aad et al., Measurement of the muon charge asymmetry from W
√
bosons produced in pp collisions at s = 7 TeV with the ATLAS detector, Phys. Lett. B 701
(2011) 31 [arXiv:1103.2929] [INSPIRE].
[3] CMS collaboration, S. Chatrchyan et al., Measurement of the inclusive W and Z production
√
cross sections in pp collisions at s = 7 TeV, JHEP 10 (2011) 132 [arXiv:1107.4789]
[INSPIRE].
[4] CMS collaboration, S. Chatrchyan et al., Measurement of the lepton charge asymmetry in
√
inclusive W production in pp collisions at s = 7 TeV, JHEP 04 (2011) 050
[arXiv:1103.3470] [INSPIRE].
[5] UA1 collaboration, C. Albajar et al., Intermediate vector boson cross-sections at the CERN
super proton synchrotron collider and the number of neutrino types, Phys. Lett. B 198
(1987) 271 [INSPIRE].
[6] UA2 collaboration, J. Alitti et al., A measurement of the W and Z production cross-sections
and a determination of γ (W ) at the CERN p¯p collider, Phys. Lett. B 276 (1992) 365
[INSPIRE].
[7] CDF collaboration, F. Abe et al., Measurement of σ · B(W → eν) and σ · B(Z 0 → e+ e− ) in
√
p¯
p collisions at s = 1.8 TeV, Phys. Rev. Lett. 76 (1996) 3070 [hep-ex/9509010] [INSPIRE].
[8] CDF collaboration, F. Abe et al., Measurement of Z 0 and Drell-Yan production cross section
√
using dimuons in p¯p collisions at s = 1.8 TeV, Phys. Rev. D 59 (1999) 052002 [INSPIRE].
[9] CDF collaboration, A. Abulencia et al., Measurements of inclusive W and Z cross sections
√
in p¯
p collisions at s = 1.96 TeV, J. Phys. G 34 (2007) 2457 [hep-ex/0508029] [INSPIRE].
– 23 –
JHEP06(2012)058
Open Access. This article is distributed under the terms of the Creative Commons
Attribution License which permits any use, distribution and reproduction in any medium,
provided the original author(s) and source are credited.
[10] D0 collaboration, B. Abbott et al., Extraction of the width of the W boson from
measurements of σ(p¯
p → W + X) × B(W → eν) and σ(p¯
p → Z + X) × B(Z → ee) and their
ratio, Phys. Rev. D 61 (2000) 072001 [hep-ex/9906025] [INSPIRE].
[11] E.L. Berger, F. Halzen, C. Kim and S. Willenbrock, Weak boson production at Tevatron
energies, Phys. Rev. D 40 (1989) 83 [Erratum ibid. D 40 (1989) 3789] [INSPIRE].
[12] H1 and ZEUS collaboration, F. Aaron et al., Combined measurement and QCD analysis of
the inclusive e+− p scattering cross sections at HERA, JHEP 01 (2010) 109
[arXiv:0911.0884] [INSPIRE].
[14] T. Sj¨
ostrand, S. Mrenna and P.Z. Skands, PYTHIA 6.4 physics and manual, JHEP 05
(2006) 026 [hep-ph/0603175] [INSPIRE].
[15] LHCb collaboration, M. Clemencic et al., The LHCb simulation application, Gauss: Design,
evolution and experience, J. Phys. Conf. Ser. 331 (2011) 032023 [INSPIRE].
[16] P.M. Nadolsky, H.-L. Lai, Q.-H. Cao, J. Huston, J. Pumplin, et al., Implications of CTEQ
global analysis for collider observables, Phys. Rev. D 78 (2008) 013004 [arXiv:0802.0007]
[INSPIRE].
[17] M. Bengtsson and T. Sj¨
ostrand, Parton showers in leptoproduction events, Z. Phys. C 37
(1988) 465 [INSPIRE].
[18] B. Andersson, G. Gustafson, G. Ingelman and T. Sj¨ostrand, Parton fragmentation and string
dynamics, Phys. Rept. 97 (1983) 31 [INSPIRE].
[19] GEANT4 collaboration, S. Agostinelli et al., GEANT4: a simulation toolkit, Nucl. Instrum.
Meth. A 506 (2003) 250 [INSPIRE].
[20] P. Nason, A new method for combining NLO QCD with shower Monte Carlo algorithms,
JHEP 11 (2004) 040 [hep-ph/0409146] [INSPIRE].
[21] S. Frixione, P. Nason and C. Oleari, Matching NLO QCD computations with parton shower
simulations: the POWHEG method, JHEP 11 (2007) 070 [arXiv:0709.2092] [INSPIRE].
[22] S. Alioli, P. Nason, C. Oleari and E. Re, A general framework for implementing NLO
calculations in shower Monte Carlo programs: the POWHEG BOX, JHEP 06 (2010) 043
[arXiv:1002.2581] [INSPIRE].
[23] S. Catani, L. Cieri, G. Ferrera, D. de Florian and M. Grazzini, Vector boson production at
hadron colliders: a fully exclusive QCD calculation at NNLO, Phys. Rev. Lett. 103 (2009)
082001 [arXiv:0903.2120] [INSPIRE].
[24] G. Ladinsky and C. Yuan, The nonperturbative regime in QCD resummation for gauge boson
production at hadron colliders, Phys. Rev. D 50 (1994) 4239 [hep-ph/9311341] [INSPIRE].
[25] C. Bal´
azs and C. Yuan, Soft gluon effects on lepton pairs at hadron colliders, Phys. Rev. D
56 (1997) 5558 [hep-ph/9704258] [INSPIRE].
[26] F. Landry, R. Brock, P.M. Nadolsky and C. Yuan, Tevatron Run-1 Z boson data and
Collins-Soper-Sterman resummation formalism, Phys. Rev. D 67 (2003) 073016
[hep-ph/0212159] [INSPIRE].
[27] T. Skwarnicki, A study of the radiative cascade transitions between the Υ and Υ resonances,
Ph.D. thesis, Institute of Nuclear Physics, Krakow Poland (1986) [DESY-F31-86-02].
– 24 –
JHEP06(2012)058
[13] LHCb collaboration, J. Alves, A. Augusto et al., The LHCb detector at the LHC, 2008
JINST 3 S08005 [INSPIRE].