DSpace at VNU: Surface-Enhanced Raman Spectroscopy Study of 4-ATP on Gold Nanoparticles for Basal Cell Carcinoma Fingerprint Detection
Bạn đang xem bản rút gọn của tài liệu. Xem và tải ngay bản đầy đủ của tài liệu tại đây (1.13 MB, 6 trang )
Journal of ELECTRONIC MATERIALS
DOI: 10.1007/s11664-016-4421-9
Ó 2016 The Minerals, Metals & Materials Society
Surface-Enhanced Raman Spectroscopy Study of 4-ATP
on Gold Nanoparticles for Basal Cell Carcinoma
Fingerprint Detection
LUU MANH QUYNH,1 NGUYEN HOANG NAM,1,2,4 K. KONG,3
NGUYEN THI NHUNG,1 I. NOTINGHER,3 M. HENINI,3
and NGUYEN HOANG LUONG2
1.—Faculty of Physics, Hanoi University of Science, Vietnam National University, Hanoi, 334
Nguyen Trai, Hanoi, Vietnam. 2.—Nano and Energy Center, Hanoi University of Science, Vietnam National University, Hanoi, 334 Nguyen Trai, Hanoi, Vietnam. 3.—School of Physics and
Astronomy, Nottingham University, University Park, Nottingham NG7 2RD, UK. 4.—e-mail:
The surface-enhanced Raman signals of 4-aminothiophenol (4-ATP) attached
to the surface of colloidal gold nanoparticles with size distribution of 2 to 5 nm
were used as a labeling agent to detect basal cell carcinoma (BCC) of the skin.
The enhanced Raman band at 1075 cmÀ1 corresponding to the C-S stretching
vibration in 4-ATP was observed during attachment to the surface of the gold
nanoparticles. The frequency and intensity of this band did not change when
the colloids were conjugated with BerEP4 antibody, which specifically binds to
BCC. We show the feasibility of imaging BCC by surface-enhanced Raman
spectroscopy, scanning the 1075 cmÀ1 band to detect the distribution of 4ATP-coated gold nanoparticles attached to skin tissue ex vivo.
Key words: Skin cancer, basal cell carcinoma, surface-enhanced Raman
scattering, gold nanoparticles
INTRODUCTION
Skin cancer is the most common type of cancer in
humans, and its incidence is increasing.1 Basal cell
carcinomas (BCCs) constitute approximately 74% of
skin cancer cases worldwide.2 The most efficient
treatment for ‘‘high-risk’’ BCCs (i.e. BCCs on the
face and neck or recurrent BCCs) is Mohs micrographic surgery (MMS).3 This procedure maximizes
the removal of tumor cells while sparing as much
healthy tissue as possible. Although MMS provides
improved outcomes compared to other treatment
options, the need for a pathologist or specialized
surgeon to diagnose frozen sections during surgery
has limited the widespread use of this approach,
leading to cases of inappropriate inferior treatment.
Frozen-section histopathology also requires laborious and time-consuming procedures, resulting in
(Received October 11, 2015; accepted February 20, 2016)
increased costs compared to standard excision of
BCC.
Raman spectroscopic imaging is a promising
technique for the diagnosis of skin cancers, given
its high sensitivity to molecular and structural
changes associated with cancer. The use of Raman
spectroscopy to detect biochemical alteration in skin
tissue caused by BCC was first demonstrated by
Gniadecka et al.4 Raster-scanning Raman spectral
mapping has been used to image BCC in tissue
samples ex vivo in MMS.5,6 However, raster-scanning Raman mapping requires long data acquisition
times, typically days for tissue specimens of
1 cm 9 1 cm. More recently, multimodal spectral
imaging based on tissue autofluorescence and
Raman spectroscopy has been used to reduce the
time for diagnosis of BCC to only 30–60 min, which
becomes feasible for use during MMS.7,8
An alternative technique that can reduce data
acquisition and BCC diagnosis time during MMS is
surface-enhanced Raman spectroscopy (SERS). It
Quynh, Nam, Kong, Nhung, Notingher, Henini, and Luong
was discovered that in the very close vicinity of
metal nanostructures, strongly increased Raman
scattering signals could be obtained, due mainly to
resonances between optical fields and the collective
oscillations of the free electrons in a metal. Since the
discovery of this surface-enhanced Raman (SER)
scattering in 1974,9 it has been recognized as a
powerful technique for biomedical applications. SER
scattering has been studied for cancer detection,10–12 and it has been widely used in molecular
structure analysis.13–16 For non-labeling agent
probes, Raman spectra were analyzed by measuring
the intrinsic signals to distinguish between healthy
and diseased regions.10,11 In these studies, SER
signals of cancer-specific biomolecules were
reported as effective indicators of the presence of
cancer genes10 and cancer expression.11 However,
the signals were still broadened, thus posing a
challenge in distinguishing the cancerous from noncancerous areas. It was noted that the SER peaks of
some linkages that were close to the metal surface
were strong, individually sharp, and did not change,
as the metal–organic complex was attached to other
organisms or molecules. In the present study, we
investigated the SER signal of 4-aminothiophenol
(4-ATP, sometimes called p-aminothiophenol
[PATP]) linked to the surface of gold nanoparticles
conjugated with the skin carcinoma cell antibody
BerEP4. With this BCC-specific antibody conjugation, SER signals of some linkages from the 4-ATP
organic molecules were noted to be stable and
potentially to allow detection of the tumor regions.
Here, we investigate the usefulness of these SERS
probes for the detection of BCC in ex vivo specimens.
EXPERIMENTS AND METHODS
Synthesis of Gold Nanoparticles Coated with
4-ATP (Au-4ATP)
Gold nanoparticles ranging in size from 2 to 5 nm
were prepared by a wet chemical process using
cetyltrimethylammonium bromide (CTAB; Merck,
99%). Specifically, ion Au3+ from chloroauric acid
(HAuCl4; Merck, 99%) was prepared in doubledistilled water. We placed 75 ml of CTAB 0.2 M and
0.2 ml of HAuCl4 0.5 M in a 200-ml flask, which was
then diluted with double-distilled water to obtain
100 ml of 1 mM HAuCl4 in 0.15 M CTAB. We used
sodium borohydride (NaBH4; Merck, 99%) 0.1 M to
reduce the dark yellow Au3+ ion-containing solution
to a dark brown. After 12 h, the solution had
changed to a dark red. Next, 4-ATP 10À3M (Merck,
99%) was injected into the solution at a 1:40 volume
rate. After 12 h, the solution was washed several
times by centrifugation. The resulting solution is
referred to as the Au-4ATP solution.
The structural and morphological properties of
the Au-4ATP sample were investigated using a
Bruker D5005 x-ray diffractometer (XRD) and
JEOL JEM-1010 transmission electron microscope
(TEM).
Conjugation of Au-4ATP with BerEP4 (Au4ATP-Antibody)
For antibody conjugation, 3 mg 1-ethyl-3-(3dimethylaminopropyl)carbodiimide
(EDC)
was
mixed with 1 mg BerEP4, and was then added to
the Au-4ATP solution. The mixture was incubated
for a minimum of 20 min until the Au-4ATP had
completely reacted with the BerEP4 molecules.
Skin Tissue Samples
Skin tissue sections were obtained from the
Nottingham University Hospitals National Health
Service Trust. Tissue sections were cut from blocks
removed during surgical procedures and sliced into
one-third thickness. Two of the three tissue slides
were investigated using an optical microscope with
bright-field imaging, with and without conventional
hematoxylin and eosin (H&E) staining. The third
slide was treated with the Au-4ATP-antibody complex before subjection to Raman microspectroscopy.
Raman Spectroscopic Measurements
Raman spectroscopic measurements were carried
out using a custom-made Raman microspectrometer
built by Notingher’s group.6 The laser power was set
to 20 mW to avoid sample damage, the scanning
interval was set from 600 cmÀ1 to 1700 cmÀ1, and
the integration time was set to 0.1 s.
SER Spectra of Au-4ATP and Au-4ATPAntibody
One drop each of the Au-4ATP and Au-4ATPantibody colloidal solutions were deposited on the
sample holder surface. The spectra of the samples
were observed separately and were then drawn in
one image to compare the differences.
Scanning Measurement of Au-4ATP-AntibodyTreated Tissue
For the third tissue sample, 1 lL of Au-4ATPantibody-containing solution was deposited onto the
surface of the sample. After conjugation of the
antibody with the cells for a period of 5 min, the
scanning measurement was initiated. SER scattering signals were collected for every 1 lm 9 1 lm on
a 40 lm 9 40 lm region of the tissue sample.
There were 1600 spots in total. All 1600 spectra
from the 1600 spots were collected and analyzed
using two methods. In the first, principal component
analysis was employed.17 In the second method, we
consider the peak at 1075 cmÀ1corresponding to a
stretching band of C-S linkage from the 4-ATP
molecules. Peak heights at 1075 cmÀ1 were mapped,
depending on the position of the single spots. This
landscape image was then examined as a fingerprinted image in comparison with normal brightfield images of the first two samples and with the
image obtained by principal component analysis.
Surface-Enhanced Raman Spectroscopy Study of 4-ATP on Gold Nanoparticles for Basal Cell
Carcinoma Fingerprint Detection
RESULTS AND DISCUSSION
Structure and Morphology of Gold
Nanoparticles
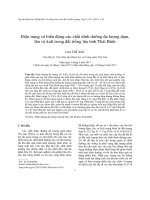
Figure 1 illustrates the XRD pattern and TEM
image of the as-prepared gold nanoparticles. The XRD
peaks at 38.2°, 44.4° and 64.7° indicate the (111), (200)
and (220) reflection phases of the fcc structure,
respectively. The calculated lattice parameter was
´˚
4.08 ± 0.05 A
, which agreed with earlier works.18,19
Using the Debye–Scherrer formula, a particle size of
4.2 nm was determined, in good agreement with the
results observed in the TEM image, where most of the
particles were distributed at 4 nm.
Gold Nanoparticles Surface Modification
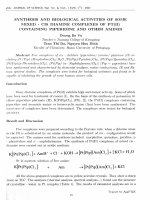
Figure 2 shows a schematic of the reaction
between the Au-4ATP and the carboxyl group
(–COOH) from the antibody BerEP4. Under the
catalytic effect of EDC, the free amino group (–NH2)
of the Au-4ATP colloid reacted with the carboxyl
group, and a peptide group (–NH–CO) was created.
This reaction created a stable covalent linkage
binding the gold nanoparticles and antibody to form
the Au-4ATP-antibody.
The Raman spectra of raw 4-ATP 10À3M and Au4ATP were observed (data not shown). Slight shifts
of the peaks were experienced as the 4-ATP
molecules were deposited on the surface of the Au
nanoparticles, which corresponds to the linking of
the molecules with the metal particles via the Au-S
bond. In addition, significant magnification of
Raman intensity was detected in the Au-4ATP
spectrum in comparison with that of the raw 4ATP. Our results show the greatest intensity
enhancement of approximately 105 times. Due to
the reaction shown in Fig. 2, some vibration modes
corresponding to the –NH2 disappeared and were
replaced by vibrations of the peptide linkage, with
the majority occurring in the BerEP4 molecules.
The electromagnetic field surrounding the metal
nanoparticles was enhanced from the surface plasmon resonance (SPR) effect, which increased the
Raman signal of the vibrations near the particle
surfaces.20,21 With the significantly increased
Raman signal in the SER scattering, it can then
be used to detect changes to the surface of each
colloid solution after linking the antibody with the
gold nanoparticles. When one –NH linkage from the
free NH2 was exchanged, and large BerEP4 molecules then attached to the surface of the gold
nanoparticles, some SER peaks containing –NH
vibrations disappeared, and peaks characterizing
the peptide link appeared, as shown in Fig. 3.
The SER spectra of Au-4ATP- and Au-4ATPantibody-containing samples are shown in Fig. 3.
We can clearly see that the Raman peaks of Au4ATP measured at 1495 cmÀ1, 1432 cmÀ1 and
1134 cmÀ1 disappeared after conjugation of the
Fig. 2. Schematic graph of peptide link created by the reaction. The
formation of the Au–S covalent bond is a well-known phenomenon,
linking the 4-ATP molecules to the surface of the gold nanoparticle
surfaces, and allowing the amino group (-NH2) to freely dissolve in
solution. After the reaction of the carboxyl groups (-COOH) from the
antibody BerEP4 molecules with the present catalyst EDC, peptide
(-NH-CO-) binding occurs. Here, RÀCOOH denotes the whole antibody, of which we consider the reaction of only one carboxyl group,
with RÀ remaining.
Fig. 1. (a) X-ray diffraction pattern of as-prepared gold nanoparticles. The black pattern shows the measurement data and the red vertical lines
show the standard diffraction positions of the (111), (200) and (220) planes of Au bulk material (pattern 4-784). (b) TEM image of as-prepared
gold nanoparticles. The dark gray and black dots show the presence of the nanoparticles in the sample. Inset: size distribution of the
nanoparticles calculated from the TEM image.
Quynh, Nam, Kong, Nhung, Notingher, Henini, and Luong
other organic molecules, because mCC vibrations are
quite common for organic systems.6,24 A sharp
individual peak at around 1075 cmÀ1 was detected
by Zheng et al. on the SERS spectrum of 4-ATP
absorbed on a silver surface,15 by Osawa et al. on
SERS spectrum of 4-ATP absorbed on a silver film,22
and by Jiao et al. on SERS spectrum of 4-ATP on an
Au surface.23,26 However, the peak at 1075 cmÀ1
was not detected on the SERS spectra of the
antibody and/or polypeptide on metal substrates.24,27 We propose the enhanced Raman peak
at 1075 cmÀ1 as a strong signal for the detection of
the position and concentration of Au-4ATP nanoparticles, and hence, of antibody molecules.
Fingerprinted Landscape of BCC Tissue
Fig. 3. SER spectra of Au-4ATP- and Au-4ATP-antibody-containing
samples.
antibody. These peaks were assigned to mCC + dCH,
mCC + dCH and dCH vibrations, respectively, where
m denotes stretching movement and d bending
movement.22,23 We suggest that the wagging vibration NH2 linkage (pNH2) may occur together with
these vibrations. The disappearance of the pNH2
vibration due to the reaction described in Fig. 2 may
be responsible for the disappearance of peaks at
1495 cmÀ1, 1432 cmÀ1 and 1134 cmÀ1. We also
observed the disappearance of a peak at
1382 cmÀ1 after the antibody conjugation. This
peak was assigned to the dCH + mCC vibration
modes.22,23 The change from the –CN– linkage to
the peptide linkage (-NH-CO-) may be responsible
for the disappearance of this peak. In addition, new
peaks arise at 1449 cmÀ1 and 1297 cmÀ1. The peak
at 1449 cmÀ1 is assigned to CH2, CH3 deformation,
and the peak at 1297 cmÀ1 is assigned to the
vibration of the helix structure of amide III linkage.24 We should note that Raman peaks below
1005 cmÀ1 were not considered because the peaks in
this region may also correspond to the phonon
vibrations of the metal material.
Owens et al. investigated enhanced Raman spectra of 4-ATP on an Au-substrate conjugated with
anti-p53 protein.25 The characteristic peak of C-S
linkage close to 1080 cmÀ1 was also employed as a
detection signal. When the 4-ATP-modified Au
surface was covalently connected with anti-p53
molecules, the peak position corresponding to the
C-S vibration observed at 1080 cmÀ1 shifted to a
higher wavenumber within 1 cmÀ1. After protein–
antibody interaction, the peak position shifted about
1 cmÀ1, depending on the added protein concentration. We observed the same effect in our Raman
investigation. As revealed in Fig. 3, the strongest
peak is observed at 1075 cmÀ1, which is assigned to
a mCS vibration, while a strong peak at 1614 cmÀ1 is
assigned to a mCC vibration.22,23 Interpretation of
the peak at 1614 cmÀ1may be easily confused with
As discussed in the ‘‘Experiments and Methods’’
section, skin tissue sections obtained from the
Nottingham University Hospitals National Health
Service Trust were cut from blocks removed during
surgical procedures, and were sliced into one-third
thickness. Two of three tissue slides were investigated using an optical microscope with bright-field
imaging, with and without conventional hematoxylin and eosin (H&E) staining. The third slide
was treated with the Au-4ATP-antibody complex as
described above, before it was subjected to investigation by Raman microspectroscopy. The SER scattering signal of every 1 lm 9 1 lm spot on a
40 lm 9 40 lm region of the tissue sample was
observed and analyzed using two methods. The first
was principal component analysis,17 in which the
SER spectra were compared to the averaged spectrum, and the difference was then shown in the
landscape. In the second method, the peak at
1075 cmÀ1 corresponding to the stretching band of
C-S linkage from 4-ATP molecules was considered.
Peak heights at 1075 cmÀ1 were mapped, depending
on the position of the single spots. The fingerprinted
landscape of SER signals of the Au-4ATP antibody
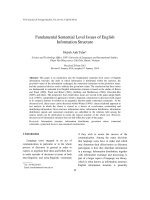
on BCC tissue is shown in Fig. 4.
In this work, simple H&E staining was used as
control diagnosis; the color image of the tissue is
shown in Fig. 4a. In this non-specific method
employed in Nottingham University Hospitals
National Health Service Trust, immunofluorescence
labeling has not been used, and only regions of
condensation on the tissue sample have been considered, where the areas of cancer cells may be
observed as dark-colored regions—for example, the
regions marked with the red circles as A1 and A2 in
Fig. 4. However, the diagnostic result is ultimately
the subjective decision of the pathologist, because
this method may lead to misinterpretation of noncancerous areas as cancer cells. As can be seen in
Fig. 4b, which shows the bright-field microscopic
result, with this sample, it is easy to confirm that
the B1 region corresponds to a hair follicle position,
and B2 does not, although B1 and B2 have the same
position on the tissue as the regions marked A1 and
Surface-Enhanced Raman Spectroscopy Study of 4-ATP on Gold Nanoparticles for Basal Cell
Carcinoma Fingerprint Detection
Fig. 4. Fingerprinted landscape of SER signals of Au-4ATP-antibody on BCC tissue. (a) Image of Gram-stained BCC tissue, where regions
marked A1 and A2 are the areas of suspected BCC. (b) Bright-field microscopy image of BCC tissue, where regions B1 and B2 are in the same
position on the tissue as regions A1 and A2, respectively. (c) SER signal landscape analyzed by the principal component method, where regions
C1 and C2 are in the same position on the tissue as regions A1 and A2, respectively. (d) The fingerprinted landscape of intensity of SER peaks at
1075 cmÀ1, where regions D1 and D2 are in the same position on the tissue as regions A1 and A2, respectively. The difference between D1 and
D2 shows that only the red-colored D2 and similar-colored area are diseased, while D1 is not. These results show that this method is a better
solution for intraoperative diagnosis.
A2 in Fig. 4a. Thus we see that the dark-colored A1
region can be misinterpreted. The results of principal component analysis of the SER signals are
illustrated in Fig. 4c, which shows a comparison of
the individual SER signals and then the difference
between the SER spectra and average spectrum. In
this landscape, the yellow to red areas, such as C1
and C2, can be considered as regions of cancer. The
C1 and C2 regions have the same position as the A1
and A2 and the B1 and B2 regions, respectively.
Figure 4d shows the results of the SER signal
analyzed using only the intensity of SER peaks at
1075 cmÀ1, with the D1 and D2 regions having the
same position as regions C1 and C2. With this
method, the antigen–antibody coupling orients the
Au-4ATP-antibody colloids close to the BCC surface,
and the carcinoma sections act as a dock at which
high concentrations of Au-4ATP-antibody particles
are distributed, and thus the SER peak intensity at
1075 cmÀ1 is higher in these areas. In Fig. 4d, we
can see the results of using the peak height of
1075 cmÀ1 for mapping the Au-4ATP-antibody
areas appearing within the 40 lm 9 40 lm region.
However, the D1 area in Fig. 4d does not show the
high intensity of the peak at 1075 cmÀ1, while the
other areas such as D2 indicate very high intensity.
Quynh, Nam, Kong, Nhung, Notingher, Henini, and Luong
Both Nijisen et al.28 and Notingher et al.7
reported on the use of Raman spectra for discrimination of BCC, in which differences in Raman
spectra were observed between diseased and
healthy tissue. The total intensity of the Raman
spectrum of the BCC-infected region was higher
than that of the healthy region, which the authors
reported as corresponding to the higher accumulation of lipids and nucleic acids within the cancer
cells. Scan images of the skin tissue were constructed from total intensity calculations and were
employed to distinguish the diseased from healthy
tissue. Without selective detection, the Raman
spectra were only able to discriminate the regions
of lipid and nucleotide condensation from other
regions, which could lead to misinterpretation if the
healthy cells also have condensed organic organisms, such as the skin follicle region shown in our
experiment. In addition, no specific peaks would be
applicable for selective discrimination of BCC tissue
from healthy tissue, leading to long acquisition time
for intraoperative diagnosis (5–20 h/mm2).7
From the results described above, only the regions
marked as A2, B2, C2 and D2 can be confidently
interpreted as cancerous tissue, while the A1, B1,
C1 and D1 regions may be assigned to hair follicles,
where the cell concentration is also higher. In
principal component analysis, only those regions
differing from other regions and in which nondiseased tissue can also be observed were highlighted, which may lead to misinterpretation. Furthermore, the SER mapping collection process
required more than 2 h, as the collection time for
each spectrum was nearly 5 s, whereas the fingerprinted image using peak height at 1075 cmÀ1
required only around 5 min, as the acquisition could
be focused only on the narrow band around the
1075 cmÀ1 peak (e.g. narrow filter) rather than
collection of the entire spectrum, and the integration time for each pixel could thus be reduced to 0.1–
0.2 s. Hence, this method may represent a solution
for quick surgical diagnostic imaging.
CONCLUSION
In conclusion, we successfully used the SER
signal of the C-S link vibration at 1075 cmÀ1 on
gold nanoparticles to detect BCC-contaminated
regions of skin tissue samples. The 4-ATP-coated
gold nanoparticles were conjugated with the
BerEP4 antibody, which specifically recognizes
BCC. With the fingerprint method using the SER
peak at 1075 cmÀ1, an image of a 40 lm 9 40 lm
skin sample was obtained, and showed the position
of the tumors. These SERS probes show promise for
fast and selective diagnosis of BCC through the
collection of the fingerprinted spectral image of skin
resections. Furthermore, all results can be observed
and analyzed automatically, requiring no subjective
interpretation by pathologists.
REFERENCES
1. J.M. Baxter, A.N. Patel, and S. Varma, BMJ 345, e5342
(2012).
2. National Cancer Intelligence Network (NCIN), Non-melanoma Skin Cancer in England, Scotland, Northern Ireland, and Ireland (London: NCIN, 2013).
3. S.V. Mohan and A.L.S. Chang, Curr. Dermatol. Rep. 3, 40
(2014).
4. M. Gniadecka, H.C. Wulf, O.F. Nielsen, D.H. Christensen,
and J. Hercogova, Photochem. Photobiol. 66, 418 (1997).
5. A. Nijssen, T.C. Bakker Schut, F. Heule, P.J. Caspers, D.P.
Hayes, M.H.A. Neumann, and G.J. Puppels, J. Investig.
Dermatol. 119, 64 (2002).
6. M. Larraona-Puy, A. Ghita, A. Zoladek, W. Perkins, S.
Varma, I.H. Leach, A.A. Koloydenko, H. Williams, H. Williams, and I. Notingher, J. Biomed. Opt. 14, 054031 (2009).
7. K. Kong, C.J. Rowlands, S. Varma, W. Perkins, I.H. Leach,
A.A. Koloydenko, H.C. Williams, and I. Notingher, Proc.
Natl. Acad. Sci. USA 110, 15189 (2013).
8. S. Takamori, K. Kong, S. Varma, I. Leach, H.C. Williams,
and I. Notingher, Biomed. Opt. Express 6, 98 (2015).
9. M. Fleischmann, P.J. Hendra, and A.J. McQuillan, Chem.
Phys. Lett. 26, 163 (1974).
10. T. Vo-Dinh, L.R. Allain, and D.L. Stokes, J. Raman Spectrosc. 33, 511 (2002).
11. P.M. Kasili, M.B. Wabuyele, and T. Vo-Dinh,
NanoBiotechnology 2, 29 (2006).
12. L.R. Allain and T. Vo-Dinh, Analyt. Chim. Acta 469, 149
(2002).
13. N.J. Kim, J. Phys. Chem. C 114, 13979 (2010).
14. S. Ye, L. Fang, and Y. Lu, J. Raman Spectrosc. 41, 1119
(2010).
15. J. Zheng, Y. Zhou, X. Li, Y. Ji, T. Lu, and R. Gu, Langmuir
19, 632 (2003).
16. Y.C. Liu, Langmuir 18, 174 (2002).
17. C.M. Stellman, K.S. Booksh, A.R. Muroski, M.P. Nelson,
and M.L. Myrick, Sci. Eng. Comp. Mater. 7, 51 (1998).
18. N.N. Long, L.V. Vu, C.D. Kiem, S.C. Doanh, C.T. Nguyet,
P.T. Hang, N.D. Thien, and L.M. Quynh, J. Phys. 187,
012026 (2009).
19. X. Huang, I.H. El-Sayed, and M.A. El-Sayed, J. Am. Chem.
Soc. 128, 2115 (2006).
20. H.Y. Jung, Y.K. Park, S. Park, and S.K. Kim, Anal. Chim.
Acta 602, 236 (2007).
21. E.C. Le Ru, E. Blackie, M. Meyer, and P.G. Etchegoin, J.
Phys. Chem. C 111, 13794 (2007).
22. M. Osawa, N. Matsuda, K. Yoshii, and I. Uchida, J. Phys.
Chem. 98, 12702 (1994).
23. L.S. Jiao, L. Niu, J. Shen, T. You, S. Dong, and A. Ivaska,
Electrochem. Commun. 7, 219 (2005).
24. N.C. Maiti, M.M. Apetri, M.G. Zagorski, P.R. Carey, and
V.E. Anderson, J. Am. Chem. Soc. 126, 2399 (2004).
25. P. Owens, N. Phillipson, J. Perumal, G.M. O’Connor, and
M. Olivo, Biosensors 5, 664 (2015).
26. L.S. Jiao, Z. Wang, L. Niu, J. Shen, T. You, S. Dong, and A.
Ivaska, J. Solid State Electrochem. 10, 886 (2006).
27. T.M. Herne, A.M. Ahern, and R.L. Garrell, Anal. Chim.
Acta 246, 75 (1991).
28. A. Nijssen, T.C. Bakker Schut, F. Heule, P.J. Caspers, D.P.
Hayes, M.H.A. Neumann, and G.J. Puppels, J. Invest.
Dermatol. 119, 64 (2002).