DSpace at VNU: Crystal structures and properties of ZnO nanopowders prepared by ultrasonic method
Bạn đang xem bản rút gọn của tài liệu. Xem và tải ngay bản đầy đủ của tài liệu tại đây (1.72 MB, 4 trang )
e-Journal of Surface Science and Nanotechnology
27 December 2011
Conference -IWAMN2009-
e-J. Surf. Sci. Nanotech. Vol. 9 (2011) 482-485
Crystal Structures and Properties of ZnO Nanopowders Prepared by
Ultrasonic Method∗
Dao Thi Ngoc Anh, Huynh Thi Lan Phuong, Hoang Thi Huong Thao, Nguyen Thi Cam Ha,† and Nguyen Xuan Hoan‡
Faculty of Chemistry, Hanoi University of Science, VNU-Hanoi,
19 Le Thanh Tong, Hoan Kiem Dist., Hanoi, Vietnam
(Received 23 November 2009; Accepted 26 May 2010; Published 27 December 2011)
Ultra-fine zinc oxide powders were prepared using ultrasonic method at 60◦ C with zinc acetate, zinc nitrate and
potassium hydroxide solution as precursors. The obtained powders were characterized by means of scanning electron
microscope, thermogravimetric analysis, X-ray diffraction and infrared spectroscopy. The crystal structures were
investigated based on Rietveld method. The results showed that, zinc oxide powders have hexagonal structure
(P 63 mc) with particle size in the range of 100-300 nm. The mechanism for the ZnO formation was discussed.
The properties of synthesized materials were examined by UV-Vis spectrum and cyclic voltammetry measurement.
[DOI: 10.1380/ejssnt.2011.482]
Keywords: Zinc oxide; Nanopowders; Ultrasonic method; Crystal structure; Cyclic voltammetry
I.
INTRODUCTION
Zinc oxide (ZnO) has been a focus of research in material science because of their physical and electrochemical
properties. It can be used for different puposes, such as
catalysts, gas sensors, optical waveguides, optoelectronic
devices, and anodic active materials for Ni/Zn secondary
battery [1–3]. Therefore, many methods, including precipitation [4, 5], hydrothermal synthesis [6–8], polymerized complex method [9], electrodeposition method [10],
microwave synthesis [2, 11], sonochemical process [12–16]
and so on, have been developed to prepare ZnO nanopowder. It was confirmed that prepared condition influences strongly on ZnO structure (cubic and/or hexagonal
crystal structure) and morphology (nanobelts, nanowires,
nanorods, tubes, disks and flower-like), so it also directly
affects the properties of ZnO.
Among the different ZnO synthesized methods, sonochemical process was attracted of attention from many
material scientists and chemists. ZnO nanorods (ultrafine trigonal-shaped particles) were prepared by Zhang et
al. [12] while decomposition of zinc acetate dihydrate in
paraffin oil at temperature higher than 220◦ C. Recently,
Yadav et al. [13], Alammar et al. [14], Li et al. [15], and
Azizian-Kalandaragh et al. [16] reported the preparation
of ZnO nanopowders using zinc acetate and/or zinc nitrate, sodium hydroxide, with and without surfactants in
a water-alcoholic/ alcoholic solution.
This paper presents our results of ZnO nanopowder synthesis from zinc acetate and zinc nitrate using ultrasonic
method. The crystalline structure, physical and electrochemical properties of the obtained ZnO nanopowders
were also discussed.
∗ This paper was presented at the International Workshop on Advanced Materials and Nanotechnology 2009 (IWAMN2009), Hanoi
University of Science, VNU, Hanoi, Vietnam, 24-25 November, 2009.
† Corresponding author:
‡ Corresponding author:
II.
EXPERIMENTAL
All chemicals used in this study were purchased from
Merck and directly employed without any further purification. Zinc acetate dihydrate (Zn(C2 H3 O2 )2 ·2H2 O),
zinc nitrate hexahydrate (Zn(NO3 )2 ·6H2 O), potassium
hydroxide (KOH, >85%), and absolute alcohol were used
as raw materials. First, stoichiometry of zinc salt solution
was added slowly into 2M KOH solution under magnetic
stirring. The mixture, in form of white suspension, was
then irradiated by ultrasonic waves with different length
of time (from 15 minutes to 2 hours) in ultrasonic bath
(42 kHz, Col-Parmer Instrument Company) at 60◦ C. Finally, the product was filtered, washed several times with
distilled water, ethanol, and then dried in air oven at 80◦ C
for 5 hours.
Phase identify was determined using Bruker D8 Advance diffractometer with CuKα radiation (λ = 1.5418
˚
A), the crystal structure of ZnO powder was then refined by Rietveld method from XRD patterns using WinPlotr/ FullProf Suite 2009 software [17]. The morphology of the powder was examined by scanning electron
microscopy (SEM, HITACHI S4800). FT-IR spectra of
ZnO powders were recorded using Perkin Elmer GX spectrophotometer. Thermogravimetric and differential thermal analysis (TG-DTA) using a SETARAM TG-DTA 92
(rate 10◦ C/min, under a dry air) were also employed to
characterize the obtained ZnO powders. The optical absorption of the ZnO nanoparticles was investigated by
UV-Vis spectrophotometer 2800 (Col-Parmer Instrument
Company).
Electrochemical measurement was performed in three
electrodes with a conventional cell used for electrochemical technique (Autolab 30 instrumentation). The
Ag/AgCl was served as a reference electrode (RE), and
platinum was used as a counter electrode (CE). The ZnO
pressed electrode, which was fabricated from the mixture
of 80 wt.% ZnO powder and 20 wt.% Teflon (submicron
powder, as an additive) over the Ni plated steel net, was
used as a working electrode. The electrolyte was saturated ZnO in 2 M KOH solution.
c 2011 The Surface Science Society of Japan ( />ISSN 1348-0391 ⃝
482
e-Journal of Surface Science and Nanotechnology
Volume 9 (2011)
FIG. 2: SEM images of ZnO nanopowder prepared from (a)
zinc acetate salt and (b) zinc nitrate salt, reaction time 2
hours.
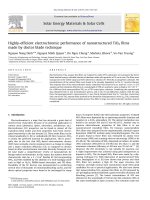
FIG. 1: Observed (+ symbols), calculated (full curve) and
difference (bottom) diffraction patterns for ZnO nanopowder
prepared from (a) zinc acetate salt and (b) zinc nitrate salt,
reaction time 2 hours.
III.
RESULTS AND DISCUSSION
Figure 1 shows the XRD patterns and Rietveld refinement for the product prepared from zinc acetate
(Fig. 1(a)) and nitrate salt sources (Fig. 1(b)) under 2
hours of irradiation. All the peaks can be indexed to
wurtzite ZnO in comparison with the collected data from
Inorganic Crystal Structure Database (ICSD, collection
code: 67849, hexagonal structure, space group: P 63 mc
(186), a = 3.2539 ˚
A, c = 5.2098 ˚
A), and no other impurity
phases are observed. The obtained structure parameters
from refinement are represented in table 1. The refined
cell parameters of both ZnO cases are nearly the same
with those of the bulk ZnO wurzite, the free z parameter
for O, which we obtain as 0.382(8) (for product prepared
from zinc acetate source) and 0.386(5) (for product prepared from zinc nitrate source) compare to 0.389(0) for
bulk ZnO. On the other hand, it can be seen clearly from
refinement results of XRD patterns that the observed intensity (+ symbols) of diffraction peak of the (0002) plane
are higher than calculated intensity (full curve). This difference represents the abundance of oriented and grain
growth favors in a given ⟨0001⟩ direction [2, 4, 7, 10].
The morphology of the ZnO synthesized from zinc acetate (ZnO-Act) and zinc nitrate (ZnO-Nit) are shown in
Figs. 2(a) and (b) respectively. It can be seen from the
SEM images that the shape of ZnO-Act sample is more
uniform than the ZnO-Nit. The grain size varies from 100
to 200 nm in diameter and the particles are grown preferential in c-direction. Therefore, the obtained product
from nitrate salt can be observed in irregular plate-like
morphology with the dimension of plate-like ZnO in the
range of 150-300 nm.
Figures 3 (a) and (b) show TGA curves of ZnO-Act
and ZnO-Nit powders respectively. As a function of temperature, two regions of weight loss can be seen clearly
in both cases. The higher weight loss of 2.55 wt.% was
FIG. 3: TG curves of (a) ZnO-Act, and (b) ZnO-Nit nanopowder.
observed in the case of ZnO-Act powder. The first loss
weight (maximum ∼ 1%) was assigned for the physical
adsorbed degradation of water and/or ethanol onto ZnO
surface at lower temperature (50-150◦ C). Since the degradation step between 150◦ C to 500◦ C indicates the decomposition of Zn(OH)2 [18], or Znx Oy (OH)z compound, as a
non-crystalline phase, and we can not identify them from
XDR patterns. On the other hand, it is probability concerning to the degradation of acetate and/or nitrate ions
remained as a chemically adsorbed onto surface of ZnO
nanopowder (loss weight maximum ∼ 1.55%).
The FT-IR spectra results improve hypothesis above.
The absorption bands near 3400 cm−1 represent O–H
group, and bands at (465 cm−1 , 475 cm−1 ) are clearly represented for Zn–O bonding [9]. Peaks around 1399 cm−1 ,
1563 cm−1 correspond to the stretching vibration of C=O
and C–O–H groups in acetate species and/or persist even
after washing with ethanol (Fig. 4(a)). In Fig. 4(b), the
peak at 1632 cm−1 is assigned to the stretching vibration of O-N=O group in nitrate species, which suggests
the presence of adsorbed nitrate on the surface of ZnO
nanopowders.
The mechanism of ZnO formation under the ultrasonic
process was investigated. The irradiations of ultrasonic
waves were applied onto white suspension (a mixture of
zinc salt and potassium hydroxide obtained at first stage)
(J-Stage: />
483
Anh, et al.
Volume 9 (2011)
TABLE I: Refinement results for ZnO powders (hexagonal structure, P 63 mc, Z = 2)
ZnO powder prepared from
Zinc acetate salt
Zinc nitrate salt
13.2
11.8
16.6
15.3
3.94
4.65
1.64
2.06
3.2551(5)
3.2555(3)
5.2189(6)
5.2196(2)
47.89(1)
47.88(4)
Rp (%)
Rwp (%)
RBragg (%)
χ2
a (˚
A)
c (˚
A)
V (˚
A3 )
a
Atom coordinates: WP,(x, y, z)
Zn
O
a Omitted
2(b),(1/3, 2/3, 1)
2(b),(1/3, 2/3, 0.382(8))
2(b),(1/3, 2/3, 1)
2(b),(1/3, 2/3, 0.386(5))
occupancies are equal to 1.
at different times from 15 minutes to 2 hours. The result from XRD patterns (not present here) shows that
only ZnO phase was identified after 15 minutes of irradiation. This indicates that the formation and growth of
ZnO nanocrystal was so rapid. The mechanism of ZnO
formation can be proposed as follows:
Zn2+ + 2OH− → Zn(OH)2
(1)
Zn(OH)2 + 2OH− → [Zn(OH)4 ]2−
(2)
Zn2+ + 4OH− → [Zn(OH)4 ]2−
(3)
[Zn(OH)4 ]2− + · · · + [Zn(OH)4 ]2− → Znx Oy (OH)z (4)
Znx Oy (OH)z → ZnO + H2 O
(5)
1
[Zn(OH)4 ]2− → ZnO + 2H2 O + O2
2
(6)
Zn(OH)2 → ZnO + H2 O
(7)
Eqs. (4) and (5) are similar to the research of Lin et
al. [5]. In the first stage, Zn2+ added into KOH solution, the reactions take place as Eqs. (1)-(3). The product was found in white suspension form. In the second
FIG. 4: FT-IR spectra of (a) ZnO-Act, and (b) ZnO-Nit
nanopowder.
484
FIG. 5: UV-Vis spectra of ZnO nanopowder prepared from
zinc acetate salt at different reaction times.
stage, the mixture was irradiated by ultrasonic waves
at temperature 60◦ C; Eqs. (4)-(7) occurred, and rapidly
white precipitate of ZnO was formed by the dehydration
of Znx Oy (OH)z , [Zn(OH)4 ]2− and/or Zn(OH)2 .
Figure 5 shows UV-vis absorption spectrum of ZnO
nanoparticles prepared at different sonochemical reaction
times: 15, 30, 45, 60, 90 and 120 min. For all samples,
well defined exciton absorption peaks at 372 nm to 377 nm
were observed. These observations are in good agreement
with research of Yadav et al. [13].
UV-Vis spectra of ZnO-Act, ZnO-Nit and commercial
submicron ZnO powder (purchased from Merck) were
recorded. Band gap energy of ZnO samples was calculated from UV-Vis by plot (α · h · ν)2 versus photon energy (h · ν) as shown in Fig. 6, where α is an absorption
coefficient [8, 10]. Energy band gap (Eg ) was obtained by
the extrapolation of the linear part until it intersects the
energy (h · ν) - axis. The band gap of both synthesizes
ZnO samples (ZnO-Act, ZnO-Nit) was found to be Eg ∼
3.29 eV. These observed values are higher than the value
Eg for commercial ZnO powder (Eg ∼ 3.15 eV).
The electrochemical property of synthesized materials
was investigated using a cyclic voltammetry measurement
(CVs). The CVs were recorded with voltage in range of
−1.5 to −0.75 V (versus Ag/AgCl) and scan rate was
set at 1 mV·s−1 in the solution of saturated ZnO in 2M
KOH. Figure 7 presents the cyclic voltammograms of dif-
(J-Stage: />
e-Journal of Surface Science and Nanotechnology
Volume 9 (2011)
Therein, the commercial ZnO powder was used as comparison sample.
It can be seen that the anodic current response lies
between −1.37 and 1.20 V. The anodic process corresponds to the discharge process of zinc oxide electrode;
hence the increase of the anode peak is in accord with the
higher discharge voltage of the ZnO materials [3]. The
anodic peak has potential value (Ep,a ) of −1.276, −1.276,
−1.265 V and the current density (Ip,a ) = 23.2, 17.9, 10.1
mA·cm−2 for ZnO-Act, ZnO-Nit and submicron commercial ZnO electrodes respectively. Hence, both synthesizes
of ZnO powder have electrochemical activity higher than
submicron commercial ZnO powder.
FIG. 6: Band gaps calculated from UV-Vis data of (a) ZnOAct, (b) ZnO-Nit, and (c) commercial submicron ZnO powder.
IV.
CONCLUSION
ZnO nanopowders were successfully synthesized from
zinc acetate and zinc nitrate salts sources in KOH medium
using ultrasonic process. The obtained products were
characterized to have hexagonal structure, P 63 mc. The
nanocrystal of ZnO was rapidly growth in the ⟨0001⟩ direction. Grains size of prepared ZnO materials were in the
range of 100 ÷ 200 nm and 150 ÷ 300 nm for ZnO-Act
and ZnO-Nit respectively. Energy band gap was found to
be 3.29 eV in both materials. The obtained results were
confirmed that ZnO products have good physical, electrochemical properties so they can be very useful for further
applications.
FIG. 7: Cyclic voltammograms of ZnO powder electrodes from
(a) ZnO-Act, (b) ZnO-Nit, and (c) commercial submicron ZnO
powder.
ferent ZnO electrodes, which were fabricated from ZnOAct, ZnO-Nit and submicron commercial ZnO powder.
[1] T. K. Gupta, J. Am. Ceram. Soc. 73, 1817 (1990).
[2] M.-G. Ma, Y.-J. Zhu, G.-F. Cheng, and Y.-H. Huang,
Mater. Lett. 62, 507 (2008).
[3] M. Ma, J. P. Tu, Y. F. Yuan, X. L. Wang, K. F. Li, F.
Mao, and Z. Y. Zeng, J. Power Sources 179, 395 (2008).
[4] C. Chen, P. Liu, and C. Lu, Chem. Eng. J. 144, 509
(2008).
[5] L. Lin, H. Watanabe, M. Fuji, and M. Takahashi, Adv.
Powder Technol. 20, 185 (2009).
[6] Y. Ni, G. Wu, X. Zhang, X. Cao, G. Hu, A. Tao, Z. Yang,
and X. Wei, Mater. Res. Bull. 43, 2919 (2008).
[7] D. Polsongkram, P. Chamninok, S. Pukird, L. Chow, O.
Lupan, G. Chai, H. Khallaf, S. Park, and A. Schulte,
Physica B: Condens. Matter Phys. 403, 3713 (2008).
[8] Y. Hu and H.-J. Chen, J. Nanopart. Res. 10, 401 (2008).
[9] Y.-J. Kwon, K.-H. Kima, C.-S. Limb, and K.-B. Shim, J.
Ceram. Process. Res. 3, 146 (2002).
[10] R. Chander and A. K. Raychaudhuri, Solid State Com-
Acknowledgments
This work was financially supported by Grants-in-Aid
from the Nippon Sheet Glass Foundation for Materials
Science and Engineering, Japan (2009-2010) and by Vietnam National University, Hanoi-Vietnam (Contract QG
09-14).
mun. 145, 81 (2008).
[11] Y. Ni, S. Yang, J. Hong, P. Zhen, Y. Zhou, and D. Chu,
Scr. Mater. 59, 127 (2008).
[12] X. Zhang, H. Zhao, X. Tao, Y. Zhao, and Z. Zhang, Mater.
Lett. 59, 1745 (2005).
[13] R. S. Yadav, P. Mishra, and A. C. Pandey, Ultrason.
Sonochem. 15, 863 (2008).
[14] T. Alammar and A.-V. Mudring, Mater. Lett. 63, 732
(2009).
[15] H. Li, Y. Ni, and J. Hong, Scr. Mater. 60, 524 (2009).
[16] Y. Azizian-Kalandaragh, K. Ali, and M. Behboudnia,
Mat. Sci. Semicond. Process 12, 142 (2009).
[17] T. Roisnel and J. Rodriguez-Carvajal, FullProf Laboratoire Leon Brillouin, CEA-CNRS, Saclay, France (2009),
online at .
[18] M. H. Ullah, I. Kim, and C.-S. Ha, J. Mater. Sci. 41, 3263
(2006).
(J-Stage: />
485