DSpace at VNU: Nanoparticles: synthesis and applications in life science and environmental technology
Bạn đang xem bản rút gọn của tài liệu. Xem và tải ngay bản đầy đủ của tài liệu tại đây (1.35 MB, 10 trang )
Home
Search
Collections
Journals
About
Contact us
My IOPscience
Nanoparticles: synthesis and applications in life science and environmental technology
This content has been downloaded from IOPscience. Please scroll down to see the full text.
2015 Adv. Nat. Sci: Nanosci. Nanotechnol. 6 015008
( />View the table of contents for this issue, or go to the journal homepage for more
Download details:
IP Address: 193.255.88.62
This content was downloaded on 18/01/2015 at 14:45
Please note that terms and conditions apply.
|
Vietnam Academy of Science and Technology
Advances in Natural Sciences: Nanoscience and Nanotechnology
Adv. Nat. Sci.: Nanosci. Nanotechnol. 6 (2015) 015008 (9pp)
doi:10.1088/2043-6262/6/1/015008
Nanoparticles: synthesis and applications in
life science and environmental technology*
Hoang Luong Nguyen1, Hoang Nam Nguyen1,2, Hoang Hai Nguyen1,
Manh Quynh Luu2 and Minh Hieu Nguyen1
1
Nano and Energy Center, Hanoi University of Science, Vietnam National University in Hanoi, 334
Nguyen Trai, Thanh Xuan, Hanoi, Vietnam
2
Center for Materials Science, Faculty of Physics, Hanoi University of Science, Vietnam National
University in Hanoi, 334 Nguyen Trai, Thanh Xuan, Hanoi, Vietnam
E-mail:
Received 20 October 2014
Accepted for publication 12 November 2014
Published 31 December 2014
Abstract
This work focuses on the synthesis, functionalization, and application of gold and silver
nanoparticles, magnetic nanoparticles Fe3O4, combination of 4-ATP-coated silver nanoparticles
and Fe3O4 nanoparticles. The synthesis methods such as chemical reduction, seeding,
coprecipitation,and inverse microemulsion will be outlined. Silica- and amino-coated
nanoparticles are suitable for several applications in biomedicine and the environment. The
applications of the prepared nanoparticles for early detection of breast cancer cells, basal cell
carcinoma, antibacterial test, arsenic removal from water, Herpes DNA separation, CD4+ cell
separation and isolation of DNA of Hepatitis virus type B (HBV) and Epstein–Barr virus (EBV)
are discussed. Finally, some promising perspectives will be pointed out.
Keywords: gold nanoparticles, silver nanoparticles, magnetic nanoparticles, functionalization
Mathematics Subject Classification: 4.02
1. Introduction
also be engineered to actively interact with a pollutant and
treat them.
In this work we focus on the synthesis, functionalization,
and application of gold and silver nanoparticles, magnetic
nanoparticles Fe3O4, combination of 4-aminothiophenol (4ATP)-coated silver nanoparticles and Fe3O4 nanoparticles.
Nanoparticles are of great interest because of their technological and fundamental scientific importance. These materials
often exhibit fascinating properties which cannot be achieved
by their bulk counterparts. Their applications, or potential
applications, are in many fields [1–5 and references therein].
Nanoparticles have advantages in application in life science
and the environment. Their particle size is comparable with
the dimension of small molecules (about 1–10 nm) or of
viruses (about 10–100 nm). This allows nanoparticles to
attach to biological entities without changing their functions.
Large surface area of nanoparticles permits strong bonds with
surfactant molecules. In the environment, the small size of
nanoparticles, together with their large surface area can lead
to very sensitive detection of a specific contaminant from the
presence of which pollution often arises. Nanoparticles can
2. Experimental
2.1. Synthesis of nanoparticles
2.1.1. Gold nanoparticles. Gold nanoparticles with a size of
about 40 nm have been synthesized by a chemical reduction
method using sodium borohydride (NBH4) [6]. HAuCl4 and
NBH4 are stirred in water with appropriate time and the ratio
of gold to sodium borohydride. Gold nanoparticles with sizes
ranging from 2 to 5 nm were also prepared by seeding method
using surfactant of cetyltrimethylamonium bromide
(CTAB) [7].
* Invited talk at the 7th International Workshop on Advanced Materials
Science and Nanotechnology IWAMSN2014, 2-6 November, 2014, Ha
Long, Vietnam.
2043-6262/15/015008+09$33.00
1
© 2015 Vietnam Academy of Science & Technology
Adv. Nat. Sci.: Nanosci. Nanotechnol. 6 (2015) 015008
H L Nguyen et al
2.1.2. Silver nanoparticles. Silver nanoparticles have been
conjugating with biological objects. The amino-NP is ready to
conjugate with the DNA of the Herpes virus and with the
antiCD4 antibody.
prepared by a modified sonoelectrodeposition method [8].
The modification is that a silver plate was used as the cathode
instead of silver salts to avoid unexpected ions. This method
allows producing Ag nanoparticles (AgNP) with the size of
4–30 nm dispersed in a non-toxic solution.
2.2.3. Silica coating of magnetic nanoparticles. Maintaining
the stability of magnetic nanoparticles for a long time without
agglomeration or precipitation is an important issue (see, for
instance, [4]). The protection of magnetic nanoparticles
against oxidation by oxygen, or erosion by acid or base, is
necessary. One of the ways to protect magnetic nanoparticles
is coating them with silica. A silica shell not only protects the
magnetic cores, but can also prevent the direct contact of the
magnetic core with additional agents linked to the silica
surface that can cause unwanted interactions. The coating
thickness can be controlled by varying the concentration of
ammonium and the ratio of TEOS to H2O. The surfaces of
silica-coated magnetic nanoparticles are hydrophilic, and are
ready modified with other functional groups [13]. We have
prepared Fe3O4/SiO2 nanoparticles by coating magnetic
nanoparticles with silica using TEOS [10]. Silica layer has
a thickness of about 2–5 nm.
Magnetic
nanoparticles. Magnetic
Fe3O4
nanoparticles with size 10–15 nm were synthesized by using
coprecipitation from iron (III) chloride and iron (II) chloride
solutions with the assistance of aqueous ammonia solution, as
described in [9, 10]. Coprecipitation is a facile and convenient
way to synthesize magnetite nanoparticles from aqueous
Fe2+/Fe3+ salt solutions.
2.1.3.
2.1.4. Combination of 4-ATP-coated silver nanoparticles and
Fe3O4 nanoparticles. Silver nanocolloids were synthesized
by wet chemical reduction method using NaBH4 with the
presence of surface activator polyvinylpyrrolidone (PVP),
then was coated by 4-ATP to form Ag-4ATP nanoparticles.
These nanoparticles were combined with the abovementioned Fe3O4 nanoparticles to form multifunctional
nanoparticles by inverse microemulsion method [11]. The
inverse microemulsion was created by mixing hydrophobic
phase of toluene and hydrophilic phase that was made from
the mixture of Ag-4ATP solution after 4 months storage and
Fe3O4 solution right after synthesis. Under sonic bath,
different mass rates of Ag-4ATP/Fe3O4 were moderated for
2 h before tetraethylorthosilicate (TEOS) was added to react
with water in solution to form SiO2 coat that covered both
types of particles, as in reaction (1). Silicate in amorphous
conformation created a boundary thin film, which covered the
initial nanoparticles.
Si ( OC 2 H 5)4 + 2H 2 O → SiO2 + 4C2 H 5OH.
3. Applications
3.1. Application of gold nanoparticles for detecting breast
cancer cells
Gold nanoparticles are potential candidates for cell imaging
and cell-target drug delivery [14–18], cancer diagnostics and
therapeutic applications [19–21]. Nowadays, a number of biomarkers which are expressed at a high level on the surface of
breast cancer have been reported, for example human epidermal growth factor receptor (HER) belonging to a member
of the epidermal growth factor (EGF) family of tyrosine
kinase receptors. These include HER1, HER2, HER3, and
HER4. While HER1, HER3, and HER4 are overexpressed in
various types of cancer cells, such as head, neck, brain, stomach, breast, colon, gast, prostate, and so on, HER2 is a
biomarker which is more specific for breast and ovarian
[22, 23]. HER2 is super-expressed with several hundred folds
higher in cancer cells of 20–30% breast cancer patients than
in normal cells. Therefore, HER2 is an interesting target for
therapy of breast cancer. Anti-HER2 with generic name
trastuzumab or trade name herceptin is a humanized monoclonal antibody (mAb), which has been approved by the FDA
since 1998 for treatment of metastatic breast cancer
[19, 20, 24]. In this study we conjugated the gold nanoparticles with anti-HER2 antibody (trastuzumab) through
either non-covalent or covalent linkages. The trastuzumabconjugated gold nanoparticles were then used to specifically
label breast cancer cells, KPL4 line, for imaging of the cells.
As seen from figure 1, in the case of the gold nanoparticles without conjugation with trastuzumab, the gold
nanoparticles could not find the cancer cells and nothing was
observed in the dark-field microscopy image (A2). When the
gold nanoparticles were directly conjugated with trastuzumab,
the gold nanoparticles concentrated on the cancer cells and
(1)
2.2. Functionalization/coating of nanoparticles
Nanoparticles need to be functionalized in order to conjugate
with biological entities such as DNA, antibodies and
enzymes. The most widely used functional groups are amino,
biotin, steptavidin, carboxyl and thiol groups [12].
Functionalization
of
gold nanoparticles. For
application to detect breast cancer cells, gold nanoparticles
synthesized by a chemical reduction were functionalized with
4-aminothiolphenyl (4-ATP). For basal cell carcinoma
detection, different amounts of 4-ATP solutions were added
to gold nanoparticles coated by CTAB. CTAB on the surface
of gold nanoparticles was replaced by 4-ATP to form gold
nanoparticles functionalized with 4-ATP (Au-4ATP).
2.2.1.
2.2.2. Functionalization of magnetic nanoparticles. Fe3O4
nanoparticles were functionalized using 3-aminopropyl
triethoxysilane (APTS). APTS is a bifunctional molecule,
an anchor group by which the molecule can attach to free -OH
surface groups. The head group functionality -NH2 is for
2
Adv. Nat. Sci.: Nanosci. Nanotechnol. 6 (2015) 015008
H L Nguyen et al
Figure 1. Typical bright-field (A1, A3, A5) and dark-field (A2, A4, A6) microscopy images of breast cancer cells after incubation with the Au
NP non-conjugated with trastuzumab (A1-A2), the Au NP conjugated with trastuzumab (A3-A4) and the amino-GNP covalently conjugated
with trastuzumab through EDC connection (A5-A6).
these cancer cells were clearly observed in the dark-field
microscopy image (A4) by means of the scattering light of the
gold nanoparticles. When the amino-gold nanoparticles
(amino-GNP) were covalently conjugated with trastuzumab
through l-ethyl-3-(3-dimethylaminopropyl) ethylcarbodiimide
(EDC) connection, the gold nanoparticles concentrated on the
cancer cells as well, but these cancer cells were observed with
slightly lower intensity in the dark-field microscopy image
(A6) in comparison with those in the image A4. However, the
gold nanoparticles directly conjugated with trastuzumab were
able to be stored in a freezer for only about two weeks before
they lost their activity; while the gold nanoparticles covalently conjugated with trastuzumab were stable for storage for
about two months.
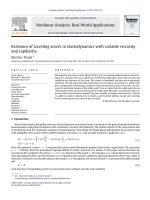
vibrations on the surface of metallic nanoparticles. In this
experiment, we investigated SERS signal of 4-ATP that
linked to surface of gold nanoparticles while being conjugated
with the skin carcinomas cell antibody BerEP4. The Auantibody solutions were dropped on the surface of the tissue
and the SERS signals were collected and analyzed [7].
Figure 2 shows the fingerprinted landscape of SERS signals
of Au-antibody on a basal cell carcinoma (BCC) tissue.
Figures 2(A) and (B) show the colored and micro spectroscopy image of the tissue, where the cancer cell area may be
the dark colored regions, for example, region A1, A2, B1 and
B2. Figure 2(C) shows the result of SERS signal analyzed
using principle component analysis [7]. Figure 2(D) shows
the result of the SERS signal analyzed using only the intensity
of SERS peaks at 1075 cm−1. The antigen–antibody coupling
oriented the Au-antibody colloids close to the BCC surface.
The carcinomas sections should be considered as a dock
where distributed high concentration of Au-antibody particles, then the SERS peak intensity at 1075 cm−1 will higher in
these areas. Figure 2(D) shows the results of using the peak
3.2. Basal cell carcinoma fingerprinted detection
Recently, the surface enhanced Raman scattering (SERS) has
attracted much interest in the field of bio-labeling due to the
significant enhance of the labeling signals of molecular
3
Adv. Nat. Sci.: Nanosci. Nanotechnol. 6 (2015) 015008
H L Nguyen et al
Figure 2. Fingerprinted landscape of SERS signals of Au-antibody on BCC tissue. (A) Gram staining picture of a BCC tissue where A1 and
A2 are the suspected area; (B) microscope picture of BCC tissue. Areas B1 and B2 are the same position on the tissue with A1 and A2,
respectively; (C) principle component analyzed SERS signal landscape. Areas C1 and C2 are the same position on the tissue with A1 and A2,
respectively; (D) the landscape of intensity of SERS peaks at 1075 cm−1. Areas D1 and D2 are the same position on the tissue with A1 and
A2, respectively. In figure D, the difference of D1 and D2 show that only red colored D2 (and the similar color area) is the infected area and
D1 is not.
height at 1075 cm−1 to mapping the Au-antibody appearing
areas in 40 × 40 μm2 region. In comparison, using the principle component analysis method, where the SERS signals
were compared with each other, then the difference of the
SERS spectra from the average spectrum is mapped in
figure 2(C). In figure 2(C), the yellow to the red colored areas
such as C1 and C2 areas can be considered as cancer regions.
However, the area D1 in figure 2(D) does not show the high
intensity of the peak at 1075 cm−1 while the others such as D2
area indicate very high intensity of the peak at 1075 cm−1.
From all the figures, only A2, B2, C2 and D2 regions can be
surely considered as the cancer areas, while A1, B1, C1 and
D1 may be assigned as the position of a skin hole where the
cell concentration is higher than in other parts. By principle
component analysis, only those regions were highlighted
which differ from other regions and the non-carcinomas can
also be observed. However, in some special regions, one can
make a mistake during the diagnosis. In addition, according to
the collecting time of each spectrum being nearly 5 s, the
whole SERS map collecting time should be longer than 2 h. In
order to shorten the collecting time, if the collected band is
only limited by a narrow band around the 1075 cm−1 peak, the
collecting time of each spectrum may decrease to 0.1–0.2 s.
Then, the fingerprinted image using peak height at 1075 cm−1
can be observed in around 5 min, hence, this can be the
solution for quick diagnostics during an operation.
3.3. Antibacterial test using silver nanoparticles
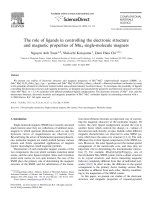
The quantitatively antibacterial study of AgNP in Luria–
Bertani (LB) broth is shown in figure 3, which presents the
dynamics of Escherichia coli (E. coli) growth in only LB
broth (negative control), LB broth supplemented with 120 μl
trisodium citrate (TSC) solution (TSC control) and LB broth
supplemented with AgNP (AgNP antibacterial tests). The
amount of AgNP was adjusted to have the concentration from
2 to 200 μg ml−1. Vertical axis represents optical density at
4
Adv. Nat. Sci.: Nanosci. Nanotechnol. 6 (2015) 015008
H L Nguyen et al
close to the MIC, normally ranging from 1 to 16 μg ml−1, of
antibiotics used for the treatment of E. coli [28].
3.4. Magnetic nanoparticles
3.4.1. Arsenic removal from water. The arsenic adsorption
abilities of the magnetite, Fe1-xCox.Fe2O3 (Co-ferrites) and
Fe1-yNiyO.Fe2O3 (Ni-ferrites) were studied with different
conditions of stirring time, concentration of nanoparticles and
pH [29]. Table 1 shows the stirring time dependence of
arsenic removal for 1 g l−1 of Co-ferrites at neutral pH. The
starting concentration of 0.1 mg l−1 was reduced about 10
times down to the maximum permissible concentration
(MPC) of 0.01 mg l−1 after a stirring time of few minutes
(the standard deviation is about 10%). The removal process
did not seem to depend significantly on the concentration of x
in the Co-ferrites. Similar results were found for the Niferrites, in which the arsenic concentration was reduced to the
MPC value after a few minutes of stirring and the removal did
not change significantly with y. We also studied the effects of
the weight of the nanoparticles on the removal process. The
stirring time was fixed to be 3 min and the weight of samples
was changed from 0.25 g l−1 to 1.5 g l−1 in steps of 0.25 g l−1.
The results showed that, after 3 min, the optimal weight to
reduce arsenic concentration down to a value lower than the
MPC was 0.25 g l−1 for magnetite and 0.5 g l−1 for Co- and
Ni-ferrites.
The arsenic adsorption was reported to be independent of
pH in the range of 4 to 10. However, at high pH, the
adsorption was reduced significantly. Arsenic was desorbed
from the adsorbent at alkaline pH [30]. Our reported results
were conducted at a pH of 7. After arsenic adsorption, the
nanoparticles were stirred under a pH of 13 to study the
desorption process. Nanoparticles were collected by using a
magnet and the arsenic concentration in the solution was
determined by using atomic absorption spectroscopy. The
results showed that 90% of the arsenic ions were desorbed
from nanoparticles. The nanoparticles after desorption did not
show any difference in arsenic re-adsorption ability. The
adsorption–desorption process was repeated four times, which
proved that the nanoparticles could be reused for arsenic
removal.
Figure 3. Bar chart of OD595 reflecting E. coli concentration in LB in
the presence of different concentrations of AgNP nanoparticles
(μg ml−1) as increasing time (h). Each test was conducted after 4, 8,
24 and 30 h. It is obvious that, with the concentration of
AgNP > 16μg ml−1, the E. coli growth was inhibited.
−1
Table 1. Arsenic concentration (μg l ) remained in water after
removal by 1 g l
−1
of the Co-ferrites as a function of the stirring time.
Time (min)
1
3
7
15
30
60
x = 0.05
x = 0.1
x = 0.2
x = 0.5
10
6
10
9
12
4.5
11
5
9
12
4.5
5
6
8.5
4.2
5
5
8
6.5
7
7.8
6.9
11.2
9.8
595 nm (1 optical density at 595 nm, OD595, equals the concentration of 1.7 × 10⁹ cells ml−1). The initial number of
E. coli inoculated into 2 ml LB medium of the tested tube was
1.7 × 10⁶ cells, providing the final bacterial concentration of
8.5 × 10⁵ cells ml−1. For the negative control and the TSC
control, E. coli bacteria grew normally. The concentration of
E. coli after 30 h in the TSC control (OD595 = 2.5) is higher
than that in the negative control (OD595 = 1.5) which suggests
that TSC was not toxic to E. coli and may be even enabled for
the bacterial growth. The situation is different with the presence of AgNP because of the well-known antibacterial
property of this metal [25]. When AgNP concentration was
2 μg ml−1, the result was similar to the result of the negative
control because the low value of AgNP could not inhibit
bacteria growth. With higher AgNP concentration, the inhibitory effect occurred within 8 h even at low AgNP concentration of 4 μg ml−1. This value is about twofold lower
than the threshold concentration of 8 μg ml−1 reported for Agloaded activated carbon in another research [26] and slightly
higher than a value of 2–3 μg ml−1 reported for the complicated Tollens process [27]. The minimal inhibitory concentration (MIC) is defined as the lowest concentration of a
drug that will inhibit the visible growth of E. coli after a
period of time long enough for the growth of single colony to
a turbid bacteria culture observable to the naked eye. Commonly it is overnight incubation. For longer incubation time,
i.e., 24 and 30 h, E. coli grew in the broth tubes with AgNP
concentration < 12 μg ml−1 and inhibited in the broth tubes
with AgNP concentration > 16 μg ml−1. Therefore, the MIC of
AgNP against the growth of E. coli is 16 μg ml−1 which is
3.4.2. Herpes DNA separation. Herpes simplex virus causes
extremely painful infections in humans [31]. The
determination of the presence of this virus is important. An
electrochemical sensor is a simple and fast way to recognize
the presence of the DNA of the virus. However,
electrochemical sensors have a limit of sensitivity, so they
cannot measure concentrations lower than a few tens of
nM l−1 [32]. Therefore, a DNA separation before the
measurement by using the electrochemical sensor needs to
be carried out to increase the concentration of the DNA. To
do that, we used a DNA sequence, which is representative of
the Herpes virus, as a probe to hybridize with the target DNA
in the sample. The probe DNA sequence of the Herpes virus
was HSV-1 of 5’-AT CAC CGA CCC GGA GAG GGA C-3’
(Invitrogen). The phosphate group in the 5’ of the probe DNA
5
Adv. Nat. Sci.: Nanosci. Nanotechnol. 6 (2015) 015008
H L Nguyen et al
volume that was used in our studies, the concentration after
magnetic enrichment was 200 times higher than the initial
concentration. With the magnetic enrichment process, we can
measure the solution with the low concentration of 0.1 nM l−1,
which is 10 times smaller than the limit of the electrochemical
sensor.
3.4.3. CD4+ cell separation.
The prepared nanoparticles have
been used for CD4+ cell separation [29]. The aminonanoparticles were coupled with the antiCD4 monoclonal
antibody (antiCD4, invitrogen). In some samples, an amount
of fluorescent isothiocyanate (FITC) labeled antiCD4
monoclonal antibody (FITC-antiCD4 or antiCD4*,
excitation/emission:
480 nm/520 nm;
Exiobio)
was
additionally added with various amounts of non-labeled
antiCD4 for interaction with the amino-NP via carbodiimide.
Two types of nanoparticles were suspended in phosphate
saline buffer (PBS) containing 0.1% bovine serum albumin
(BSA). One type was coated with non-label antiCD4
(antiCD4-NP) and the other was coated with a mixture of
non-labeled and FITC-labeled antiCD4 (antiCD4*-NP).
Several 200 μl tubes of blood were gently centrifuged to
remove the serum and to obtain the blood cells. After that,
each tube was incubated with either 0.2 mg of antiCD4-NP or
0.2 mg of antiCD4*-NP. 1.3 ml of hypotonic buffer (5 mM
Tris pH 7.0, 10% glycerol) was added to burst the red blood
cells to form ghost cells. The antiCD4-NP or antiCD4*-NPcoated cells were then magnetically separated from the ghost
cells.
In a parallel experiment, for direct labeling of the CD4+ T
cells by the FITC-antiCD4 monoclonal antibody, 20 μl of
FITC-antiCD4 monoclonal antibody (Exiobio) was also used
to directly label the CD4+ T cells. In this experiment, the
CD4+ T cells were collected, together with other cells in
blood, by centrifugation. Finally, the collected cells were
resuspended in 50 μl of storage buffer (PBS containing 10%
glycerol) to be observed under a Carl Zeiss Axio plan
microscope.
The FITC-antiCD4 monoclonal antibody emits green
light (520 nm) when being excited by blue light (480 nm).
Figure 5 presents a visualization of individual CD4+ T cells
under white light and under blue light excitation, after being
labeled with the FITC-labeled antiCD4 monoclonal antibody.
We could observe many cells, including red blood cells and
white blood cells, under white light illumination (figure 5(A)),
but under the blue light excitation, only two of the white
blood cells emitted green fluorescent signals (figure 5(B)) in
an area of about 104 μm2, indicating that they are the CD4+ T
cells. The white cells that did not emit fluorescent signals
were not CD4+ T cells, but were other types of white cells.
The average relative intensity of the FITC labeled CD4+ T
was estimated to be 137 000 ± 45 000 arbitrary unit (mean ±
standard deviation). Based on the average counted number of
CD4+ T cells on 104 μm2 vision areas, we estimated the
relative number of CD4+ T cells in 1 μl of two blood samples
from healthy people to be about 670 and 810 cells μl−1,
respectively. As the normal count in a healthy, HIV-negative
Figure 4. Dependence of the output signal on the initial volume
before and after magnetic separation.
sequence needs to be activated in order to conjugate with the
amino group of the amino-NP surface. The probe DNA after
being activated with EDC and 1-methyllmidazole (MIA) was
mixed with the amino-NP to have nanoparticles with the
probe DNA on the surface. The DNA-NP was heated in deionized water at 37 °C for 18 h. The products of this process
were nanoparticles with the probe DNA sequence on the
surface (DNA-NP).
The DNA separation was conducted as follows: 1 ml of
the solution containing 2 wt.% of DNA-NP was mixed with
2–20 ml of a solution with 0.1 nM l−1 of the Herpes DNA.
The hybridization of the probe DNA and the target DNA
occurred at 37 °C for 1 h; then, by using magnetic decantation, the nanoparticles with hybridized DNA were collected
and redispersed in 0.1 ml of water. The dehybridization of the
nanoparticles with the probe and target DNA occurred at
98 °C. Removing the DNA-NP from the solution by using
magnetic decantation, we obtained a solution with a high
concentration of the DNA of the Herpes virus. When all the
target DNA was separated, the concentration of the DNA had
increased from 20–200 times [29].
Figure 4 presents the dependence of the output signal on
the initial volume of the solution containing 0.1 nM l−1 of the
Herpes DNA before and after the magnetic separation. The
initial solution contained 0.1 nM l−1 of the DNA, which was
much smaller than the sensitivity of the sensor. Therefore, the
measurement of the solution before magnetic enrichment was
almost zero (figure 4, open squares). After magnetic
enrichment, depending on the initial volume of the solution,
the output signals linearly increased with increasing initial
solution volume. The higher the volume, the higher the
concentration. As a result, higher output signals were
obtained. This means that the concentration of the DNA
was much condensed after the enrichment. The concentration
obtained by comparing the initial volume and the final
volume was almost consistent with the concentration obtained
from the electrochemical sensor. With the highest initial
6
Adv. Nat. Sci.: Nanosci. Nanotechnol. 6 (2015) 015008
H L Nguyen et al
Figure 5. Visualization of the blood cells under white-light (A, C) and under blue light excitation (480 nm) (B, D), after being coupled with
the antiCD4 antibody and antiCD4-NP*s and being separated by using a magnet.
under a conventional microscope, as shown in figures 5(C)
and (D). Here, the FITC-labeled antiCD4 plays as a signal for
detection of CD4+ T cells under a fluorescence microscope.
All of the cells bound with a single layer of antiCD4*-NP
emitted
high
average
fluorescent
intensities
of
356 000 ± 64 000 (arbitrary unit), which were about 2.6 times
higher than that observed when using FITC-antiCD4 directly,
as shown in figure 5(B). We did not observe white cells
without fluorescent signals due to the magnetic separation.
Our data confirmed that a combination of magnetic separation
and the detection of the fluorescent signal improved the
signals compared to that of direct labeling of CD4+ T cells by
FITC-antiCD4 monoclonal antibody. Counting the exact
number of antiCD4*-NP coated cells still had some
challenges: (a) number of nanoparticles attached to the cells,
contribution to the background which largely interferes with
the signals of antiCD4*-NP bound cells; (b) nonuniform
distribution of the cells in the vision area; (c) a certain
percentage of antiCD4-NPs bound cells (about 20%) was not
attracted by the magnetic field as we could observe the
fluorescene emitting cells in the supernatant after separation.
adult can vary but is usually between 600 and 1200 CD4+ T
cells μl−1, the measured numbers of the CD4+ T cells in our
experiment were acceptable as they fell in the standard range.
Nevertheless, we suspected that elimination of the background in fluorescent detection might have caused the fairly
low numbers of the CD4+ T cells in the two blood samples.
We attempted to develop an alternative method to
primarily separate the CD4+ T cells by using an external
magnetic force before counting the cell number by using a
fluorescence microscope. For that purpose, it was essential to
prepare magnetic nanoparticles that had stable and specific
links between the monoclonal antibody and the particular
receptor CD4 on the membranes of the CD4+ T cells.
Therefore, the nanoparticles were functionalized with free
amino group (amino-NP) for covalent linking with the
carboxyl group of the antiCD4 monoclonal antibody to
obtain antiCD4 antibody modified nanoparticles (antiCD4NP). The antiCD4-NPs were used as a material to conjugate
with CD4+ T cells for the magnetic separation. In fact, we
tried with various amounts of antiCD4 from 1–100 μg and
found that 20 μg was enough for conjugating with 0.4 mg of
nanoparticles. The magnetically sorted cells were observed
7
Adv. Nat. Sci.: Nanosci. Nanotechnol. 6 (2015) 015008
H L Nguyen et al
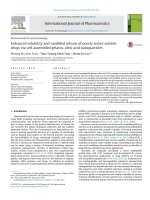
amplified bands in the samples in lanes 1’ and 3’, possibly
due to the low levels of purified template DNA obtained when
using Dynabeads. We conclude then that Fe3O4/SiO2
nanoparticles may be more efficient than Dynabeads in
DNA isolation of HBV from serum.
3.4.4.2. Purification of DNA of Epstein–Barr viruses (EBV)
using silica-coated magnetic nanoparticles and optimized
buffers. Fe3O4/SiO2 nanoparticles and the buffers were
Figure 6. Electrophoresis result of PCR products of HBV specific
gene using DNA purified by Fe3O4/SiO2 nanoparticles: 100 bp DNA
ladder, (+) positive control: PCR product of purified pGEM-HBV,
(−) negative control, lane 1 to 6: PCR products using purified DNA
from samples from No. 1-6 by Fe3O4/SiO2 nanoparticles, lanes 1’ to
6’: PCR products using purified DNA from samples from No.1-6 by
Dynabeads.
then used to isolate DNA of EBV in real serum samples, in
comparison to Dynabeads [10]. Among 10 suspected EBV
infected serum samples, we could detect clearly 250 bpspecific bands for EBV in samples 7 and 10 using both
Fe3O4/SiO2 nanoparticles and Dynabeads. However, the
brighter signals were observed when using Fe3O4/SiO2
nanoparticles (not shown here), indicating that the DNA
isolation efficiency of EBV by Fe3O4/SiO2 nanoparticles was
higher than that using Dynabeads. The result in table 2
indicates that higher concentrations of EBV (copies/ml) in
both samples were measured with using Fe3O4/SiO2
nanoparticles to purify DNA compared to those with using
Dynabeads. The increase in DNA isolation efficiency by
Fe3O4/SiO2 nanoparticles is likely due to a larger total surface
of silica-coated magnetic nanoparticles. During the process of
DNA isolation, we have found that the time required for
magnets to attract completely the Dynabeads from solution
was much longer, about 2–3 min, compared to 15–20 s for
Fe3O4/SiO2 nanoparticles. This phenomenon is probably also
due to the fact that Fe3O4/SiO2 nanoparticles have a larger
total surface area compared to that of the Dynabeads.
3.4.4. Detection of pathogenic viruses
3.4.4.1. Purification of DNA of Hepatitis virus type B (HBV)
using silica-coated magnetic nanoparticles and optimized
buffers. Before testing the DNA purification procedure
with real serum samples, we measured the efficiency of
DNA recovery of the Fe3O4/SiO2 nanoparticles and the
optimized buffers using standard pure pGEM-HBV plasmid
at tenfold diluted concentrations ranging from 4 × 10⁹ copies
ml−1 to 4 × 10² copies ml−1. The enriched DNA solutions
were used as templates for amplification of 434 bp fragment
of S gene specific for HBV [10]. The results indicates that
Fe3O4/SiO2 nanoparticles and the optimized buffer could
successfully enrich DNA from solution and that the purified
DNA was qualified for further PCR-based detection of HBV
at a sensitivity of 4 × 10² copies ml−1.
We then used Fe3O4/SiO2 nanoparticles and the buffers
to isolate DNA of HBV in six real serum samples (one
negative, figure 6, lane 5 and five positives, figure 6, lanes
1–4, 6). As a result, we could observe faint specific bands of
434 bp for HBV in samples in lanes 1 and 3, and very bright
bands of 434 bp for HBV in samples in lanes 2, 4, and 6.
Meanwhile, no band was observed in the sample in lane 5.
The data indicates that six real serum samples had different
concentration of virus copies, of which the sample in lane 6
had the highest virus load. Our data were in good agreement
with those confirmed by the hospital where the samples were
collected. In parallel, we performed similar experiments with
these six serum samples using the commercialized silicacoated magnetic microparticles Dynabeads® myoneTM silane
(short name: Dynabeads, Life Technologies). As shown in
figure 6, clear bands of 434 bp for HBV were observed in the
samples in lanes 2’, 4’, and 6’. However, intensities of those
bands were weaker compared to those in the same samples in
lanes 2, 4, and 6 obtained in the case of Fe3O4/SiO2
nanoparticles. We could not observe the specific PCR-
4. Conclusion and perspective
This work reviews numerous methods of synthesis and
functionalization of gold and silver nanoparticles, magnetic
nanoparticles Fe3O4, combination of 4-ATP-coated silver
nanoparticles and Fe3O4 nanoparticles. Some applications of
the prepared nanoparticles in life sciences and the environment are discussed.
It is expected that new fabrication approaches in an
environmental friendly way will be introduced. Efforts will be
made for improving nanoparticles manufacturing that requires
less energy and fewer toxic materials (‘green manufacturing’)
which sometimes is referred to as ‘green nanotechnogy’. An
example of ‘green nanotechnogy’ is the development of
aqueous-based microemulsion or inverse microemulsion
described above. As the functionality of nanoparticles
becomes more complex, the major trend in further
Table 2. Quantitation of EBV load in serum using DNA templates purified by Fe3O4/SiO2 nanoparticles and Dynabeads [10].
Sample number
7
10
Material for DNA isolation
Fe3O4/SiO2 nanoparticles
Dynabeads
Fe3O4/SiO2 nanoparticles
Dynabeads
8
Ct (threshold cycle)
Virus load (copies ml−1)
36.2
40.62
26.78
27.73
7.17 × 10³
6.53 × 10²
1.18 × 10⁶
7.04 × 10⁵
Adv. Nat. Sci.: Nanosci. Nanotechnol. 6 (2015) 015008
H L Nguyen et al
development of nanoparticles is to make them multifunctional
which has the potential to integrate various functionalities,
and use them for manufacturing nano-devices.
[11] Chu T D, Nguyen Q L, Phi T H, Dinh T T D, Tran T H,
Luu M Q and Nguyen H N 2014 VNU J. Sci., Math—Phys.
(Vietnam National University in Hanoi) 30 1
[12] Bruce I J and Sen T 2006 Langmuir 21 7029
[13] Ulman A 1996 Chem. Rev. 96 1533
[14] Sokolov K, Follen M, Aaron J, Pavlova I, Malpica A,
Lotan R and Richards-Kortum R 2003 Cancer Res. 63 1999
[15] West J L and Halas N J 2003 Annu. ReV. Biomed. Eng. 5 285
[16] Paciotti G F, Myer L, Weinreich D, Goia D, Pavel N,
McLaughlin R E and Tamarkin L 2004 Drug Delivery
11 169
[17] Jain K K 2005 Technol. Cancer Res. Treat. 4 407
[18] Okamura M, Kondo T and Uosaki K 2005 J. Phys. Chem.
109 9897
[19] Cirstoiu-Hapca A, Bossy-Nobs L, Buchegger F, Gurny R and
Delie F 2007 Int. J. Pharmaceut. 331 190
[20] Yezhelyev M V, Gao X, Xing Y, Al-Hajj A, Nie S and
O’Regan R M 2006 Lancet Oncol. 7 657
[21] Ferrari M 2005 Nat. Rev. Cancer 5 160
[22] Harari P M, Huang S M, Herbst R and Quon H 2003 Head and
Neck Cancer: A Multidisciplinary Approach (Philadelphia,
PA: Lippincott, Williams and Wilkins) p 1001
[23] www.gene.com/gene/products/education/oncology/
herpathway.jsp
[24] Khuat T N, Nguyen V A T, Phan T N, Can V T,
Nguyen H H and Nguyen C 2008 J. Korean Phys. Soc.
53 3832
[25] Kim J S et al 2007 Nanomedicine 3 95
[26] Pal S, Tak Y K, Joardar J, Kim W, Lee J E, Han M S and
Song J M 2009 J. Nanosci. Nanotechnol. 9 2092
[27] Kvitek L, Panacek A, Soukupova J, Kolar M, Vecerova R,
Prucek R, Holecova M and Zboril R 2008 J. Phys. Chem. C
112 5825
[28] Kim S, Kim S S, Bang Y J, Kim S J and Lee B J 2003 Peptides
24 945
[29] Hai N H, Chau N, Luong N H, Anh N T V and Nghia P T 2008
J. Korean Phys. Soc. 53 1601
[30] Yean S, Cong L, Yavuz C T, Mayo J T, Yu W W, Kan A T,
Colvin V L and Tomson M B 2005 J. Mater. Res. 20 3255
[31] Ryan K J and Ray C G 2004 Sherris Medical Microbiology 4th
edn (New York: McGraw Hill)
[32] Tuan M A, Binh N H, Tam P D and Chien N D 2005 Comm.
Phys. 15 218
Acknowledgments
The authors would like to thank Professor N N Long,
Professor N T V Anh, Professor P T Nghia, Dr. I Notingher
and Professor M Henini for close collaboration.
References
[1] Sun S, Murray C B, Weller D, Folks L and Moser A 2000
Science 287 1989
[2] Salata O V 2004 J. Nanobiotechnol. 2 3
[3] Mody V V, Siwale R, Singh A and Mody H R 2010 J. Pharm.
Bioallied Sci. 2 282
[4] Lu A-H, Sabalas E L and Schuth F 2007 Angew. Chem. Int. Ed.
46 1222
[5] Zhang L, Gu F X, Chan J M, Wang A Z, Langer R S and
Farokhzad O C 2008 Clinical Pharmacol. Ther. 83 761
[6] Luu M Q, Tran Q T, Nguyen H L, Nguyen N L, Nguyen H H,
Tran T T T, Nguyen T V A and Phan T N 2011 e-J. Surf.
Sci. Nanotech. 9 544
[7] Luu M Q, Nguyen H N, Kong K, Nguyen T N, Pham B D,
Nguyen T T, Notingher I, Nguyen H L and Henini M 2014
Surface-enhanced Raman study of 4-ATP on gold
nanoparticles in basal cell carcinoma fingerprinted detection,
to be published
[8] Tran Q T, Nguyen V S, Hoang T K D, Nguyen H L, Bui T T,
Nguyen T V A, Nguyen D H and Nguyen H H 2011
J. Hazard. Mater. 192 1321
[9] Hai N H, Phu N D, Luong N H, Chau N, Chinh H D,
Hoang L H and Leslie-Pelecky D L 2008 J. Korean Phys.
Soc. 52 1327
[10] Dao V Q, Nguyen M H, Pham T T, Nguyen H N, Nguyen H H,
Nguyen T S, Phan T N, Nguyen T V A, Tran T H and
Nguyen H L 2013 J. Nanomater. 2013 603940
9