DSpace at VNU: The microwave-assisted synthesis and characterization of Zn1-xCoxO nanopowders
Bạn đang xem bản rút gọn của tài liệu. Xem và tải ngay bản đầy đủ của tài liệu tại đây (777.25 KB, 4 trang )
Materials Letters 64 (2010) 962–965
Contents lists available at ScienceDirect
Materials Letters
j o u r n a l h o m e p a g e : w w w. e l s e v i e r. c o m / l o c a t e / m a t l e t
The microwave-assisted synthesis and characterization of Zn1 − xCoxO nanopowders
Luc Huy Hoang a,⁎, Pham Van Hai a, Nguyen Hoang Hai b, Pham Van Vinh a, Xiang-Bai Chen c,⁎, In-Sang Yang c
a
b
c
Faculty of Physics, Hanoi National University of Education, 136 Xuanthuy, Caugiay, Hanoi, Viet Nam
Center for Materials Science, Hanoi University of Science, 334 Nguyen Trai, Hanoi, Viet Nam
Department of Physics, Ewha Womans University, Seoul, 120-750, South Korea
a r t i c l e
i n f o
Article history:
Received 9 September 2009
Accepted 27 January 2010
Available online 1 February 2010
Keywords:
Microwave-assisted synthesis
Zn1 − xCoxO nanopowders
Optical properties
a b s t r a c t
In this paper, we present a simple microwave-assisted synthesis of Zn1 − xCoxO nanopowders. With the advantages
of the microwave-assisted method, we have successfully synthesized good crystalline quality and good surface
morphology Zn1 − xCoxO nanopowders. The nanopowders are characterized by X-ray diffraction (XRD), scanning
electron microscopy (SEM), UV–VIS absorption, and micro-Raman spectroscopy. We found, in the synthesis process,
the surfactant Triethanolamine (TEA) plays an important role on the morphology of Zn1 − xCoxO nanoparticles. The
XRD study shows that for Co doping up to 5%, Co2+ ions are successfully incorporated into the ZnO host matrix. The
absorption spectra of Zn1 − xCoxO (x=1–5%) nanopowders show several peaks at 660, 611 and 565 nm, indicating
the presence of Co2+ ions in the tetrahedral sites. The Raman study shows that the linewidth of Elow
2 mode increases
with Co concentration, which further indicates the incorporation of Co2+ ions into the ZnO host matrix.
© 2010 Elsevier B.V. All rights reserved.
1. Introduction
ZnO nanopowders have attracted considerable interest due to the
potential applications including photonic devices, chemical and
biological sensors, light emitting diodes, laser diodes, ultravioletprotection, etc. [1–5]. Moreover, among II–VI semiconductors, ZnO
has been considered as one of the promising candidates for fabricating
diluted magnetic semiconductor (DMS), due to its high solubility for
transition metals (TM) and superior semiconductor properties.
A number of methods have been used for synthesizing ZnO
nanopowders [6–12] In recent years, a new method has been reported:
microwave-assisted synthesis. Due to its unique features such as short
reaction time, enhanced reaction selectivity, energy saving, and high
reaction rate [5,13], the application of microwave-assisted synthesis of
ZnO nanoparticles has been rapidly growing [13–17]. Co doping into the
Zn-site of the wurtzite ZnO structure homogeneously without changing
the crystal structure is crucial not only for clarifying the contradictory
claims among different groups about the high-temperature ferromagnetism in this material, but also for potential applications of the noble
properties of this DMS material. Co-doped ZnO nanopowders have been
synthesized in various methods, including a simple chemical method
[18], and a co-precipitation technique [19]. However, synthesis of Codoped ZnO nanopowders taking the advantage of the microwave
assistance has not been reported yet. In this paper, we present a simple
microwave-assisted chemical method to produce Zn1 − xCoxO nano-
⁎ Correspondence authors. Hoang is to be contacted at Faculty of Physics, Hanoi
National University of Education, 136 Xuanthuy, Caugiay, Hanoi, Viet Nam. Chen,
Department of Physics, Ewha Womans University, Seoul, 120-750, South Korea.
E-mail addresses: (L.H. Hoang),
(X.-B. Chen).
0167-577X/$ – see front matter © 2010 Elsevier B.V. All rights reserved.
doi:10.1016/j.matlet.2010.01.074
powders, using zinc acetate dihydrate and cobalt acetate tetrahydrate as
precursors. We have produced single phase Zn1 − xCoxO nanopowders of
uniform surface morphology and good crystalline quality with average
particle size ∼50 nm. The nanopowders are characterized by XRD, SEM,
UV–VIS absorption, and Raman scattering.
2. Experiments
Sodium hydroxide (NaOH), zinc acetate dehydrate [Zn(CH3COO)2·
2H2O], cobalt acetate tetrahydrate [Co(CH3COO)2·4H2O], and Triethanolamine (TEA) were purchased from Aldrich. All the reagents were
analytically pure and were used without further purification. In a typical
experiment, Zn(CH3COO)2·2H2O and Co(CH3COO)2·4H2O were separately dissolved in distilled water. The two solutions were mixed in a
proportion to obtain a mixture solution with 0, 1, 2, 5, or 7% Co2+, and
NaOH was slowly added into the mixture solution. Then TEA was added
drop by drop into the above solution, which was stirred with a magnetic
stirrer, until pH reached 9 and the solution became colorless or green.
The obtained solution was heated by a Sanyo microwave oven at a
power of 300 W for 20 min. After microwave processing, the solution
was cooled to room temperature. The resulted precipitate was separated
by centrifugation, then washed with deionized water and acetone for
several times, and finally dried in an oven at 60 °C for 24 h and annealed
at 600 °C for 1 h in air.
XRD of Zn1 − xCoxO nanopowders was carried out on a Siemens
D5500 X-ray diffractometer. SEM images were taken on a Hitachi S-4800
field-emission scanning electron microscope. The JASCO V670 UV–VIS
spectrophotometer, equipped with diffuse reflectance accessory (DRA),
was employed to record the electronic spectra of the powder samples in
the region 200–900 nm. The diffuse reflectance measurements were
converted into absorption using Kubelka–Munk function (f(R∞) =
L.H. Hoang et al. / Materials Letters 64 (2010) 962–965
(1 − R∞)2 / 2R∞). The Raman scattering was performed using a
Jobin–Yvon T64000 micro-Raman system in the back scattering
geometry with a 532 nm laser excitation.
3. Results and discussions
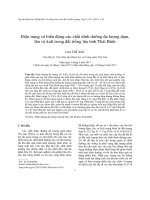
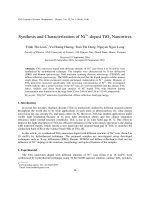
Fig. 1 shows the XRD patterns of all the Zn1 − xCoxO nanopowders, in
which, Fig. 1a is for ZnO powders prepared without TEA, Fig. 1b is for ZnO
powders prepared with TEA, and Fig. 1c–f is for Co-doped (1–7%) ZnO
powders. The diffraction peaks are indexed as those from the known
wurtzite ZnO with lattice constants a) 0.325 nm and c) 0.521 nm, within
experimental error (JCPDS, file no. 36-1451). It can be seen from Fig. 1a
and b, TEA has no significant effect on the structure of ZnO powders.
While, we will show in our later discussion, TEA has an important effect
on the morphology of ZnO powders. No characteristic peaks of other
phases or impurities were observed with Co doping up to 5% (Fig. 1c, d, e)
comparing with those of ZnO powders, indicating a single hexagonal
phase. However, it can be seen in the inset of Fig. 1, the peak position
increases with Co concentration, which indicates the decrease of lattice
parameters. This phenomenon presumably results from the substitution
of Co ions with a small ionic radius of 0.58 Å for Zn (0.60 Å) sites. For Co
doping of 7%, a secondary impurity phase corresponding to Co3O4 was
clearly observed, as marked by filled circles in Fig. 1f. On the basis of the
linewidths of (100), (002) and (101) diffraction peaks, the mean particle
size of Zn1 − xCoxO nanopowders were calculated according to Scherrer
equation, the results are shown in Table 1. As can be seen in Table 1,
without TEA, ZnO nanoparticles of ∼70 nm were produced, while with
TEA, the particle size decreased to ∼54 nm. In previous studies, it has
been shown that TEA plays as an organic capping agent in the reaction
media [20], hindered the crystal growth [20,21], and also controls the pH
of preliminary solution [22]. The crystalline size decreases further when
Co is doped, which suggests Co incorporation into the ZnO lattice, as
observed in other systems [23,24].
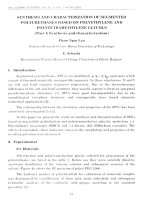
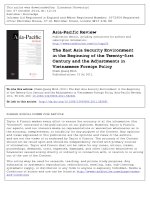
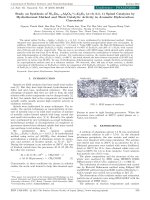
The size and morphology of Zn1 − xCoxO nanoparticles were further
analyzed by SEM studies, which are represented in Fig. 2. As can be
963
Table 1
Nanoparticle size calculated from the (100), (002) and (101) peaks using Scherrer
equation.
Sample
Nanoparticle size (nm)a
Note
ZnO
ZnO
ZnO
ZnO
ZnO
70
54
42
36
40
Without TEA surfactant
With TEA surfactant
With TEA surfactant
With TEA surfactant
With TEA surfactant
a
powder
powder
doped 1% Co
doped 2% Co
doped 5% Co
After adjusting for instrumental broadening.
seen in Fig. 2a and b, TEA produces a significant effect on the
morphology of the ZnO nanopowders. Without TEA, various nonuniform particles are produced. While, with TEA, uniform spherical
particles are produced. The particle size is about 50–70 nm, which is
in good agreement with the XRD data. The reduction of particle size
with Co doping was also observed in the SEM images (Fig. 2c and d),
again agrees with the XRD data.
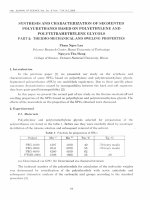
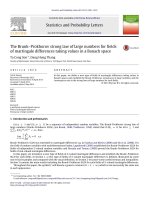
The absorption spectra of the Zn1 − xCoxO nanopowders, obtained
from diffuse reflectance measurement at room temperature, are
presented in Fig. 3. We found, the band edge energy redshifts with Co
doping. The band edge energies of pure ZnO and 1%, 2%, 5% Co doping,
determined from the optical absorption spectra, are 3.27, 3.26, 3.23,
and 3.22 eV, respectively. The redshift is due to sp–d exchange
interactions between the band electrons and the localized d electrons
of Co2+ cations [25,26]. As can be seen in Fig. 3, the absorption spectra
of Co-doped ZnO nanopowders show three absorption peaks at 660,
611, and 565 nm. These absorption peaks have been identified with
d–d transition of the high spin Co2+ 3d7-4F ion in tetrahedral oxygen
coordination [26,27]. The absorption peaks at 660, 611, and 565 nm,
are corresponding to the transitions from 4A2 to 4T1(4P), 2E(2G), and
4
T1(4F), respectively. The appearance of these transitions confirms
that Co2+ ions have substituted the Zn2+ ions in the tetrahedral sites.
The XRD and UV–VIS absorption studies discussed above have
revealed that Co was successfully incorporated into the ZnO lattice
without changing the host wurtzite structure. To gain further information
Fig. 1. XRD patterns of ZnO nanopowders obtained without TEA (a), with TEA (b), and Zn1 − xCoxO nanopowders of x = 1% (c), 2% (d), 5% (e) and 7% (f). All the Co-doped
nanopowders are obtained with TEA.
964
L.H. Hoang et al. / Materials Letters 64 (2010) 962–965
Fig. 2. SEM images of ZnO nanopowders obtained without TEA (a), with TEA (b), and Zn1 − xCoxO nanopowders with x = 1% (c) and 7% (d). The SEM images of 2% and 5% Co doping
are very similar to that of 1% and 7%, which are not presented here.
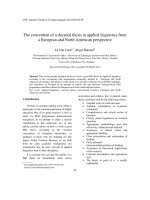
on the Zn1 − xCoxO nanopowders, we then performed Raman scattering
study. Fig. 4 shows first-order Raman spectra obtained at room
temperature. The obtained phonon frequencies of ZnO powders
(Fig. 4a) are consistent with previous studies [28–31]. The peaks at 99,
low
high
200, 332, 437, and 580 cm− 1 can be assigned to Elow
− Elow
2 , 2E2 , (E2
2 ),
Ehigh
,
and
A
(LO),
respectively
[30,31].
The
observed
intense
and
sharp
2
1
E(high)
and E(low)
peaks confirm good crystallinity of the ZnO nanopow2
2
ders. The Elow
mode decreases in intensity and shifts to lower frequency
2
with increasing Co concentration. Since the Elow
2 mode involves mainly Zn
motion, the shifting and broadening of this peak can be associated with
the substitution of Co to Zn in the host lattice [28]. The systematic
broadening of Elow
2 peak confirms that the substitution of Co at the Zn-site
Fig. 3. Absorption spectra of ZnO nanopowders (a), and Zn1 − xCoxO nanopowders of x = 1% (b), 2% (c), and 5% (d).
L.H. Hoang et al. / Materials Letters 64 (2010) 962–965
965
Fig. 4. Raman spectra of ZnO nanopowders (a), and Zn1 − xCoxO nanopowders of x = 1% (b), 2% (c), 5% (d), and 7% (e).
is proportional to the Co concentration up to 5%. Moreover, the
observation of the broad peak at ∼552 cm− 1 in the Raman spectra of
Zn1 − xCoxO nanopowders (Fig. 4b, c, d), not observed in ZnO nanopowders (Fig. 4a), gives a clear evidence for the Co substitution in ZnO host
lattice [32]. As the Co content increases to 7%, the Ehigh
peak intensity
2
decreases quickly, which can be attributed to the disordering of cations
around oxygen. In addition, the Raman spectrum of 7% Co doping shows
several additional peaks at ∼486, 523, and 625 cm− 1, indicating the
formation of a secondary phase of Co3O4 [33,34], which is consistent with
the XRD results presented in Fig. 1.
As can be seen in Fig. 4, no detectable peaks corresponding to
secondary phases were presented in Zn1 − xCoxO nanopowders up to 5%.
However, the possibility of the existence of hidden secondary phases still
cannot be simply ruled out. Our recent study shows that due to the
inhomogeneity of the Zn1 − xCoxO nanopowders, hidden secondary phases
are also presented in Co doping below 5%, the details of this study will be
presented elsewhere. Hidden secondary phases of Zn1 − yCo3 − yO4 were
also detected in 4.5% Co-doped ZnO nanorods in a recent report [35].
4. Conclusion
Zn1 − xCoxO nanopowders are successfully prepared using a simple
microwave-assisted method. We find that the surfactant TEA has
negligible influence on the phase of the final product, while it affects
the morphology significantly. The average particle size of Zn1 − xCoxO
nanopowders with TEA is ∼50 nm, determined by SEM and XRD
analysis. The successful incorporation of Co into ZnO is evidenced by
XRD, UV–VIS absorption, and micro-Raman scattering, which show
that Co is homogeneously incorporated into the Zn-site without
changing the host wurtzite structure for Co doping up to 5%.
Acknowledgments
This work was supported by NAFOSTED Grant 103.03.93.09, 2010
Key Project of Vietnam National University, Hanoi, Viet Nam and
Quantum Metamaterials Research Center financed by Korea Science and
Engineering Foundation Grant (R11-2008-503-03001).
References
[1] Peiro AM, Ravirajan P, Govender K, Boyle DS, O'Brien P, Bradley DDC, Nelson J,
Durrant JR. J Mater Chem 2006;16:2088.
[2] Peiro AM, Domingo C, Peral J, Domenech X, Vigil E, Hernandez- Fenollosa MA,
Mollar M, Mari B, Ayllon JA. Thin Solid Films 2005;483:79.
[3] Baek S, Song J, Lim S. Physica B 2007;399:101.
[4] Wu L, Wu Y, Pan X, Kong F. Opt Mater 2006;28:418.
[5] Ela SE, Cogal S, Icli S. Inorg Chim Acta 2009;362:1855.
[6] Yong GX, Geng LQ, Liang FH, Fen LY, Xiao LJ. Thin Solid Films 2009;517:4684.
[7] Premkumar T, Manoravi P, Panigrahi BK, Baskar K. Appl Surf Sci 2009;255:6819.
[8] Kim NJ, Choi S, Lee HJ, Kim KJ. Cur Appl Phys 2009;9:643.
[9] Ti EI, Seitz K. Am Ceram Soc Bull 1987;66:1384.
[10] Lee NY, Kim MS. J Mater Sci 1991;26:1126.
[11] Haile SM, Jonhagon DW, Wiserm GH. J Am Ceram Soc 2004;72.
[12] Lu CH, Yeh CH. Ceram Int 2000;26:351.
[13] Krishnakumar T, Jayaprakash R, Pinna N, Singh VN, Mehta BR, Phani AR. Mater Lett
2009;63:242.
[14] Liu JS, Cao JM, Li ZQ, Ji GB, Zheng MB. Mater Lett 2007;61:4409.
[15] Wang X, Jia J, Zhao L, Sun T. Appl Surf Sci 2008;254:5445.
[16] Ma MG, Zhu YJ, Cheng GF, Huang YH. Mater Lett 2008;62:507.
[17] Hammarberg E, Schwab AP, Feldmann C. J Colloid Interface Sci 2009;334:29.
[18] Xu X, Cao C. J Magn & Magn Mater Dig 2009;321:2216.
[19] Maensiri S, Laokul P, Phokha S. J Magn & Magn Mater Dig 2006;305:381.
[20] Liu J, Li K, Wang H, Zhu M, Xu H, Yan H. Nanotechnology 2005;16:82.
[21] Li P, Wei Y, Liu H, Wang XK. J Solid State Chem 2005;178:855.
[22] Mohajerani MS, Mazloumi M, Lak A, Kajbafvala A, Zanganeh S, Sadrnezhaad SK.
J Cryst Growth 2008;310:3621.
[23] Hays J, Punnoose A, Baldner R, Engelhard MH, Peloquin J, Reddy KM. Phys Rev B
2005;72:075203.
[24] Davis SR, Chadwick AV, Wright JD. J Phys Chem B 1997;101:9901.
[25] Bouloudenine M, Viart N, Colis S, Kortus J, Dinia A. Appl Phys Lett 2005;87:052501.
[26] Koidl P. Phys Rev B 1977;15:2493.
[27] Kim KJ, Park YR. Appl Phys Lett 2002;81:1420.
[28] Hoang LH, Hien NTM, Hai NH, Hai PV, Khoi NT, Yang IS. J Raman Spectrosc 2009;40:
1535.
[29] Arguello CA, Rosseau DL, Porto SPS. Phys Rev 1969;181:1351.
[30] Calleja JM, Cardona M. Phys Rev B 1977;16:3753.
[31] Cusco R, Llado EA, Ibanez J, Artus L, Jimenez J, Wang B, Callahan MJ. Phys Rev B
2007;75:165202.
[32] Samanta K, Bhattacharya P, Katiyar RS, Iwamoto W, Pagliuso PG, Rettori C. Phys
Rev B 2006;73:245.
[33] Schwartz DA, Norberg NS, Nguyen PQ, Parker JM, Gamelin DR. J Am Chem Soc
2003;125:13205.
[34] Dieguez A, Rodriguez AR, Vila A, Morante JR. J Appl Phys 2001;90:1550.
[35] Wang X, Zheng R, Liu Z, Ho H, Xu J, Ringer SP. Nanotechnology 2008;19:455702.