DSpace at VNU: Drivers of forest cover dynamics in smallholder farming systems: The case of northwestern vietnam
Bạn đang xem bản rút gọn của tài liệu. Xem và tải ngay bản đầy đủ của tài liệu tại đây (895.91 KB, 13 trang )
AMBIO 2013, 42:344–356
DOI 10.1007/s13280-012-0348-4
REPORT
Drivers of Forest Cover Dynamics in Smallholder Farming
Systems: The Case of Northwestern Vietnam
Isaline Jadin, Veerle Vanacker, Huong Thi Thu Hoang
Received: 13 March 2012 / Revised: 11 July 2012 / Accepted: 30 August 2012 / Published online: 22 September 2012
Abstract The national-scale forest recovery of Vietnam
started in the early 1990s and is associated with a shift from
net deforestation to net reforestation. Large disparities in
forest cover dynamics are, however, observed at the local
scale. This study aims to unravel the mechanisms driving
forest cover change for a mountainous region located in
northwest Vietnam. Statistical analyses were used to
explore the association between forest cover change and
household characteristics. In Sa Pa district, deforestation
rates are decreasing, but forest degradation continues at
similar rates. Deforestation is not necessarily associated
with impoverished ethnic communities or high levels of
subsistence farming, and the largest forest cover dynamics
are found in villages with the best socio-economic conditions. Our empirical study does not provide strong evidence
of a dominant role of agriculture in forest cover dynamics.
It shows that empirical studies on local-scale forest
dynamics remain important to unravel the complexity of
human–environment interactions.
Keywords Forest transition Á Vietnam Á
Ethnic minorities Á Subsistence agriculture Á Poverty
INTRODUCTION
In tropical regions, deforestation has been one of the most
important processes of land cover changes in recent decades (Lambin et al. 2003). In Vietnam, forests were still
abundant in the mid-twentieth century in the mountainous
areas (Tugault-Lafleur 2007). This period was followed by
a phase of rapid deforestation to reach a minimum forest
cover in the late 1980s (Meyfroidt and Lambin 2008a). In
the early 1990s, the nation-wide forest cover was estimated
at 25–31 %. According to Meyfroidt and Lambin (2008b),
123
deforestation was mainly caused by agricultural expansion
following population increase from both natural population
growth and migrations. Since the mid-1990s, this trend has
been reversed. The nation-wide forest cover has increased
through natural regeneration and tree plantations to reach
again 32–37 % in 1999–2001 and 34–42 % in 2005
(Meyfroidt and Lambin 2008a). Reforestation would be the
result of a combination of economic and political responses
to (i) lack of forest, (ii) economic growth, and (iii) market
integration at the national level.
However, the rapid recovery of Vietnamese forests
during the last two decades was not only the result of
domestic efforts, but also of the displacement of wood
extraction to neighboring countries (Meyfroidt and Lambin
2009). According to Meyfroidt and Lambin (2009), the
equivalent of 39.1 % of the volume of wood regrowth
would have been extracted from forests abroad to supply
Vietnam’s needs. Since logging was severely restricted in
natural forests by forestry policies throughout the 1990s,
the domestic supply of wood became insufficient to meet
the domestic demand, especially to feed the growing processing industry in round wood. As neighboring countries
also implemented bans on raw wood exports, the raw
material was increasingly supplied by illegal imports from
other countries, mainly from Cambodia in the early 1990s
(Global Witness 1999) and Laos since the early 2000s
(EIA-Telapak 2008), but later also from Malaysia, Myanmar, and Indonesia (EIA-Telapak 2008; Meyfroidt and
Lambin 2009).
The recognition of a forest transition, i.e., a change from
shrinking to expanding forests (Mather 1992), in Vietnam
is associated with a shift from nation-wide decrease to
increase in forest cover, and may mask large disparities at
local and regional scales (Meyfroidt and Lambin 2008b).
Moreover, the main drivers of nation-wide deforestation
Ó Royal Swedish Academy of Sciences 2012
www.kva.se/en
AMBIO 2013, 42:344–356
345
and reforestation do not necessarily apply to local levels as
drivers of forest cover change interact differently at various
spatial scales. In the mountainous area of northern Vietnam, for example, Vu et al. (2012) suggests that ethnic
factors play an important role in forest cover dynamics.
Other studies highlight the importance of socio-economic
and demographic settings on forest cover change (Shortle
and Abler 1999; Tugault-Lafleur 2007). The nature of these
relationships is not always well understood.
In rural areas, the poorest segments of the population
often rely on forests for survival (Tugault-Lafleur 2007;
Coulibaly-Lingani et al. 2009). A growing body of literature suggest that forest products often act as a ‘safety nets’
or a form of insurance for the rural poor, as a large proportion of people in developing countries obtain an
important part of their subsistence and some cash income
from a wide set of forest products and forest-related
activities (Vanacker et al. 2003; Coulibaly-Lingani et al.
2009). The use of forest products allows livelihood diversification, but may lead to forest degradation and/or net
deforestation when it is not (well) controlled. In the highlands of northern Vietnam, ethnic minorities living in or
nearby forests for many generations are the most dependent
on forests as infrastructure, education and information are
often lacking (Frontier Vietnam 1997). Forests have played
a key role in sustaining their livelihoods and reducing their
vulnerability to crop failures or other hardships, supplying
households with fodder, fuel, wood construction materials,
herbal medicines, honey, and game (Tugault-Lafleur and
Turner 2009). Ethnic groups are usually thought to be the
greatest destroyers of forests with their customs, and their
cultural and socio-economic characteristics differing sharply from those of the numerically dominant Kinh, what
causes mutual misunderstanding and dislike (Fox et al.
2000; Delang 2002). According to Frontier Vietnam
(1999), their low socio-economic conditions force marginal
households to exploit forest resources. Yet, being highly
dependent on the natural resources, they are also the most
intensely and directly affected by negative impacts of
forest degradation and deforestation. In contrast to traditional thinking, this could encourage them to take care of
the natural resources they rely on.
An expansion of agricultural land through deforestation
is often reported for tropical countries dominated by
developing economies (Geist and Lambin 2001). The food
demand of the rapidly growing population is associated
with intensification and expansion of the agricultural landuse (e.g., Angelsen 1999; Barbier and Burgess 2001;
Bahadur 2011). Due to shortage of arable land, natural
(forested) ecosystems in tropical regions are increasingly
converted into grasslands and/or croplands (Barbier and
Burgess 2001). In their study on the pathways of agricultural expansion across the tropics, Gibbs et al. (2010) show
that between 1980 and 2000, more than 55 % of new
agricultural land came at the expense of intact rainforests
and another 28 % from disturbed rainforests. More specifically, Southeast Asia relied on intact forests for nearly
60 % of new agricultural land and on disturbed forests for
more than 30 %. In the Vietnamese northern highlands,
most ethnic minorities still live on subsistence agriculture
generally combining permanent rice cultivation in the
valley bottoms and shifting farming on the hillslopes (Fox
et al. 2000; Tugault-Lafleur 2007). In past decades, a
scarcity of land coupled with a population growth has led
to an increasing pressure on forests. As the recently converted agricultural lands are often less appropriate for
cultivation, they are prone to rapid decline of soil fertility
and/or increased erosion (Frontier Vietnam 1999). The rate
of deforestation tends to increase through agricultural
expansion. Furthermore, some households grow cash crops
such as cardamom under the forest canopy, what might
lead to forest degradation (Tugault-Lafleur and Turner
2009). Cardamom cultivation has been identified as one of
the main threats to the forest in northeastern Tanzania, the
Indian Western Ghats, Guatemala, and in the Central
Highlands of Sri Lanka (Reyes et al. 2006; IUCN 2010). In
these cases, forest degradation and even long-term disappearance of forest fragments due to cardamom cultivation
have been documented. Growing cardamom inside forests
requires clearing the understory and middle layer, and
thinning the tree canopy, what may hamper regeneration
once the crop is abandoned.
It is generally thought that subsistence farmers that are
most active in agriculture are the most responsible for rapid
forest degradation and/or deforestation (Fox et al. 2000;
Geist and Lambin 2001). Since the advent of modern
farming practices, subsistence agriculture—often associated to shifting cultivation—has been blamed by many
critics, from colonial powers to the FAO, and from academics to the popular press, which consider it as an inefficient use of the forest that ultimately leads to deforestation
(Delang 2002). This negative view of subsistence farmers as
destroyers of the forest is amplified in regions where they
are ethnic minorities, as in the mountainous northwestern
Vietnam, because their farming technique are seen as
primitive and particularly destructive by the lowland Kinh
(Fox et al. 2000; Delang 2002). However, the role of agriculture in deforestation that is reported for developing
economies might be far more complex at the local scale.
Subsistence farming encompasses a wide range of cultivation practices (Fox et al. 2000), some of which might have
limited impacts on forest resources compared to other
activities such as timber logging or infrastructure development (Geist and Lambin 2001).
In this study, we aim to unravel the mechanisms
underlying forest cover change for a study site in the
Ó Royal Swedish Academy of Sciences 2012
www.kva.se/en
123
346
AMBIO 2013, 42:344–356
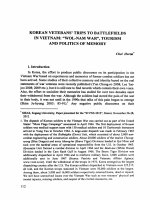
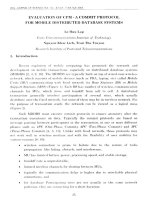
Fig. 1 Location of the study area in the Northern Vietnamese Mountains with: a the communes of the Sa Pa District belonging to the study area
in relation to the HLNP limits; and b the villages belonging to the study area. The names of the villages can be found in Fig. 4
mountainous area of northwestern Vietnam. The area is
home to several ethnic minorities who settled there some
generations ago and practice subsistence agriculture. While
they have evolved side by side, these ethnic communities
differ strongly by their agricultural and cultural practices,
access to market, socio-economic conditions, and educational systems. By linking land cover (1993–2006) and
household data, we specifically test (i) if the poorest ethnic
communities are associated with the largest forest
dynamics and (ii) if agricultural production plays a role in
forest cover dynamics at the local scale.
STUDY AREA
The study area is characterized by a rough topography, and
the western part is located on the northeast side of Hoang
Lien Mountain range. Elevation ranges from 180 m a.s.l. in
the easternmost part of the Ban Phung commune up to
3100 m at the southern border of the Sin Chai 2 village
(San Sa Ho Commune) (Fig. 1a, b). The climate presents a
high seasonality, being subtropical in summer and temperate in winter, and varies considerably within the study
area (Van Lanh 2004). The Hoang Lien range acts as a
123
barrier to atmospheric circulation, and the climate in the
southwestern part is particularly cloudy, cold and wet.
Further north and at the easternmost part of the area,
average temperatures are considerably higher.
The natural vegetation has strongly been influenced by
human activities (Frontier Vietnam 1999; Van Lanh 2004).
Fire, timber extraction, and land clearing for agriculture have
created a mosaic of intact primary forest, degraded forests,
shrubs, savannah, secondary forest in regeneration, forest
plantations, and agricultural land. The Hoang Lien Mountain
comprises probably the last remnants of old natural forests of
the uplands of northern Vietnam. It became one of the first
areas recognized as a ‘special use forest’ in Vietnam
according to Decision 194/CT dated 9/8/1986 from the
Chairman of the Ministerial Council, and it was converted
into the Hoang Lien National Park (HLNP) in July 2002
following the Prime Minister’s Decision 90/2002/QD-TTg
to protect biodiversity by preserving the subtropical and
temperate forest ecosystems (Van Lanh 2004). The area in
and around the HLNP has experienced rapid forest cover
change in recent decades. The spatial heterogeneity of these
dynamics, coupled with the ethnic, socio-economic and
cultural heterogeneity of the area offers the opportunity to
address the mechanisms underlying forest cover change.
Ó Royal Swedish Academy of Sciences 2012
www.kva.se/en
AMBIO 2013, 42:344–356
347
HLNP consists of two functional zones (1) a central part
of 29 845 ha covering the territory of six communes
belonging to the districts of Sa Pa (Lao Cai Province) and
Than Uyen (Lai Chau Province) and (2) a buffer zone
covering an area of 38 874 ha in the territory of 13 communes and one city (Sa Pa Town) belonging to 4 districts in
the provinces of Lao Chai and Lai Chau. This study was
conducted on 13 communes of the Sa Pa District, of which
8 communes belong at least partly to the National Park
(Fig. 1a). The 13 communes are composed of 58 villages
constituting the units of the study (Fig. 1b), as the village
community is the basic social system that collectively
manages local resources (Castella et al. 2005). The use of
natural resources is strongly regulated in the central part
and buffer zone of HLNP. Although policies related to
forest-use are expected to affect forest cover changes,
Tugault-Lafleur (2007) has shown that the minority communities in the Sa Pa district are almost indifferent to the
growing presence of the State and to markets forces,
remaining relatively autonomous both in terms of their
modes of economic production and socio-political organization. Most households are not fully aware of the limits of
the central part of HLNP and the existing regulation for the
buffer zone (Tugault-Lafleur 2007); and field observations
suggest that some of them continue to use the forest
resources even in strictly protected areas.
The mountainous area of North Vietnam is inhabited by
ethnic minorities (Saint-Macary et al. 2010). According to
a rural, agricultural, and fishery census realized in 2006 in
Sa Pa District, the area counts 30 412 inhabitants or 5019
households belonging to five different ethnic groups:
Hmong (66 % of households), Dao (19 %), Tay (7 %),
Kinh (6 %) (the Vietnamese majority group), and Day
(2 %). All these ethnic groups are settled in the area since
at least four or five generations (Michaud and Turner
2000). Apart from the Kinh who are mainly involved in
administration, tourism, and education, most of the ethnic
minorities practice different variants of subsistence agriculture (Tugault-Lafleur 2007). Local economy is predominantly rural. The farming system is characterized by
traditional cultivation of subsistence crops (mostly rice in
valley bottoms and terraces, maize and cassava on slopes),
vegetables and fruits in small home gardens, and animal
husbandry. The villages are not self-subsistent in terms of
food production and a number of households are experiencing hunger months (Tugault-Lafleur and Turner 2009).
Many households harvest forest products for their domestic
consumption or for sale. Some also cultivate cardamom as
cash crops, what was encouraged by the authorities after
the ban of opium in 1986. Most households have animals
like buffaloes, chickens, pigs, goats, cattle, horses, and/or
ducks. Some are raised for meat while others are used for
agricultural work and transportation. All, however, can be
sold in case of crop failure or resources exhaustion. Livestock represents thus a kind of insurance for households
(Tugault-Lafleur 2007). Tourism is growing in the area and
may increase future opportunities.
MATERIALS AND METHODS
Land Cover Dynamics (1993–2006)
Land cover change detection was performed using a time
series of Landsat satellite images downloaded from the
U.S. Geological Survey archives ():
Landsat 5 TM 1/02/1993, Landsat 7 ETM ? 27/12/1999,
and Landsat 5 TM 4/11/2006 (path/row: 128/38). All
images were corrected for atmospheric and topographic
effects using the MODTRAN-4 code and the semi-empirical topographic correction implemented in ATCOR2/3
(Richter 2011). The SRTM digital elevation model at 90 m
resolution was used for topographic correction (Jarvis et al.
2008). Satisfactory results were obtained for bands 3 (red),
4 (PIR), 5 (MIR), and 7 (MIR) only. Land cover maps were
created by applying a supervised classification using the
maximum likelihood method to the four corrected bands of
each image. The classifications were based on training sites
from a field campaign conducted in July 2010 and crosschecked with aerial photographs of 2002 (scale of
1:52 000). The air photos were published by the Center for
Survey and Mapping Information of the Department of
Survey and Mapping; and represent the latest and most
reliable source of data that could have been obtained for
classification purposes. Five land covers were defined: (1)
primary forest, (2) secondary or degraded forest, (3) rice,
(4) other crops, and (5) herbs, shrubs, or barren land. The
last class contains bare soils, and includes rock outcrops,
land set-aside or abandoned, and recently cleared forests.
Given some problems of class overlapping, ‘‘class biases’’
were assigned to give more weight to certain classes. The
accuracy of the classifications was assessed: (1) qualitatively by comparing land cover maps with field observations and topographic maps of 2009 published by the
Vietnam Publishing House of Natural Resources, Environment and Cartography, and (2) quantitatively with the
construction of an error matrix based on a pixel-based
comparison of the classified land cover map with visual
interpretation of satellite images and aerial photographs for
a random sample of 180 points.
Land cover maps were imported in the ArcGIS 9.3
software to add the delineation of the town of Sa Pa (as it
was in 2006) and major rivers extracted from the topographic maps. Then, differences were made for two pairs of
successive land cover maps and the land cover changes
were grouped into: (1) no change, (2) cultivation, (3)
Ó Royal Swedish Academy of Sciences 2012
www.kva.se/en
123
348
AMBIO 2013, 42:344–356
Table 1 Overview of the variables included in the statistical analyses
Unit
Abbreviation
Variables
Village
m
ALT
Average altitude
Location
m
DIST
Radial distance to the town of Sa Pa
Population
Inhabitants ha-1
POPDENS
Population density
ETHNIC
Main ethnic group
Agricultural activities
Ha/ha
PLUMS
Proportion of surface area occupied by plums
Ha/ha
AMOMUM
Proportion of surface area occupied by Amomum
100 kg ha-1
RICE
Rice production relative to the village area
100 kg ha-1
VEGETABLES
Vegetables production relative to the village area
100 kg ha-1
PIG
Pig production relative to the village area
FOWL
Fowl production relative to the village area
ELEC
TELE
Percentage of households with electricity
No. of television(s) per household
100 kg ha
Socio-economic conditions
Forest changes
-1
%
RADIO
No. of radio(s) per household
MOTO
No. of motorbikes(s) per household
Ha/ha
DEFO939
Proportion of surface area affected by deforestation (1993–1999)
Ha/ha
DEFO9906
Proportion of surface area affected by deforestation (1999–2006)
Ha/ha
DEGRA9399
Proportion of surface area affected by forest degradation (1993–1999)
Ha/ha
DEGRA9906
Proportion of surface area affected by forest degradation (1999–2006)
Ha/ha
REGE9399
Proportion of surface area affected by regeneration/plantation (1993–1999)
Ha/ha
REGE9906
Proportion of surface area affected by regeneration/plantation (1999–2006)
All variables are calculated at the village level
abandonment or set-aside, (4) error (transition from any
other class to primary forest), (5) deforestation, (6) forest
degradation, and (7) forest regeneration or tree plantation.
The last three categories related to forest change are of
particular interest, and the proportions of these changes
were later the object of the statistical analysis.
Household Data
Household data were derived from the Vietnam Rural,
Agricultural, and Fishery Census conducted in 2006 under
the leadership of the Department of Agriculture, Forestry
and Fishery Statistics and the General Statistics Office,
with the support of the World Bank. The household survey
contains very detailed information on population, ethnic
composition, agricultural production, and socio-economic
conditions of the 85 villages of Sa Pa District. Random
testing of the household data was not possible here, as there
was no external dataset available for testing and evaluation.
However, a randomized experiment by Glewwe and Hoang
Dang (2008) in Vietnam shows that the overall rate of
errors in the household surveys of 2002 and 2004 is low.
From the census and topographical data, a new dataset
of 14 variables was created at the village level comprising
2 variables related to population dynamics, 6 variables to
agricultural activities, 4 variables related to socio-economic status, and 2 variables related to the spatial location
123
of the villages (Table 1). A standard descriptive analysis
was first applied, and the variables were submitted to
Kolmogorov–Smirnov and Shapiro–Wilk tests to check
normality of distributions. Given the under-representation
of Tay, Day, and Kinh relative to Hmong and Dao ethnic
groups, the statistical analyses were focused on Hmong and
Dao populations that were compared based on the Welch t
test (for variables with normal distribution) or Mann–
Whitney–Wilcoxon test (for variables with unknown distribution) (Beguin 1979; Crawley 2005). A threshold of
5 % was chosen for all the statistical tests to reject or not
the null hypothesis.
To confront forest cover change with population, ethnic,
agricultural, and socio-economic data, six forest cover
change variables were added to the dataset (Table 1). A
Spearman Ranks correlation analysis was applied to the 19
quantitative variables (all but the main ethnic group). The
variables were then scaled to the unit variance to be subjected to a principal component analysis (PCA). This data
transformation technique allows the reduction of the set of
variables to a smaller, conceptually more coherent set of
principal components, which are linear combinations of the
original variables (Dunteman 1989). A hierarchical clustering of the 58 villages was done based on the PCA’s
results, by using the Ward’s method which aims to minimize the intra-class variance and maximize the inter-class
variance (Beguin 1979). All statistical operations were
Ó Royal Swedish Academy of Sciences 2012
www.kva.se/en
AMBIO 2013, 42:344–356
349
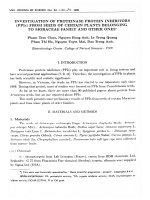
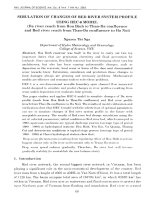
Fig. 2 Land cover transitions between a 1993 and 1999; and b 1999 and 2006
performed in R software. For more details on the methodological aspects of the statistical analyses, we refer to
Crawley (2005).
RESULTS
Land Cover Classification
The overall accuracy of the land cover classification was,
respectively, 71.1, 67.8, and 68.3 % (kappa values of 0.54,
0.55, and 0.54) for land cover maps of 1993, 1999, and
2006. Three main errors affect the classifications: (i) confusion between primary and secondary or degraded forest,
(ii) confusion between rice and other crops in cultivated
valleys, and (iii) confusion between the class ‘herbs,
shrubs, and barren land’ and other classes due to the variety
of land cover types and land units in this class. However,
the overall land cover is consistent with topographic maps
of 2009 and field observations. The land cover pattern is
strongly determined by local topography: Valleys are
generally cultivated, with rice grown on the flattest land
located close to the rivers and other crops on slopes further
away from water sources. Steeper slopes and mountain
peaks are predominantly barren lands or are covered by
forests, herbs, or shrubs. Primary forest is mainly present in
the Hoang Lien mountain range, where it covers large
areas, and on remote steep slopes. Secondary or degraded
forest appears in the form of smaller patches scattered
throughout the area, particularly at the boundary between
cropland and primary forest. Finally, herbs, shrubs, and
barren land are found in different places, as much in valleys as on peaks or on steep slopes. Moreover, this last
class is much more present on the maps of 1993 and 1999
than on the 2006 one.
Land Cover Changes
Differences made between pairs of successive land cover
maps allow the identification of land cover trends that are
consistent for the entire period 1993–2006 (Fig. 2). No
change mostly concerns primary forests in Hoang Lien
Mountains and very steep slopes; change in cropland is
concentrated in valleys bottoms and on gentle slopes,
Ó Royal Swedish Academy of Sciences 2012
www.kva.se/en
123
350
AMBIO 2013, 42:344–356
especially for 1999–2006; and forest cover change appears
as smaller parcels spread over the study area. The land
cover maps also indicate stronger land cover dynamics in
the period 1993–1999 compared to 1999–2006. Deforestation was higher in 1993–1999 (Fig. 2a), in the whole area
and the majority of villages, and was present throughout
the area while it was concentrated on the outskirts of fields
during 1999–2006 (Fig. 2b). Forest degradation was limited to small patches during the entire time period 1993–
2006. Even if the overall proportion of regeneration/plantation is somewhat larger during the second period, there is
not a significant tendency at the village level.
Villages’ and Populations’ Characteristics
In the study area, there are 34 Hmong villages, 20 Dao
villages, 2 Tay villages, 1 Day village, and 1 Kinh entity
(Sa Pa Town): Tay villages are clustered in the lower part
of the Muong valley (main valley crossing the study area
from the northwest to the southeast), Dao villages are
located at various altitudes in the northern and eastern most
parts of the area, Hmong villages are mainly found at
higher altitude with some concentration along the southern
part of the Muong valley. Kinh are clustered in Sa Pa town
Table 2 Results of comparison tests between the Hmong and Dao
populations for each variable
Variables
t/W statistic
ALTt
POPDENSt
-3.22**
-6.01***
AMOMUM
587.00***
PLUMS
442.00
RICE
536.00***
VEGETABLES
388.00
PIG
517.00**
FOWL
544.00***
ELEC
67.00***
TELEt
3.46**
RADIO
104.50***
MOTO
136.00***
DIST
84.00***
DEFO9399t
-1.17
DEFO9906
187.00**
DEGRA9399t
DEGRA9906
3.09**
141.00***
REGE9399
166.00**
REGE9906t
3.91***
The Welch t test was used for variables with normal distribution
(indicated with index t), while the Mann–Whitney–Wilcoxon test was
used for all the other variables. For more details on the statistical
techniques, we refer to Crawley (2005)
Significant at * 5 % level, ** 1 % level, *** 1 % level
123
and are present in minority in Hoang Lien village. The only
village with a majority of Day people is located along the
Muong valley.
Statistical tests revealed a significant difference between
Hmong and Dao villages for all the 13 quantitative variables, with the exception of two variables related to fruit
and vegetable production (Table 2). Hmong villages are
located at a significantly higher altitude and smaller distance from Sa Pa Town; and are more densely populated
than Dao villages. They are characterized by a greater
proportion of area occupied by Amomum and higher production of rice, pig, and fowl per unit surface area. On the
other hand, the percentage of households having electricity
and the numbers of TV, radio(s), or motorbike(s) per
household are significantly higher in Dao villages. Hmong
and Dao ethnic groups are also significantly different with
regard to forest dynamics (Table 2). Proportion of deforestation between 1999 and 2006, as well as proportions of
degradation and regeneration/plantation on the two periods
are significantly smaller in Hmong villages than in Dao
ones.
Multivariate Statistical Analysis: Hierarchical
Clustering of Principal Components
Six principle components were extracted from the dataset,
accounting together for 76 % of the total variance. Table 3
displays the percentage of total variance explained by the
different components, as well as correlation coefficients
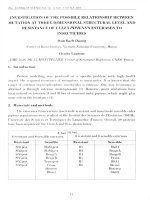
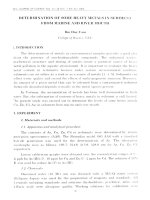
between these components and each variable. The correlations with the two first components, which together
account for nearly 50 % of the total variance of the dataset,
are illustrated in Fig. 3. The Ward’s hierarchical clustering
was made on basis of the six components selected in the
PCA. Three clusters were chosen based on the dendrogram.
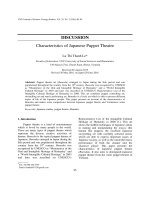
The results both of the PCA and of the clustering show a
pattern closely linked with the ethnicity (Fig. 4). In the first
vector space, there is a clear separation along the first
component between Hmong and Kinh on the one side, and
Dao, Tay, and Day people on the other side. Only six
villages are exceptions to this overall pattern: three Dao
villages located in the third quadrant and three Hmong
villages present in the fourth quadrant. The town of Sa Pa
as well as the Hmong village of Sau Chua appear as outliers. The separation is reinforced by the clustering, with
the formation of two distinct groups from both sides of the
first component, except for Lech Mong. It is interesting to
put Figs. 3 and 4 in parallel in order to link the position of
villages—belonging to different ethnic communities and
grouped within three clusters—in the individuals’ space
formed by the first two components with the correlations
between these components and the 19 quantitative
variables.
Ó Royal Swedish Academy of Sciences 2012
www.kva.se/en
AMBIO 2013, 42:344–356
351
Table 3 Percentage of total variance of the dataset explained by the principal components and saturation matrix
Components
% of variance explained
1
29.86
2
14.87
DEFO9399
-0.47***
0.11
DEFO9906
0.78***
0.11
DEGRA9399
DEGRA9906
0.73***
0.74***
-0.08
0.07
0.23
0.22
0.24
-0.05
REGE9399
0.83***
0.19
0.25
-0.11
-0.18
-0.15
-0.61***
REGE9906
0.53***
POPDENS
-0.46***
0.12
0.34**
-0.23
3
11.42
4
8.02
-0.30*
0.40**
-0.19
0.56***
ALT
-0.77***
PLUMS
-0.27*
0.72***
AMOMUM
-0.51***
0.04
0.61***
RICE
-0.28*
0.71***
6
5.75
0.32*
-0.49***
0.16
0.21
-0.08
0.01
0.31*
0.18
0.17
0.37**
-0.05
0.14
-0.48***
0.05
-0.07
0.35**
0.10
0.00
-0.37**
-0.22
5
6.37
-0.02
0.09
0.08
0.15
-0.08
0.25
-0.28*
0.09
-0.09
-0.23
-0.31*
VEGETABLES
-0.25
0.56***
0.02
PIG
-0.44***
0.63***
-0.002
FOWL
-0.42***
0.51***
0.37**
0.49***
-0.42***
0.11
0.13
0.40**
0.08
-0.11
0.42***
ELEC
0.44***
0.43***
-0.15
0.22
0.05
-0.19
TELE
0.26
0.53***
-0.45***
0.09
0.37**
-0.28*
RADIO
0.37**
0.21
MOTO
DIST
0.30*
0.80***
0.19
0.13
0.26
-0.57***
-0.21
0.70***
-0.17
-0.17
-0.15
0.31*
0.04
-0.25
-0.27*
0.06
Significant at * 5 % level, ** 1 % level, *** 1 % level
Fig. 3 Orientation of
quantitative variables in the
vector space formed by the first
two principal components
(DIM1 and DIM2). The first
component (DIM1) accounts for
29.86 % of the total variance of
the dataset, and the second
component (DIM2) for
14.87 %. The unit circle
represents the upper limit of the
variables’ coordinates. Its
representation on the graph
shows how each variable is
represented in the first principal
plan. The closer a variable to the
circle is, the better its
representation is in the plan
formed by these two first
components
The first cluster includes only Sa Pa Town and Sau Chua
(Fig. 4). Since many Kinh of the Sa Pa Town work in the
sectors of administration, education, or tourism, it may be
surprising that the town is associated with high proportion
of its area occupied by plum trees and high relative productions of rice, vegetable, pig, and fowl. However, this
entity extends well outside the city itself and includes
farmers who have better access than the ethnic minorities
Ó Royal Swedish Academy of Sciences 2012
www.kva.se/en
123
352
AMBIO 2013, 42:344–356
Fig. 4 Distribution (factor
scores) of villages in the
individuals’ space formed by
the first two principal
components (DIM1 and DIM2).
The symbols are colored
according to the main ethnic
group in the village. The
symbols refer to the three groups
that were recognized by the
statistical procedure
to information, to new and more profitable varieties of
crops and to the market of Sa Pa, where they can buy
various agricultural inputs and/or sell their produce. They
may thus obtain better yields and produce a lot on a small
agricultural area.
As Sa Pa Town, the Hmong village of Sau Chua is characterized by high relative productions of pig and fowl and
high proportion of its area occupied by plum trees, but also by
high proportion of Amomum and relatively high average
altitude and population density. This village has a quite small
area with a relatively high number of households and a large
proportion of forest, barren land, herbs, and shrubs (more
than 50 %). The abundance of herbs, shrubs, and barren land
may be due to clearing of forest by Hmong households for
growing cardamom in order to compensate for the small area
of arable land. Moreover, the relatively small area of cultivation compared to the population size may explain the high
relative productions of pig and fowl, which do not need
specific land, as well as the abundance of plum trees that
households may plant in their garden.
123
The second cluster consists of 34 villages; 31 Hmong
and three Dao (Fig. 4). Hmong villages appearing in the
first quadrant and belonging to this cluster are associated to
a high population density and a large proportion of their
area dedicated to the cultivation of Amomum like Sau
Chua, but also by high deforestation rates between 1993
and 1999. Some of them present a relatively large proportion of area occupied by plum trees and high relative
productions of rice, vegetable, pig, and fowl. Villages that
are located in the third quadrant are characterized by a high
average altitude, in addition to high deforestation rates,
high population density and a relative abundance of
Amomum.
The third cluster contains the 22 other villages of the
study area; 17 Dao villages, 2 Hmong villages, the Day
village, and the two Tay villages (Fig. 4). These villages
are associated with a large proportion of deforestation on
the second period and large proportions of forest degradation and of regeneration/plantation on the two transition
intervals. They are also relatively distant from Sa Pa Town
Ó Royal Swedish Academy of Sciences 2012
www.kva.se/en
AMBIO 2013, 42:344–356
353
and relatively well equipped in terms of electricity, televisions, radios, and motorbikes. Furthermore, villages
appearing in the fourth quadrant are characterized by a
particularly large proportion of regeneration/plantation
during 1999–2006.
DISCUSSION
The Vietnamese Forest Transition: What Is
Observed at Local Scale?
At national scale, a shift from a net deforestation to a net
reforestation occurred at the beginning of the 1990s
(Meyfroidt and Lambin 2008a). At the local scale, we do
not observe the forest transition, as the rate of regeneration
and/or plantation is smaller than the rate of deforestation
and forest degradation during the study period (Fig. 2).
However, the net loss in forest cover (i.e., taking into
account forest cover decrease and increase) is smaller in
1999–2006 compared to 1993–1999. There seems to be a
decrease in the clearing of large forested areas like those in
Hoang Lien Mountains after 1999, as deforestation is more
concentrated along cultivated lands. The rate of forest
degradation is approximately the same on the two intervals
probably because of a continuation of the collection of
forest products for consumption or sale, and/or slash and
burn on small parcels despite its ban by the State in 1992
(Michaud and Turner 2000). Large campaigns of reforestation were launched in the early 1990s, but it seems that
they have not been sufficient to initiate the shift to a net
reforestation. The pattern of forest cover change differs
significantly between ethnic groups: statistical tests show
that Hmong villages are generally associated with lower
rates of forest cover change than Dao villages (Table 2).
Our data therefore suggest that the Dao villages use forest
resources more intensively.
Is Rural Poverty Driving Deforestation?
The percentage of households having electricity is a good
indicator of the average socio-economic conditions of villages. Access to electricity is not only dependent on the
socio-economic position of individual households, but
highly depends on the organization of the village. Households that are settled in an area with a power distribution
network set up by the community have a clear advantage
compared to others located in remote areas without established electricity network. Access to electricity will therefore be higher in villages where the community has paid for
the set-up of a distribution network or where households
have invested in generators. Our analyses show that lowest
percentages of access to electricity are found in Hmong
villages while all households of Sa Pa Town have electricity, as well as more than 70 % of households in Tay or
Day villages. Kinh, Dao, Tay, and Day villages also seem
to be better equipped in terms of televisions, radios, and
motorbikes than Hmong villages. Not surprising, the
numbers of radio(s) and television(s) per household are
strongly correlated with the availability of electricity. Dao
villages located at the northernmost and easternmost parts
of the area would yet not be connected to the national grid,
but most households have generators.
The results of our statistical analyses confirm earlier
statements from the Frontier Vietnam report (1999) that the
Hmong are the most socio-economically disadvantaged of
all the ethnic minorities living in the study area. Statistical
analyses of the socio-economic data show that they have
poorer socio-economic status than the other ethnic groups
in the study area. Hmong villages are much less equipped
in terms of electricity, TV, radio(s), and motorbike(s) than
Dao villages, even if they are located at a significantly
shorter distance from Sa Pa Town where living conditions
of the Kinh are much higher (Table 2). These results are
consistent with the study conducted by UNFPA on national
data from the 2009 Vietnam Population and Housing
Census (UNFPA 2011). Based on information on housing,
living conditions, and household amenities, the UNFPA
used principle component analysis to obtain an indirect
indicator of the household socio-economic status. Their
results show that the Kinh ethnic group has the best socioeconomic conditions while the Hmong experience the
lowest socio-economic conditions among the 6 ethnic
groups that were included in their study. According to
Frontier Vietnam (1999), the Hmong communities of the
Lao Cai Province are characterized by the lowest literacy
rates and shortest life expectancy compared to the other
ethnic groups, as it is also the case at the national level
(UNFPA 2011). Using wood to build the bulk of their
houses, for heating, cooking or drying the cardamom,
which they furthermore grow in forests, the Hmong are
also reported to consume a lot of wood compared to other
ethnic communities (Frontier Vietnam 1999). For example,
while the houses of all ethnic communities have timber
frames, a much larger proportion of Hmong houses has
wooden roofs and wall materials compared to Dao, Day, or
Tay houses. In addition, during the winter months, many
Hmong households harvest various forest products for food
or to sell on the Sa Pa market. And some of them go into
the forest to make charcoal.
However, our results contradict the hypothesis that the
poorest rural communities are associated with the highest
rates of deforestation and forest degradation. The results
suggest that Hmong villages that have been forest-dependent for many years have learned to manage them in a
more or less sustainable way. The small-scale activities
Ó Royal Swedish Academy of Sciences 2012
www.kva.se/en
123
354
AMBIO 2013, 42:344–356
that they have in or around the forests seem not to have a
major impact on deforestation rates. Furthermore, the
Hmong usually lack of means to deforest large areas, as
they lack of arable land and of contacts with the authorities
to participate in large reforestation or plantation
campaigns.
Is There a Trade-Off Between Agricultural
Activities and Deforestation?
The case of Sa Pa Town aside, the results demonstrate that
villages associated with the largest dynamics of forest
cover on the time intervals of 1993–1999 and 1999–2006
are those with the best socio-economic conditions in 2006
(Table 3, Fig. 3). At the opposite, villages with the smallest
forest cover dynamics are those presenting the highest
proportions of area dedicated to farming and the largest
agricultural production relative to their area in 2006. Furthermore, these two associations seem to be closely related
to the ethnicity of the villages in the study area (Fig. 4).
Agricultural activities are important in the densely
populated rural areas, as shown by significantly positive
correlations between five of the six variables related to
agricultural activity and population density. Sa Pa Town is
an exception as it is not densely populated but has a great
proportion of its area occupied by plum trees, as well as
great productions of rice, vegetables, pig and fowl relative
to its area. The greater proportion of area occupied by
Amomum and the higher relative productions of rice, pig,
and fowl characterizing the Hmong villages must be linked
to their higher population density, at least compared to Dao
villages, rather than to a potential higher agricultural productivity (Table 2). Hmong households are still using traditional practices while other ethnic communities are
generally more able to buy fertilizers on the market of Sa
Pa Town and cultivate new varieties of crops that are more
productive (Frontier Vietnam 1999). Concerning plants of
the Amomum genus, it is mainly cardamom that households
cultivate under the forest canopy after having roughly
cleared the ground vegetation and cut around 40 % of the
trees (Frontier Vietnam 1999; Tugault-Lafleur 2007).
Cardamom is also more frequently grown by Hmong
people than by other communities because they are particularly susceptible to the exhaustion of their harvest and
need money to buy food during the months of hunger. In
such situation, cash crop cultivation is recommendable
because it can generate the same income on a smaller land
area compared to growing food crops (Hamilton and
Bensted-Smith 1989).
Furthermore, population density seems more related to
the size of the village than to the number of households.
The highest densities are found in Hmong villages because
this ethnic group inhabits the smallest villages. This may
123
be due to its settlement in the highest and more remote
regions, where the village extension is limited both by
topography and vegetation. The migration history may
actually explain the spatial repartition of the different
ethnic groups in the area. Dao and Hmong communities
have immigrated to northern Vietnam relatively late (in
the eighteenth and nineteenth century, respectively), and
fertile valleys were already occupied by other ethnic
groups (Tugault-Lafleur 2007). They had to settle at
higher altitude, often on forested slopes. This is particularly the case of Hmong communities inhabiting the study
area.
Figure 4 shows that the Hmong are more active in
agriculture than the Dao. The densely populated Hmong
village practice agriculture at higher altitude, and close to
forested areas. According to the above-stated hypothesis on
the trade-offs between agriculture and deforestation, one
could expect higher deforestation and forest degradation in
Hmong villages compared to Dao ones. Yet, the results
show the opposite trend. The Hmong have practiced both
rice farming and shifting and/or rotational agriculture
together as an integrated system of subsistence for generations. This phenomenon has also been described for rural
Tay village in Ban Tat by Fox et al. (2000). As paddy
production can be intensified as population grows, this
combination of paddy fields with swiddens may relieve
some pressure on the forested land. The Hmong villages of
Sa Pa district have been in the same location for several
hundred years (Michaud and Turner 2000), and their
extensive array of terraced wet rice has not undergone great
expansion in recent decades. The cultivation of cardamom
under the forest canopy seems not to represent a major
threat to the forest as it is not practiced extensively. Unlike
the well-documented case of the East Usambara Mountains, Northeastern Tanzania, where plots are cleared
completely and converted to annual crops once the cardamom cultivation becomes unprofitable (Reyes et al. 2006),
the forest is able to quickly recover its natural state in the
study area as the tree canopy is left relatively intact by the
local households (Frontier Vietnam 1999). Furthermore,
there are nowadays new ways for Hmong households to
diversify their economic activities and get additional
income. Beside the cultivation of cash crops, the current
development of tourism in the area of Sa Pa Town offers a
number of new opportunities to minorities’ households
(Michaud and Turner 2000). Many Hmong women go
regularly to Sa Pa town to sell handicrafts to tourists. Some
young people from ethnic minorities are hired by hotels or
agencies of the town as trekking guide. Households who
are able to offer minimal comfort in villages surrounding
Sa Pa Town also provide bed and board for trekkers. All
these activities allow a loosening of the pressure on forest
resources.
Ó Royal Swedish Academy of Sciences 2012
www.kva.se/en
AMBIO 2013, 42:344–356
355
CONCLUSION
Our data on forest cover change (1993–2006) show that
deforestation rates are decreasing, but that forest degradation
continues at similar rates. In the Sa Pa district, there was no
transition from a net deforestation to net reforestation, as it
was observed at the national scale. Spatial analyses of forest
cover dynamics in relation to demographic and socio-economic variables allowed us to identify the mechanisms
behind the observed forest cover changes. Our data show that
high rates of deforestation are not necessarily associated with
impoverished ethnic communities or high levels of subsistence farming. On the contrary, the largest forest cover
dynamics are found in villages with the best socio-economic
conditions. Interestingly, the statistical analyses show that
Hmong villages are characterized by significantly lower
deforestation rates, despite their high population densities,
poor socio-economic conditions, and high implications in
agricultural production. A multiplicity of explanatory factors
can influence the relationships between humans and their
environment. Our results show that the outcomes of national
or regional studies have to be confronted with studies on
local-scale forest dynamics to better understand the complexity of the human–nature relationship.
Acknowledgments This research was part of the bilateral scientific
project on ‘Land-use change under impact of socio-economic development and its implications on environmental services in Vietnam’
funded by the Belgian Science Policy (Grant SPP PS BL/00/V26) and
the Vietnamese Ministry of Science and Technology (MOST). We
thank Eric Lambin, Nguyen Hieu, Patrick Meyfroidt and Kim Chi Vu
for their very useful suggestions.
REFERENCES
Angelsen, A. 1999. Agricultural expansion and deforestation: Modeling the impact of population, market forces and property rights.
Journal of Development Economics 58: 185–218.
Bahadur, K.C. 2011. Linking physical, economic and institutional
constraints of land use change and forest conservation in the hills
of Nepal. Forest Policy Economics 13: 603–613.
Barbier, E.B., and J.C. Burgess. 2001. The economics of tropical
deforestation. Journal of Economics Surveys 15: 413–433.
Beguin, H. 1979. Quantitative methods of geographic analysis. Paris:
LITEC (in French).
Castella, J.-C., T.N. Trung, and S. Boissau. 2005. Participatory
simulation of land-use changes in the Northern Mountains of
Vietnam: The combined use of an agent-based model, a roleplaying game, and a geographic information system. Ecology
and Society 10: 27.
Coulibaly-Lingani, P., T. Mulualem, P. Savadogo, P.-C. Oden, and
J.-M. Ouadba. 2009. Determinants of access to forest products in
southern Burkina Faso. Forest Policy and Economics 11: 516–524.
Crawley, M.J. 2005. Statistics: An introduction using R. West Sussex:
Wiley.
Delang, C.O. 2002. Deforestation in Northern Thailand: The result of
Hmong Farming Practices or Thai development strategies? Society
& Natural Resources: An International Journal 15: 483–501.
Dunteman, G.H. 1989. Principal components analysis. California:
SAGE Publications.
Environmental Investigation Agency (EIA), and Telapak. 2008.
Borderlines: Vietnam’s booming furniture industry and timber
smuggling in the Mekong region. London: EIA–Telapak, 24 pp.
Fox, J., D.M. Truong, A.T. Rambo, N.P. Tuyen, L.T. Cuc, and S.
Leisz. 2000. Shifting cultivation: A new old paradigm for
managing tropical forests. BioScience 50: 521–528.
Frontier Vietnam. 1997. Biodiversity value of Hoang Lien Mountains
and strategies for conservation. In Proceedings of Seminar and
Workshop 7–9th, ed. R. Sobey. Frontier Vietnam Environmental
Research, Report 13, Hanoi, Vietnam, 27 pp.
Frontier Vietnam. 1999. Hoang Lien nature reserve—conservation
evaluation 1997/98, ed. A. Tordoff, S. Swan, M. Grindlry, and
H. Siurua. Frontier Vietnam Environmental Research, Report 17,
Hanoi, Vietnam, 107 pp.
Geist, H.J., and E.F. Lambin. 2001. What drives tropical deforestation? A meta-analysis of proximate and underlying causes of
deforestation based on subnational case study evidence. LandUse and Land-Cover Change (LUCC) International Project
Office, LUCC Report Series No. 4, University of Louvain,
Louvain-la-Neuve, Belgium, 136 pp.
Gibbs, H.K., A.S. Ruesch, F. Achard, M.K. Clayton, P. Holmgren, N.
Ramankutty, and J.A. Foley. 2010. Tropical forests were the
primary sources of new agricultural land in the 1980s and 1990s.
Proceedings of the National academy of Sciences of the United
States of America 107: 16732–16737.
Glewwe, P., and H.-A. Hoang Dang. 2008. The impact of decentralized data entry on the quality of household survey data in
developing countries: Evidence from a randomized experiment
in Vietnam. The World Bank Economic Review 22: 165–185.
Global Witness. 1999. Made in Vietnam—Cut in Cambodia: How the
garden furniture trade is destroying rainforests. Retrieved 31
May, 2012, from />tnam-cut-cambodia.
Hamilton, A.C., and R. Bensted-Smith (ed.). 1989. Forest conservation in the East Usambara Mountains, Tanzania. Gland,
Switzerland: IUCN, 392 pp.
IUCN. 2010. Buddha’s Footprint—Central Highlands of Sri Lanka
World Heritage Site. Retrieved 31 May, 2012, from
/>programmes/pa/pa_paday/?5876/Buddhas-Footprint.
Jarvis, A., H.I. Reuter, A. Nelson, and E. Guevara. 2008. International
Centre for Tropical Agriculture (CIAT). Hole-filled seamless
SRTM data V4. Retrieved 2 January, 2011, from .
cgiar.org.
Lambin, E.F., H.J. Geist, and E. Lepers. 2003. Dynamics of land-use
and land-cover change in tropical regions. Annual Review of
Environment and Resources 28: 205–241.
Mather, A.S. 1992. The forest transition. Area 24: 367–379.
Meyfroidt, P., and E.F. Lambin. 2008a. Forest transition in Vietnam and
its environmental impacts. Global Change Biology 14: 1319–1336.
Meyfroidt, P., and E.F. Lambin. 2008b. The causes of the reforestation in Vietnam. Land Use Policy 25: 182–197.
Meyfroidt, P., and E.F. Lambin. 2009. Forest transition in Vietnam
and displacement of deforestation abroad. Proceedings of the
National Academy of Sciences of the United States of America
106: 16139–16144.
Michaud, J., and S. Turner. 2000. The Sa Pa marketplace, Lao Cai
Province, Vietnam. Asia Pacific Viewpoint 41: 85–100.
Reyes, T., O. Luukkanen, and Q. Roberto. 2006. Small cardamom—
Precious for people, harmful for mountain forests. Mountain
Research and Development 26: 131–137.
Richter, R. 2011. Atmospheric/Topographic Correction for Satellite
Imagery—ATCOR-2/3 User Guide, Version 8.0. Switzerland:
ReSe Applications Schla¨pfer.
Ó Royal Swedish Academy of Sciences 2012
www.kva.se/en
123
356
AMBIO 2013, 42:344–356
Saint-Macary, C., A. Keil, M. Zeller, F. Heidhues, and P.T.M. Dung.
2010. Land tilting policy and soil conservation in the Northern
Uplands of Vietnam. Land Use Policy 27: 617–627.
Shortle, J.S., and D.G. Abler. 1999. Agriculture and the environment.
In Handbook of environmental and resource economics, ed. J.C.
van den Bergh, 159–176. Cheltenham: Edward Elgar.
Tugault-Lafleur, C. 2007. Diversifying livelihoods: Hmong use and
trade of forest products in Northern Vietnam. PhD Thesis.
McGill University, Montreal.
Tugault-Lafleur, C., and S. Turner. 2009. The price of spice: Ethnic
minority livelihoods and cardamom commodity chains in upland
northern Vietnam. Singapore Journal of Tropical Geography 30:
388–403.
United Nations Population Fund (UNFPA). 2011. Ethnic Groups in
Vietnam: An analysis of key indicators from the 2009 Viet Nam
Population and Housing Census. UNFPA, Ha Noi, Vietnam, 33 pp.
Van Lanh, L. 2004. Hoang Lien National Park. Hanoi: National
Culture Publishing House.
Vanacker, V., G. Govers, S. Barros, J. Poesen, and J. Deckers. 2003.
The effect of short-term socio-economic and demographic
change on landuse dynamics and its corresponding geomorphic
response with relation to water erosion in a tropical mountainous
catchment, Ecuador. Landscape Ecology 18: 1–15.
Vu, K.C., A. Van Rompaey, G. Govers, V. Vanacker, and N. Hieu.
2012. An integrated analysis of biophysical and socio-cultural
controlling factors of land-use transitions in NW-Vietnam.
Human Ecology (in review).
are human–nature interactions, the influence of policies and socioeconomic conditions on land-use change patterns, and the concept of
leakage in relation with tropical deforestation.
Address: Earth and Life Institute, Georges Lemaıˆtre Centre for Earth
and Climate Research, Universite´ Catholique de Louvain, Place Louis
Pasteur 3, Bte L4.0308, 1348 Louvain-la-Neuve, Belgium.
e-mail:
Veerle Vanacker is Assistant Professor at the School of Geography
in the University of Louvain-la-Neuve. Her research focuses on
human impact on mountainous environments, and more particularly
on quantifying the human impact on earth surface processes.
Address: Earth and Life Institute, Georges Lemaıˆtre Centre for Earth
and Climate Research, Universite´ Catholique de Louvain, Place Louis
Pasteur 3, Bte L4.0308, 1348 Louvain-la-Neuve, Belgium.
e-mail:
Huong Thi Thu Hoang is Master of Economic-Political Geography
and working in Hanoi University of Sciences, VNU as a lecturer. She
is a PhD candidate in the Earth and Life Institute of the University of
Louvain-la-Neuve. Her main interest is the impact of social-economic
development on land-use change in mountainous regions.
Address: Faculty of Geography, Hanoi University of Sciences, Vietnam National University (VNU), No. 334 Nguyen Trai Street, Thanh
Xuan District, Hanoi, Vietnam.
e-mail:
AUTHOR BIOGRAPHIES
Isaline Jadin (&) is Master of Geographical Sciences, is a recent
graduate of the Louvain-la-Neuve University and a PhD candidate in
the Earth and Life Institute of the same University. Her main interests
123
Ó Royal Swedish Academy of Sciences 2012
www.kva.se/en