DSpace at VNU: Influence of Surface Treatment and Annealing Temperature on the Recombination Processes of the Quantum Dots Solar Cells
Bạn đang xem bản rút gọn của tài liệu. Xem và tải ngay bản đầy đủ của tài liệu tại đây (2.63 MB, 10 trang )
Hindawi Publishing Corporation
Journal of Nanomaterials
Volume 2016, Article ID 9806386, 9 pages
/>
Research Article
Influence of Surface Treatment and Annealing Temperature on
the Recombination Processes of the Quantum Dots Solar Cells
Tung Ha Thanh,1,2 Vinh Lam Quang,3 and Huynh Thanh Dat4
1
Department for Management of Science and Technology Development, Ton Duc Thang University, Ho Chi Minh City, Vietnam
Faculty of Applied Sciences, Ton Duc Thang University, Ho Chi Minh City, Vietnam
3
University of Science, Vietnam National University, Ho Chi Minh City, Vietnam
4
Vietnam National University, Ho Chi Minh City, Vietnam
2
Correspondence should be addressed to Tung Ha Thanh;
Received 12 June 2016; Revised 31 August 2016; Accepted 4 September 2016
Academic Editor: Taeseup Song
Copyright © 2016 Tung Ha Thanh et al. This is an open access article distributed under the Creative Commons Attribution License,
which permits unrestricted use, distribution, and reproduction in any medium, provided the original work is properly cited.
We have studied the effect of the surface treatment of the CdS/CdSe quantum dots (QDs) by passivation ZnS layers and
annealing temperature on the recombination resistance of the quantum dots solar cells (QDSSCs) based on TiO2 /CdS/CdSe/ZnS
photoanodes. The recombination resistance at TiO2 /QDs contact and in TiO2 film decreased when the QDs were added to the
passivation ZnS layers. Furthermore, we used the F− ions linker and found the best annealing temperature conditions to reduce the
recombination resistance of the QDSSCs. As a result, the current density increased from 7.85 mA/cm2 to 14 mA/cm2 .
1. Introduction
Recently, the scientists in the world have been interested in
the QDSSCs based on the TiO2 substrate. The QDSSCs based
on the QDs have more advantages than the dye sensitized
solar cells (DSSCs) based on the molecules for some reasons:
(1) the molecules only absorb the light in visible region (2) and
are unstable in the air environment. Beside the disadvantages
of the molecules, the QDs have some advantages such as
quantum confinement effect, the higher coefficients than
the dyes, and the generation of multiple electron-hole pairs
by a single incident photon [1, 2]. Moreover, the tunable
adsorption band of the QDs can be performed by changing
their size for the light harvesters in QDSSCs [3].
For those reasons, the QDSSCs were promised to become
the candidate for the high efficiency. Firstly, Vogel and
colleagues prepared the QDSSCs based on CdS QDs and
obtained the low efficiency [4]. In 2008, many scientists only
studied the single QDs as CdS, CdSe, PbS, and so on for the
application in the QDSSCs. Therefore, the results obtained
the low efficiency. For the next years, the series articles focus
on improving efficiency of the QDSSCs with the subject to
improve the adsorption of the photoanodes [5, 6]; to use the
different methods such as chemical bath deposition (CBD),
successive ionic layer adsorption, and reaction (SILAR) [7];
and to apply the core-shell QDs to reduce the surface states
in the QDs [8]. However, the efficiency of the QDSSCs was
still lower than the efficiency of the DSSCs at the present due
to the high surface states at the TiO2 /QDs contact and the
large diffusion resistance in the TiO2 film.
In this article, we studied the influence of the surface
treatment processes by the passivation ZnS coating and the
annealing temperature on the recombination resistance of the
QDSSCs based on the TiO2 /CdS/CdSe/ZnS photoanodes.
2. Experiments
2.1. CdSe QDs Synthesis. The CdSe QDs were prepared using
colloidal synthesis as detailed by previous work [9].
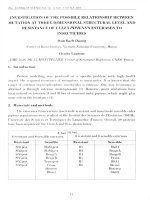
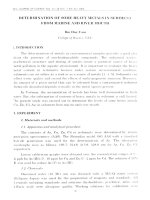
2.2. Growth of TiO2 /CdS/CdSe/ZnS Photoanodes. FTO (Figure 1) was coated with TiO2 films by doctor blade method
and annealed at 500∘ C for 45 minutes. Next, the film was
immersed in 40 mmol TiCl4 solution for 30 minutes at 70∘ C
and sintered at 300∘ C for 15 minutes, 400∘ C for 15 minutes,
450∘ C for 15 minutes, and 500∘ C for 30 minutes to avoid the
breaking films.
2
Journal of Nanomaterials
(b)
(a)
(c)
(d)
FTO
Silk-screen
printing
SILAR and CBD
Vacuum, 300 ∘ C
500 ∘ C
FTO/TiO2
FTO/TiO2 /QDs
Figure 1: Schematic of the structural photoanode.
Firstly, the FTO/TiO2 films were immersed into 0.5 M
Cd2+ -ethanol solutions and 0.5 M S− -methanol for 1 minute.
After, film was rinsed with methanol and ethanol before
being dried in air (a SILAR cycle). The immersion cycle
was repeated three times for CdS layers. Secondly, the
TiO2 /CdS assembly was immersed into the CdSe solution
(size ∼3-4 nm) for 24 hours before being dried at room
temperature. Thirdly, the TiO2 /CdS/CdSe film was immersed
into 0.1 M Zn2+ and 0.1 M S2− -solutions for 1 minute and
rinsed with pure water (a SILAR cycle). The immersion
cycle was repeated two times for ZnS layers. Finally, the
TiO2 /CdS/CdSe/ZnS photoanodes were annealed in vacuum
at 300∘ C to prevent oxidation.
The coating of F− ions was performed by dipping the TiO2
photoelectrode into a 1 M NH4 F aqueous solution for 5 min,
rinsed by deionized water 1 min. Two layers of F− ions were
coated: the first was coated before the deposition of CdS QDs,
the second after the deposition of CdS QDs, and the third
after the deposition of CdSe QDs [10].
2.3. Electrolyte Solution. The electrolyte was prepared by the
mix of 0.5 M Na2 S, 0.2 M S, and 0.2 M KCl solutions in MilliQ ultrapure water/methanol (7 : 3 by volume) [9].
2.4. Characterization. The morphological samples were in–
vestigated using the transmission electron microscopy
(TEM). The crystal structure was analyzed using an X-ray
diffractometer (XRD) (Philips, PANalytical X’Pert, CuK𝛼
radiation). The absorption properties of the samples were
investigated using a diffusive reflectance UV-Vis spectrometer (JASCO V-670). Photocurrent-voltage measurement was
from Solarena, Sweden, which has performed on a Keithley
2400 source meter using a simulated AM 1.5 sunlight
with an output power of 100 mW/cm2 produced by a solar
simulator. The Electrochemical Impedance Spectroscopy
(EIS) was carried out on ZAHNER IM6e Electrochemical
Workstations over a frequency range 0.1–105 Hz at zero bias
voltage.
3. Results and Discussions
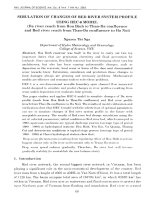
3.1. Morphological and Structure Analysis of the TiO2 /CdS/
CdSe/ZnS Photoanodes. To obtain the particles size, the TEM
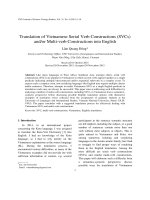
image of the TiO2 /CdS/CdSe/ZnS photoanode was investigated. Figure 2(a) presents the TEM image of the TiO2 /CdS/
CdSe/ZnS photoanode annealed at 300∘ C in vacuum with
the 5 nm size of the QDs. The structure of the photoanodes
can be studied by the Raman in Figure 2(b). It indicates
that the photoanode has the crystalline structure of Anatase
phase with the modes at 144 cm−1 , 397 cm−1 , 517 cm−1 , and
638.5 cm−1 [11]. Moreover, the Raman also have the 1LO (long
optic) and 2LO modes of the CdSe QDs at 206,5 cm−1 , and
405 cm−1 ; LO mode of the CdS QDs at 298 cm−1 ; and LO
mode of the passivation ZnS layers at 364 cm−1 [12]. These
results show that the CdS, CdSe, and ZnS particles were
deposited on the TiO2 film.
Beside the Raman, the structural TiO2 /CdS/CdSe/ZnS
photoanodes are also considered by the XRD patterns. Figure 2(c) indicates that the TiO2 films have the crystalline
structure of the Anatase phase (JCPDS 21-1272) with the
strong peak at 25,4∘ corresponding to the (101) plane. This
result indicates that the growth of the TiO2 film follows the
crystal axis [13]. In addition, the XRD patterns also showed
that the three peaks at 26,4∘ , 44∘ , and 56,1∘ correspond to
(111), (220), and (311) planes of the CdS, CdSe, and ZnS cubic
(JCPDS 41-1049, JCPDS 65-2891, and JCPDS 05-0566) [14–
16].
Journal of Nanomaterials
3
(a)
×102
×102
16
Eg
14
Eg
636 cm−1
100
395 cm−1
B1g , 2LO
A 1g , 515 cm−1
201 cm−1
Eg , LO
−1
251 cm−1 298 cm
1LO LO
(111)
12
Intensity (a.u)
Intensity (a.u)
143 cm−1
50
TiO2 (110)
TiO2 (004)
TiO2 (200)
(220)
10
(311) TiO2 (211)
8
6
4
2
200
400
Raman shift (cm−1 )
TiO2 /CdS/CdSe/ZnS
TiO2 -Anatase
CdS
600
CdSe
ZnS
(b)
30
40
2 (degree)
50
60
TiO2 /CdS
TiO2 /CdSe
TiO2 /CdS/CdSe/ZnS
(c)
Figure 2: (a) The TEM image, (b) Raman spectra, and (c) XRD patterns of the different photoanodes annealed in vacuum.
3.2. Influence of the Surface Treatment. The combination of
the two types QDs can increase the intensity of the absorption
of the photoanodes to improve the high performance of the
QDSSCs [5, 17, 18]. However, the efficiency of the QDSSCs
is still lower than the efficiency of the DSSCs due to the
high recombination processes at TiO2 /QDs contact and the
diffusion into the TiO2 film. Therefore, the ZnS passivation
layers were coated on the surface of the CdS/CdSe QDs to
reduce the recombination processes and the black electrons
into the electrolyte.
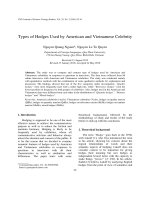
Figure 3(a) is the UV-Vis of the different photoanodes
to depend on the ZnS passivation layers. As expected, when
thickness of the ZnS passivation increased, the intensity of
the UV-Vis also increased due to the more ZnS particles
loading on the photoanodes [19]. This result is good for the
investigation to the influence of the ZnS passivation thickness
on the recombination resistance of the QDSSCs.
To determine the effect of the ZnS thickness on the
recombination resistance of the QDSSCs, we considered
the I-V curves of the QDSSCs based on the different
photoanodes. Figure 3(b) shows the I-V curves of the
QDSSCs with or without the ZnS passivation coating (an
active area 0.38 cm2 ) at AM 1.5 (100 mW/cm2 ). In this
work, the thickness of the ZnS layers changed from 0
to 5 layers as shown in Table 1. The QDSSCs based
on the TiO2 /CdS/CdSe/ZnS (2 layers) photoanodes have
the open voltage (𝑉OC ) ∼ 0.44 V, the current density
(𝐽SC ) ∼ 14 mA/cm2 , the fill factor ∼0.41, and the efficiency
4
Journal of Nanomaterials
14
0.6
12
Photocurrent density (mA/cm2 )
0.7
Intensity (a.u)
0.5
0.4
0.3
632 nm
415 nm
0.2
0.1
217 nm
0.0
10
8
6
4
2
0
400
500
600
700
0.1
0.0
800
Wavelength (nm)
TiO2 /QDs without ZnS
TiO2 /QDs/ZnS (1 layer)
TiO2 /QDs/ZnS (2 layers)
0.2
0.3
Voltage (V)
TiO2 /QDs without ZnS
TiO2 /QDs/ZnS (1 layer)
TiO2 /QDs/ZnS (2 layers)
TiO2 /QDs/ZnS (3 layers)
TiO2 /QDs/ZnS (4 layers)
TiO2 /QDs/ZnS (5 layers)
(a)
0.4
TiO2 /QDs/ZnS (3 layers)
TiO2 /QDs/ZnS (4 layers)
TiO2 /QDs/ZnS (5 layers)
(b)
Figure 3: (a) The UV-Vis spectra and (b) I-V curves of the QDSSCs with the different photoanodes.
100
Z (Ohm)
150
50
FTO
ZnS layer
2−
S2− /Sn (2)
0
20
40
60
Z (Ohm)
TiO2 /QDs without ZnS
TiO2 /QDs/ZnS (1 layer)
TiO2 /QDs/ZnS (2 layers)
80
100
e−
e−
QDs
(1)
+
TiO2
TiO2 /QDs/ZnS (3 layers)
TiO2 /QDs/ZnS (4 layers)
TiO2 /QDs/ZnS (5 layers)
(a)
(b)
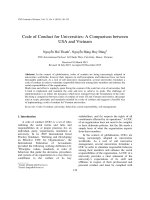
Figure 4: (a) Nyquist plots measured under illuminated conditions for the QDSSCs with the different photoanodes and (b) diagram of the
recombination routes for photoelectrons.
(𝜂) ∼ 2.1%. This result indicates that the efficiency of the
QDSSCs based on the photoanodes with the ZnS passivation
coating is higher than the efficiency of the QDSSCs based on
the photoanodes without the ZnS passivation coating. This
result agrees well with the UV-Vis spectra. To explain the
reasons why the current density increased from 6.04 mA/cm2
to 14 mA/cm2 , we used the diagram of the recombination
routes for photoelectrons in Figure 4(b). The QDSSCs based
on the photoanodes without the ZnS passivation layers can
occur in the high recombination processes between the
photoelectrons in the conduction band (CB) of the TiO2
with the holes in the valence band (VB) of the CdS/CdSe
QDs (process 1) and the holes in the electrolyte (process 2:
the back photoelectrons into electrolyte). When the CdS/CdSe
QDs were coated with the ZnS passivation layers, the QDSSCs
can be reduced in the recombination processes (1) and (2) in
Journal of Nanomaterials
5
Table 1: Photovoltaic performance parameters of the QDSSCs.
Number
1
2
3
4
5
6
QDSSCs
𝐽SC
(mA/cm2 )
𝑉OC
(V)
Fill factor
FF
Efficiency
𝜂 (%)
TiO2 /CdS/CdSe without ZnS
TiO2 /CdS/CdSe/ZnS (1 layer)
TiO2 /CdS/CdSe/ZnS (2 layers)
TiO2 /CdS/CdSe/ZnS (3 layers)
TiO2 /CdS/CdSe/ZnS (4 layers)
TiO2 /CdS/CdSe/ZnS (5 layers)
6.04
7.03
14
7.85
6.8
5.53
0.35
0.39
0.44
0.48
0.488
0.475
0.255
0.26
0.33
0.36
0.29
0.27
0.54
0.72
2.1
1.38
1.2
1.0
Table 2: The values of parameters were obtained from the EIS measurements.
Number
1
2
3
4
5
6
QDSSCs
𝑅S
(Ω)
𝑅ct2
(Ω)
𝑅ct1
(Ω)
𝜏
(ms)
𝐶𝜇
(𝜇F)
TiO2 /CdS/CdSe without ZnS
TiO2 /CdS/CdSe/ZnS (1 layer)
TiO2 /CdS/CdSe/ZnS (2 layers)
TiO2 /CdS/CdSe/ZnS (3 layers)
TiO2 /CdS/CdSe/ZnS (4 layers)
TiO2 /CdS/CdSe/ZnS (5 layers)
67
33.8
9.24
35.4
22.6
26
1190
333
41.6
1930
976
59000
268
158
13.5
2330
12000
16100
4.9
3.2
2.13
1.6
1.9
2.2
104
428
1040
35.4
28.5
46.4
Figure 4(b) [20]. The results show that the current density
and the efficiency of the QDSSCs increased. Moreover, the
optimal thickness of the photoanode with the ZnS layers is
2 layers. The efficiency of the QDSSCs decreased when the
thickness of the ZnS passivation layers increased due to the
high recombination processes when the ZnS particles were
more loading on the photoanodes [19].
The EIS using for the QDSSCs was found by Mora-Sero
group [21]. The EIS were used for investigation of the transfer
processes of photoelectrons through the contacts and diffusion into the TiO2 film such as pumping the photoelectrons
from the CdS, CdSe QDs to the CB of the TiO2 ; diffusion
of the photoelectrons in the TiO2 film; and recombination
of the photoelectrons with electrolyte. All processes were
described by the circuit diagrams obtained from the Fit and
Simulator software of the EIS. After obtaining the EIS, the
Nyquist of the circuit diagrams was fitted with the Nyquist
of the experiment. At first, we chose the circuit diagrams in
the Fit and Simulator software such as resistance, capacitance,
and phase element to sign the circuit diagrams. After fitting,
we can determine the parameters such as 𝑅S , 𝑅ct1 , 𝑅ct2 in
Table 2. The QDSSCs were illuminated by the Simulator with
the power 150 W, at 1000 W/m2 .
Figure 4(a) shows the EIS of the QDSSCs based on the
TiO2 /CdS/CdSe/ZnS photoanodes with the ZnS passivation
layers changed from 0 to 5 layers. The Nyquist has the three
semicircles at the different frequencies. The first semicircle
(from left to right in the Figure 4(a)) at the high frequencies
(95 Hz–1000 kHz) corresponds to the transfer of electrons
through the Pt/electrolyte contact and FTO/TiO2 contact
(note 𝑅𝑡𝑐1 ). The second semicircle at the middle frequencies
(0.44–95 Hz) shows the resistance against electrons diffusion
into the TiO2 films and the resistance against the transfer
electrons through the TiO2 /QDs/electrolyte contact (note
𝑅𝑐𝑡2 ). The third semicircle at the low frequencies (0.049–
0.44 Hz) is due to the electrons diffusion in S𝑛 2− /S2− .
In Figure 4(a), the radius of semicircles was extended
when the thickness of the ZnS passivation layers increased.
In addition, samples 2 and 3 still show the morphology of
the three semicircles. However, when the thickness of the
ZnS passivation layers increased, semicircles 1 and 3 were
mixed up with semicircles 2. Therefore, we only discussed
the semicircle at the middle frequencies. When the layers
of the ZnS changed from 1 to 2, the radius of semicircles
was narrow (𝑅𝑐𝑡2 from 1190 to 41.6 Ω) due to the increased
concentration of the photoelectrons through the TiO2 film
and the TiO2 /QDs/electrolyte contact [19]. However, the
radius of the semicircle increased when the layers of the ZnS
were over 3 layers (𝑅𝑐𝑡2 from 41.6 to 59000 Ω). These results
indicate that the resistance against the electrons diffusion into
the TiO2 film increased [15, 19].
Besides the recombination resistance, the chemical capacitance correlates with the electrons concentration in
the TiO2 CB were determined from the EIS, 𝐶𝜇 ∞
exp(𝑞𝑉F /𝑘B 𝑇), where 𝑞 is the elementary charge, 𝑘B is
Boltzmann constant and 𝑇 is the Kelvin temperature, 𝑉F is
the difference between the quasi-Fermi level at bias and the
equilibrium, and 𝑉F = (𝐸F𝑛 − 𝐸F0 )/𝑞. 𝐶𝜇 is as a function of 𝑉F .
Therefore, we can determine the electrons concentration in
the TiO2 film when QDSSCs were illuminated. In Table 2, the
chemical capacitance of the QDSSCs increased corresponding to the increased electrons concentration in the CB of the
TiO2 film when the CdS/CdSe QDs were coated with the
ZnS passivation layers. These results agree well with the I-V
curves and the Nyquist of the QDSSCs. With the ZnS passivation layers, we can reduce the recombination processes 1 and
6
Journal of Nanomaterials
Table 3: Photovoltaic performance parameters of the QDSSCs.
Number
1
2
3
4
QDSSCs
𝐽SC
(mA/cm2 )
𝑉OC
(V)
Fill factor
FF
Efficiency
𝜂 (%)
TiO2 /CdS/CdSe/ZnS at 100∘ C
TiO2 /CdS/CdSe/ZnS at 200∘ C
TiO2 /CdS/CdSe/ZnS at 300∘ C
TiO2 /CdS/CdSe/ZnS at 400∘ C
5.73
4.78
14
3.04
0.38
0.76
0.44
0.456
0.3
0.41
0.33
0.32
0.67
1.5
2.1
0.44
Table 4: The values of parameters were obtained from the EIS measurements.
Number
1
2
3
4
QDSSCs
𝑅S
(Ω)
𝑅ct2
(Ω)
𝑅ct1
(Ω)
𝜏
(ms)
𝐶
(𝜇F)
TiO2 /CdS/CdSe/ZnS at 100∘ C
TiO2 /CdS/CdSe/ZnS at 200∘ C
TiO2 /CdS/CdSe/ZnS at 300∘ C
TiO2 /CdS/CdSe/ZnS at 400∘ C
26.9
33.8
9.24
21.7
393
333
41.6
1160
268
158
13.5
1610
1.59
1.82
2.13
4.6
39.7
52.6
1040
39.7
2 in Figure 4(b). The current density increased because the
injected electrons into the CB of the TiO2 increased. These
results agree well with Jung and Jie group as the PbS and CdS
QDs are coated with the ZnS passivation layers for reducing
the recombination processes in the QDSSCs [22, 23].
Mora-Sero said that the recombination processes through
the surface states of the QDs were enhanced in the QDSSCs
[19]. Moreover, the recombination pathways in the QDSSCs
also occurred in the CdS center and between the TiO2
electrons and electrolyte [20]. Therefore, the recombination
resistance reduced corresponding to the decreased recombination rate between the TiO2 and electrolyte resulting in
the enhanced electrons collection efficiency when the ZnS
passivation layers were coated with the CdS/CdSe QDs in
our experiments. These obtained results agree well with the
results of Zhang et al. [19, 24]. Moreover, the enhanced electrons concentrations in the TiO2 CB have been determined
to the chemical capacitance valued in Table 2. The chemical
capacitance increased when the ZnS layers coated correspond
to the enhanced electrons efficiency in the QDSSCs [24].
3.3. Influence of Annealing Temperature. For improving the
crystalline structure of the photoanodes, increasing the ability to the absorbers of light and the electrons transfer [20],
we studied the QDSSCs based on the photoanodes at the different temperatures. At first, the photoanodes were annealed
in the air environment where the CdS/CdSe QDs were
oxidized. Therefore, all samples in this article were annealed
in the vacuum. To determine the structure of the material
after manufacture, we used XRD patterns. Figure 5(a) is
XRD patterns of the photoanodes at different annealing
temperatures. The structural analysis of the photoanodes at
different annealing temperatures is similar to the analysis
from Figure 2(a). The results indicate the TiO2 Anatase,
CdS, CdSe, and ZnS QDs with cubic. Moreover, when the
temperature rose from 100∘ C to 400∘ C the XRD intensity
increasing with the crystallization proved stronger in the
crystal. Figure 5(b) shows the UV-Vis of the photoanodes at
the different temperatures. At the high temperature, the peak
of the UV-Vis shifted toward the long waves corresponding
to the increased size. However, at 400∘ C, the CdS, CdSe,
and ZnS concentrations of the photoanodes were burned and
made the CdO. Therefore, the intensity of the UV-Vis spectra
was decreased.
The parameters of the I-V curves (Figure 5(c)) were
obtained in Table 3. The QDSSCs based on the photoanodes
annealed at 300∘ C have the highest efficiency. These results
agree well with the UV-Vis. When the temperature increased,
the photoanodes were the good crystallization (reduced the
recombination processes) corresponding to the shifting toward
the long waves. The results indicate that the current density
increased because of the high electrons concentration in the
TiO2 CB. These results agree well with Yu group when the
temperatures changed from 100∘ C to 250∘ C and the efficiency
of the QDSSCs increased from 0.46% to 2.8% [8].
To confirm these obtained results in our experiments,
the EIS were used for investigation of the recombination
resistance and chemical capacitance of the QDSSCs. Figure 6 shows Nyquist plots measured under illuminated
conditions for the QDSSCs based on the photoanodes at
the different temperatures and (b) the image zoom of (a)
(inset). The values of parameters were obtained from the
EIS measurements from Table 4. The result indicates that
the recombination resistance decreased while the chemical
capacitance increased at the high temperature (shown in
Table 4). We noted that the decreased surface states and the
enhanced electrons concentration in the TiO2 CB were due to
the perfected structural crystal at 300∘ C. These results agree
well with the I-V characteristic.
4. Conclusions
We have successfully prepared the QDSSCs based on the
TiO2 /CdS/CdSe photoanodes with the ZnS passivation layers
Journal of Nanomaterials
7
×102
12
TiO2 (110)
Intensity (a.u)
10
CdS (111)
CdSe (111)
8
TiO2 (004)
ZnS (220)
6
ZnS (331)
4
2
20
30
40
2 (∘ C)
50
60
TiO2 /CdS/CdSe/ZnS at 100∘ C
TiO2 /CdS/CdSe/ZnS at 200∘ C
TiO2 /CdS/CdSe/ZnS at 300∘ C
TiO2 /CdS/CdSe/ZnS at 400∘ C
(a)
14
0.6
12
Photocurrent density (mA/cm2 )
0.7
Intensity (a.u)
0.5
0.4
0.3
0.2
0.1
10
8
6
4
2
0
0.0
400
500
600
700
800
Wavelength (nm)
TiO2 /CdS/CdSe/ZnS at 100∘ C
TiO2 /CdS/CdSe/ZnS at 200∘ C
TiO2 /CdS/CdSe/ZnS at 300∘ C
TiO2 /CdS/CdSe/ZnS at 400∘ C
(b)
0.0
0.2
0.4
Voltage (V)
0.6
TiO2 /CdS/CdSe/ZnS at 100∘ C
TiO2 /CdS/CdSe/ZnS at 200∘ C
TiO2 /CdS/CdSe/ZnS at 300∘ C
TiO2 /CdS/CdSe/ZnS at 400∘ C
(c)
Figure 5: (a) XRD patterns of the photoanodes at the different annealing, (b) the UV-Vis, and (c) I-V curves of the QDSSCs based on the
photoanodes at the different temperatures.
and influence of the annealing temperature on the recombination resistance of the QDSSCs. The recombination resistance of the QDSSCs decreased when the photoanodes were
coated with the ZnS passivation layers. In addition, the current density and the electrons concentration in the TiO2 CB
increased due to the increased chemical capacitance. Beside,
we also investigated the effect of the annealing temperature
on recombination resistance, the chemical capacitance of the
QDSSCs. The result shows that the crystallization structure
perfected and reduced the recombination processes in the
QDSSCs and the increased electrons concentration into the
TiO2 films.
Competing Interests
The authors have no competing interests to declare.
8
Journal of Nanomaterials
Z (Ohm)
200
100
0
50
100
Z (Ohm)
TiO2 /CdS/CdSe/ZnS at 100∘ C
TiO2 /CdS/CdSe/ZnS at 200∘ C
TiO2 /CdS/CdSe/ZnS at 300∘ C
TiO2 /CdS/CdSe/ZnS at 400∘ C
×102
(b)
Z (Ohm)
10
5
0
0
1000
Z (Ohm)
2000
TiO2 /CdS/CdSe/ZnS at 100∘ C
TiO2 /CdS/CdSe/ZnS at 200∘ C
TiO2 /CdS/CdSe/ZnS at 300∘ C
TiO2 /CdS/CdSe/ZnS at 400∘ C
(a)
Figure 6: (a) Nyquist plots measured under illuminated conditions for the QDSSCs based on the photoanodes at the different temperatures
and (b) small image (inset).
Acknowledgments
This research is supported by Project CS2015.01.39. The
authors would like to thank Ho Chi Minh City of Science,
Vietnam. The authors would also like to thank Dr. Dang Vinh
Quang for English language editing of the paper.
References
[1] A. J. Nozik, “Exciton multiplication and relaxation dynamics in
quantum dots: applications to ultrahigh-efficiency solar photon
conversion,” Inorganic Chemistry, vol. 44, no. 20, pp. 6893–6899,
2005.
[2] J. Wu and Z. M. Wang, Quantum Dot Solar Cells, vol. 15,
Springer, New York, NY, USA, 2014.
[3] P. Guyot-Sionnest, “Colloidal quantum dots,” Comptes Rendus
Physique, vol. 9, no. 8, pp. 777–787, 2008.
[4] R. Vogel, K. Pohl, and H. Weller, “Sensitization of highly
porous, polycrystalline TiO2 electrodes by quantum sized CdS,”
Chemical Physics Letters, vol. 174, no. 3-4, pp. 241–246, 1990.
[5] Y.-L. Lee and Y.-S. Lo, “Highly efficient quantum-dot-sensitized
solar cell based on co-sensitization of CdS/CdSe,” Advanced
Functional Materials, vol. 19, no. 4, pp. 604–609, 2009.
[6] Q. Zhang, Y. Zhang, S. Huang et al., “Application of carbon
counterelectrode on CdS quantum dot-sensitized solar cells
(QDSSCs),” Electrochemistry Communications, vol. 12, no. 2, pp.
327–330, 2010.
[7] J. Chen, D. W. Zhao, J. L. Song et al., “Directly assembled CdSe
quantum dots on TiO2 in aqueous solution by adjusting pH
value for quantum dot sensitized solar cells,” Electrochemistry
Communications, vol. 11, no. 12, pp. 2265–2267, 2009.
[8] X.-Y. Yu, B.-X. Lei, D.-B. Kuang, and C.-Y. Su, “High performance and reduced charge recombination of CdSe/CdS quantum dot-sensitized solar cells,” Journal of Materials Chemistry,
vol. 22, no. 24, pp.12058–12063, 2012.
Journal of Nanomaterials
[9] T. Ha Thanh, V. Lam Quang, and D. Huynh Thanh, “Determination of the dynamic resistance of the quantum dots solar cells
by one I-V curve and electrochemical impedance spectra,” Solar
Energy Materials and Solar Cells, vol. 143, pp. 269–274, 2015.
[10] M. Samadpour, P. P. Boix, S. Gim´enez et al., “Fluorine treatment
of TiO2 for enhancing quantum dot sensitized solar cell performance,” Journal of Physical Chemistry C, vol. 115, no. 29, pp.
14400–14407, 2011.
[11] A. Tubtimtae and M.-W. Lee, “Effects of passivation treatment
on performance of CdS/CdSe quantum-dot co-sensitized solar
cells,” Thin Solid Films, vol. 526, pp. 225–230, 2012.
[12] J. Y. Kim, S. B. Choi, J. H. Noh et al., “Synthesis of CdSe-TiO2
nanocomposites and their applications to TiO2 sensitized solar
cells,” Langmuir, vol. 25, no. 9, pp. 5348–5351, 2009.
[13] G. I. Koleilat, L. Levina, H. Shukla et al., “Efficient, stable
infrared photovoltaics based on solution-cast colloidal quantum dots,” ACS Nano, vol. 2, no. 5, pp. 833–840, 2008.
[14] M. Kouhnavard, S. Ikeda, N. A. Ludin et al., “A review of semiconductor materials as sensitizers for quantum dot-sensitized
solar cells,” Renewable and Sustainable Energy Reviews, vol. 37,
pp. 397–407, 2014.
[15] J.-H. Ahn, R. S. Mane, V. V. Todkar, and S.-H. Han, “Invasion
of CdSe nanoparticles for photosensitization of porous TiO2 ,”
International Journal of Electrochemical Science, vol. 2, no. 7, pp.
517–522, 2007.
[16] A. Kongkanand, K. Tvrdy, K. Takechi, M. Kuno, and P. V. Kamat,
“Quantum dot solar cells. Tuning photoresponse through size
and shape control of CdSe-TiO2 architecture,” Journal of the
American Chemical Society, vol. 130, no. 12, pp. 4007–4015, 2008.
[17] P. Sudhagar, J. H. Jung, S. Park et al., “The performance of
coupled (CdS:CdSe) quantum dot-sensitized TiO2 nanofibrous
solar cells,” Electrochemistry Communications, vol. 11, no. 11, pp.
2220–2224, 2009.
[18] Z. Yu, Q. Zhang, D. Qin et al., “Highly efficient quasi-solidstate quantum-dot-sensitized solar cell based on hydrogel
electrolytes,” Electrochemistry Communications, vol. 12, no. 12,
pp. 1776–1779, 2010.
[19] Y. Zhang, J. Zhu, X. Yu, J. Wei, L. Hu, and S. Dai, “The optical
and electrochemical properties of CdS/CdSe co-sensitized TiO2
solar cells prepared by successive ionic layer adsorption and
reaction processes,” Solar Energy, vol. 86, no. 3, pp. 964–971,
2012.
[20] L.-W. Chong, H.-T. Chien, and Y.-L. Lee, “Assembly of CdSe
onto mesoporous TiO2 films induced by a self-assembled
monolayer for quantum dot-sensitized solar cell applications,”
Journal of Power Sources, vol. 195, no. 15, pp. 5109–5113, 2010.
[21] I. Mora-Ser´o, S. Gim´enez, T. Moehl et al., “Factors determining
the photovoltaic performance of a CdSe quantum dot sensitized
solar cell: the role of the linker molecule and of the counter
electrode,” Nanotechnology, vol. 19, no. 42, Article ID 424007,
2008.
[22] S. W. Jung, J.-H. Kim, H. Kim, C.-J. Choi, and K.-S. Ahn, “ZnS
overlayer on in situ chemical bath deposited CdS quantum dotassembled TiO2 films for quantum dot-sensitized solar cells,”
Current Applied Physics, vol. 12, no. 6, pp. 1459–1464, 2012.
[23] J. Jiao, Z.-J. Zhou, W.-H. Zhou, and S.-X. Wu, “CdS and
PbS quantum dots co-sensitized TiO2 nanorod arrays with
improved performance for solar cells application,” Materials
Science in Semiconductor Processing, vol. 16, no. 2, pp. 435–440,
2013.
[24] J. S. Woo, K. Jae-Hong, K. Hyunsoo, C. Chel-Jong, and A.
Kwang-Soon, “Enhanced electron lifetime in CdS quantum
9
dot-sensitized solar cells with nanoporous-layer-covered TiO2
nanotube arrays,” Current Applied Physics, vol. 12, no. 6, pp.
1459–1464, 2012.
Journal of
Nanotechnology
Hindawi Publishing Corporation
Volume 2014
International Journal of
International Journal of
Corrosion
Hindawi Publishing Corporation
Polymer Science
Volume 2014
Hindawi Publishing Corporation
Volume 2014
Smart Materials
Research
Hindawi Publishing Corporation
Journal of
Composites
Volume 2014
Hindawi Publishing Corporation
Volume 2014
Journal of
Metallurgy
BioMed
Research International
Hindawi Publishing Corporation
Volume 2014
Nanomaterials
Hindawi Publishing Corporation
Volume 2014
Submit your manuscripts at
Journal of
Materials
Hindawi Publishing Corporation
Volume 2014
Journal of
Nanoparticles
Hindawi Publishing Corporation
Volume 2014
Nanomaterials
Journal of
Advances in
Materials Science and Engineering
Hindawi Publishing Corporation
Volume 2014
Journal of
Hindawi Publishing Corporation
Volume 2014
Journal of
Nanoscience
Hindawi Publishing Corporation
Scientifica
Hindawi Publishing Corporation
Volume 2014
Journal of
Coatings
Volume 2014
Hindawi Publishing Corporation
Crystallography
Volume 2014
Hindawi Publishing Corporation
Volume 2014
The Scientific
World Journal
Hindawi Publishing Corporation
Volume 2014
Hindawi Publishing Corporation
Volume 2014
Journal of
Journal of
Textiles
Ceramics
Hindawi Publishing Corporation
International Journal of
Biomaterials
Volume 2014
Hindawi Publishing Corporation
Volume 2014