DSpace at VNU: Pressure-assisted capillary electrophoresis for cation separations using a sequential injection analysis manifold and contactless conductivity detection
Bạn đang xem bản rút gọn của tài liệu. Xem và tải ngay bản đầy đủ của tài liệu tại đây (353.13 KB, 6 trang )
Talanta 84 (2011) 1228–1233
Contents lists available at ScienceDirect
Talanta
journal homepage: www.elsevier.com/locate/talanta
Pressure-assisted capillary electrophoresis for cation separations using a
sequential injection analysis manifold and contactless conductivity detection
Thanh Duc Mai a,b , Peter C. Hauser a,∗
a
b
University of Basel, Department of Chemistry, Spitalstrasse 51, 4056 Basel, Switzerland
Centre for Environmental Technology and Sustainable Development (CETASD), Hanoi University of Science, Nguyen Trai Street 334, Hanoi, Viet Nam
a r t i c l e
i n f o
Article history:
Available online 25 December 2010
Keywords:
Capillary electrophoresis (CE)
Pressure-assisted capillary electrophoresis
(PACE)
Sequential injection analysis (SIA)
Capacitively coupled contactless
conductivity detection (C4 D)
a b s t r a c t
Pressure assisted capillary electrophoresis in capillaries with internal diameters of 10 m was found possible without significant penalty in terms of separation efficiency and sensitivity when using contactless
conductivity detection. A sequential injection analysis manifold consisting of a syringe pump and valves
was used to impose a hydrodynamic flow in the separation of some inorganic as well as organic cations. It
is demonstrated that the approach may be used to optimize analysis time by superimposing a hydrodynamic flow parallel to the electrokinetic motion. It is also possible to improve the separation by using the
forced flow to maintain the analytes in the capillary, and thus the separation field, for longer times. The
use of the syringe pump allows flexible and precise control of the pressure, so that it is possible to impose
pressure steps during the separation. The use of this was demonstrated for the speeding up of late peaks,
or forcing repeated passage of the sample plug through the capillary in order to increase separation.
© 2011 Elsevier B.V. All rights reserved.
1. Introduction
In capillary electrophoresis the performance in terms of separation efficiency, detection limits, and analysis time is generally
optimized by varying the injected amount, the separation voltage
applied and the capillary length. These parameters are interdependent, in that the injected amount affects both, separation
and sensitivity, and separation voltage and capillary length determine field strength as well as residence time of the analytes.
The product of the latter parameters is largely responsible for
separation efficiency. Of the three variable parameters, only the
injection volume and separation volume can be optimized via automated, electronic control; the adjustment of the capillary length
requires mechanical manipulations by the operator and possible reconditioning. A potentially further useful parameter is the
superimposition of a hydrodynamic flow in order to modify the
residence time, either for improved separation or for faster analysis. However, pressurization has not generally been employed
as the imposition of a hydrodynamic flow tends to lead to extra
bandbroadening (see Section 2). Reports on pressure assisted
capillary electrophoresis (PACE) have therefore been largely limited to counterbalancing the electroosmotic flow in order to
increase the residence time and hence separation [1–3], and to
special applications such as CE coupled to a mass spectrometer
∗ Corresponding author. Fax: +41 61 267 1013.
E-mail address: (P.C. Hauser).
0039-9140/$ – see front matter © 2011 Elsevier B.V. All rights reserved.
doi:10.1016/j.talanta.2010.12.023
via electrospray ionization and capillary electrochromatography
[4–12].
On the other hand, band broadening due to the effect of the
laminarity of a hydrodynamic flow can be reduced by using capillaries of very small diameters (see Section 2). While the commonly
employed UV-absorption method is not well suited for detection in
very narrow capillaries due to its direct dependence on the optical
pathlength, Zemann and co-workers [13] showed that capacitively
coupled contactless conductivity detection (C4 D) may be used for
capillaries with internal diameters as small as 10 m. A later report
by Wuersig et al. [14] furthermore indicated that good sensitivity
should be possible with C4 D in such slender channels. The increasingly popular method relies on two tubular electrodes placed on
the outside of the separation capillary, and is thus very simple and
robust and in principle suitable for the determination of any ion.
More details can be found in recent reviews [15–17] as well as in
fundamental studies [18–21].
The coupling of sequential-injection analysis (SIA) based on a
syringe pump and a multi-position valve with CE is a relatively
new approach which provides simultaneous detection capability
to SIA. On the other hand it is also an attractive and versatile means
to miniaturization, automation and extension of CE. Conventional
instruments rely on the more complex application of gas pressure or vacuum to effect injection or flushing of capillaries. Some
SIA–CE systems with optical detection have been reported by several research groups [22–27] and Wuersig et al. used an SIA–CE-C4 D
system to achieve fast separation of inorganic ions in approximately
10 s [14]. Recently, Mai et al. demonstrated the use of an automated
T.D. Mai, P.C. Hauser / Talanta 84 (2011) 1228–1233
1229
Capillary
Standards
DI Water
Pressure
Sensor
1 M NaOH
Pt
Electrolyte
Solution
C4D
Restriction Stop
Valve V1
Valve
HV
+/Pt
Holding
coil
W
Grounded
interface
Sample
Syringe
Pump
W
Stop
Valve V2 W
Buffer
Safety case
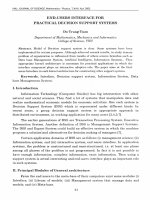
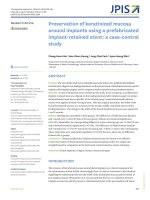
Fig. 1. Schematic drawing of the SIA–CE-C4 D-system for pressure-assisted capillary electrophoresis. C4 D: contactless conductivity detector; HV: high-voltage power supply;
W: waste.
SIA–CE-C4 D system for long-term unattended on-site monitoring
[28]. Herein, the investigation of the use of an SIA-manifold for
pressurization of a CE-C4 D system in order to superimpose a hydrodynamic flow for the optimization of separation and/or analysis
time of cations is reported.
According to these equations both effects are thus strongly
dependent on the internal size of the capillaries, and a reduction
of the diameter can be expected to lead to an improvement of
resolution (corresponding to a low H) even in the absence of hydrodynamic flow.
2. Theoretical aspects
3. Experimental
Studies of the effect of an imposed laminar flow on dispersion
and thus on electrophoretic efficiency have been reported [29–31].
Grushka [31] expressed the dependence of the theoretical plate
height (H) on the hydrodynamic flow velocity (vp ) as follows:
3.1. Chemicals and materials
H=
2D
vtot
+
d2 v2p
(1)
24Dvtot
D is the diffusion coefficient and d is the inner capillary diameter.
vtot is the total average velocity of the analyte ion, which is given by
va + vp when the hydrodynamic and electrophoretic flows are in the
same direction (va , velocity of the analyte ion) and by vp − va if they
are in the reverse direction. For cation separations va is given by ve
(electrophoretic velocity of the analyte ion) + vEOF (electroosmotic
flow velocity). The first term in the equation relates to longitudinal
diffusion while the second term is due to the parabolic flow profile induced by the laminar flow. For parallel-pressure induced CE
where vtot = vp + va , an increase in vp results in a larger value of
vtot , leading to a smaller value of 2D/vtot but an increased value of
d2 v2p /24Dvtot .
Eq. (1), however, does not include a further consideration. In an
unrelated study by Liu et al. [32] (and in works cited therein) it
was found both theoretically and experimentally that a significant
contribution to band broadening may also be due to thermal effects
caused by Joule heating due to the application of the separation
voltage. The contribution of Joule heating to the plate height in CE is
displayed in the second term of the following equation (a modified
version of the equation given by Liu et al. [32], which does not take
into account any possible hydrodynamic flow):
H=
2D
va
+
2 2 v2
e
k2 D
K1
E 4 d6
va
+ K2
E 6 d8
LD
(2)
E is the electric field strength, L the effective length of a capillary,
the specific conductance of the solution, k the thermal conductivity of the buffer, the thermal coefficient of the solute mobility,
and K1 and K2 are experimental coefficients. Mayrhofer et al. [13]
indeed attributed an improvement of plate numbers found in CEC4 D for capillaries with increasingly smaller internal diameters to
a reduced effect of Joule heating.
All chemicals were of analytical or reagent grade and purchased from Fluka (Buchs, Switzerland) or Merck (Darmstadt,
Germany) except for 2-amino-1-butanol and 1-amino-2-propanol
which were obtained from Lancaster (Morecambe, England). Stock
solutions of 5 mM were used for the preparation of the standards and those of the inorganic cations were prepared from the
respective chloride salts. The separation buffer consisted of 12 mM
l-histidine adjusted to pH 4 with acetic acid in all cases, unless otherwise stated. Before use, the capillary was preconditioned with
1 M NaOH for 10 min and deionised water for 10 min prior to flushing with electrolyte solution (for 1 h). Deionised water purified with
a system from Millipore (Bedford, MA, USA) was used for the preparation of all solutions. The sample of red wine was purchased from
a local shop and was prepared by filtering through a 0.02 m PTFE
membrane filter (Chromafil O-20/15 MS, Macherey-Nagel, Oensingen, Switzerland), then diluted with deionised water followed by
ultra-sonicating for 10 min for degassing. The dilution was carried
out immediately prior to use.
3.2. Instrumentation
A simplified diagram of the instrument is given in Fig. 1. The
SIA section consists of a syringe pump (Cavro XLP 6000) fitted
with a 1 mL syringe and a 6-port channel selection valve (Cavro
Smart Valve) (both purchased from Tecan, Crailsheim, Germany).
To connect the SIA manifold to the CE part, a purpose made interface based on two consecutive T-junctions was used. Details on
this interface have been given previously [33]. The micro graduated needle valve (restriction valve) and the isolation valves used
for pressurization were obtained from Upchurch Scientific (P-470,
Oak Harbor, WA, USA) and from NResearch (HP225T021, Gümligen, Switzerland), respectively. A dual polarity high voltage power
supply (Spellman CZE2000, Pulborough, UK) with ±30 kV maximum output voltage and polyimide coated fused silica capillaries
of 365 m OD (from Polymicro, Phoenix, AZ, USA) were used for
all CE experiments. One end of the capillary was connected to
the grounded SIA–CE interface, the other end was placed in a vial
T.D. Mai, P.C. Hauser / Talanta 84 (2011) 1228–1233
filled with background electrolyte (BGE), in which the high voltage electrode is placed. A safety cage, which was equipped with a
microswitch to interrupt the high voltage on opening, was used to
isolate the high voltage assembly. Detection was carried out with
a C4 D-system built in-house, details can be found elsewhere [34].
The cell currents are strongly dependent on the capillary diameter
and therefore different feedback resistors were fitted to the pickup amplifier which converts the signal to a voltage, for details see
[20]. Resistors of 220 k , 270 k , 1 M and 3.9 M were fitted
for capillaries of 75 m, 50 m, 25 m and 10 m, respectively.
An e-corder 201 data acquisition system (eDAQ, Denistone East,
NSW, Australia) was used for recording the detector signals. The
fluidic pressure was monitored in-line with a sensor from Honeywell (24PCFFM6G, purchased from Distrelec, Uster, Switzerland).
The programming package LabVIEW (version 8.0 for Windows XP,
from National Instruments, Austin, TX, USA) was used to write the
control code. Further detail on the instrument can be found in our
previous publication [28].
3.3. Operation
The SIA-manifold allows automated capillary conditioning,
flushing as well as hydrodynamic sample aspiration and injection.
For capillary flushing both stop-valves (designated as V1 and V2
in Fig. 1) are closed while pumping solution at a low flow rate.
Injection is carried out by pumping a defined sample plug past the
capillary inlet in the SIA–CE interface while partially pressurizing
the manifold by closing only V2. This procedure is necessary as it
is not possible to create sample plugs of appropriate small size for
complete injection. More details on the typical procedures can be
found in the previous publication [28]. Separation is carried out
by application of the high voltage of appropriate polarity from the
detector end, while the injection end remains grounded at all times.
This is contrary to conventional set-ups, but C4 D is not affected by
this arrangement. Pressurization of the capillary during separation
was achieved by closing both stop-valves while advancing the stepper motor driven syringe pump by the smallest increment possible
(corresponding to 0.02 L). To obtain constant pressure the increment was repeated at appropriate time intervals (typically 10 s) to
compensate for its slow decrease due to the passing of the solution. Pressure gradients could be established by adjusting the time
intervals and/or the volume increments and the use of the pressure
sensor allowed a precise monitoring and adjustment. The resulting
hydrodynamic flow velocities were experimentally determined by
pumping a small plug of water through the capillary filled with
background electrolyte (in the absence of an applied voltage) and
determining the time until passage through the detector.
4. Results and discussion
4.1. Dependence of the sensitivity and separation efficiency on
the internal diameter of the capillary
The first experiments concerned an investigation of the premise
that C4 D is indeed compatible with narrow capillaries. Separations
were carried out, initially without application of pressure, in capillaries of IDs from a standard size of 75 m down to 10 m. The
use of smaller IDs was attempted, but was found not to be readily
possible because of the excessive pressures required for flushing
of the narrower capillaries. A sample plug of 0.8 cm length was
injected in each case, which corresponds approximately to 2% of
the effective capillary length (37 cm) as was suggested by Huang
et al. [35] as optimum. Mixtures of the three cations, K+ , Na+ and Li+ ,
were injected at different concentrations and the detection limits,
defined as the concentrations which give peak heights correspond-
Table 1
Detection limits for the determination of some inorganic cations with capillaries of
different internal diameters. CE conditions: 12 mM His adjusted to pH 4 with acetic
acid; leff = 37 cm; E = 400 V/cm.
LODa (M)
Cation
+
K
Na+
Li+
a
75 m
50 m
25 m
10 m
1.3
1.8
2.3
1.0
1.5
2.0
1.3
1.8
2.0
2.3
3.0
3.0
Based on peak heights corresponding to 3 times the baseline noise.
ing to three times the baseline noise level, were determined for
the different capillary diameters. As can be seen from the data of
Table 1, the LODs determined are all in the low M-range, and
almost identical for the 4 diameters investigated, with the loss of
sensitivity in going to the narrowest capillary being less than a factor of two for all three ions. This interesting feature of C4 D is deemed
to be due to the fact that the device is a bulk detector, that is, it
responds to a general solution property, rather than being analyte
specific. Thus when decreasing the cell size (by reducing the capillary diameter) not only the signal for the analyte is reduced, but
also the background signal. The reduction of the noise associated
with the latter must lead to the observed behaviour. Clearly, the
use of narrow capillaries down to 10 m ID is possible with C4 D
without incurring a significant penalty in detection limits as would
be the case with optical detection.
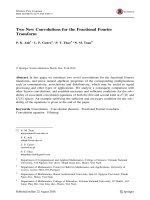
The second critical aspect is the question if indeed it is possible to introduce hydrodynamic flow without serious deterioration
of separation efficiency when using CE-C4 D with narrow capillaries. Thus the theoretical plate numbers (N) were determined
from electropherograms obtained for the injection of 100 M Na+
into capillaries of different internal diameter and for superimposed
hydrodynamic flow velocities in the range from 0.025 to 0.27 cm/s.
Note, that for the field strength used, the velocity of sodium ions due
to the electrophoretic mobility would be 0.16 cm/s and the electroosmotic flow would be 0.025 cm/s. The data is shown in Fig. 2.
It is, first of all, clearly evident that the separation efficiency is
strongly dependent on capillary diameter, even when no hydrodynamic flow is imposed. The application of pressure leads to a
lowering of separation efficiency, but the relative deterioration in
plate numbers is indeed much less pronounced for the smaller
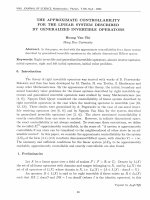
120000
10 m
100000
Plate number (N)
1230
80000
25 m
60000
40000
50 m
20000
75 m
0
0.00
0.05
0.10
0.15
0.20
0.25
0.30
Hydrodynamic flow velocity (cm/s)
Fig. 2. Plate number versus superimposed hydrodynamic flow velocity for different capillary IDs. Analyte: Na+ 100 M in deionised water. Separation: leff = 37 cm;
E = 300 V/cm.
T.D. Mai, P.C. Hauser / Talanta 84 (2011) 1228–1233
diameters. For the largest capillary of 75 m ID, the deterioration
of about 50% from about 30,000 to 15,000 is significant, while the
lowering of about 25% from the high initial level of 110,000 for the
10 m capillary can easily be tolerated. Note the slight increase in
plate numbers for capillaries of small IDs (10 m and 25 m) when
going from flow rates of 0.025 cm/s to 0.05 cm/s. This phenomenon
was also described by Grushka [31] and was ascribed to the fact
that at small flow rates and with narrow capillaries, the increase
in laminar flow induced dispersion is only small when increasing
the flow rate, and is more than compensated for by a decrease in
longitudinal diffusion.
Hydrodynamic pumping is thus well possible with capillaries of
10 m ID as high separation efficiency (N > 80,000) can always be
maintained at any of the flow rates tested which encompass a range
relevant for modification of the mobilities of the ions due to electrophoretic and electroosmotic migration, and, as shown above, the
loss in sensitivity is negligible.
(A)
1231
*
K
Na
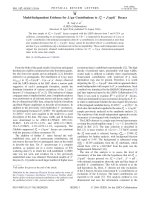
4.2.2. Concurrent separation of fast and slow migrating amines
A related, but slightly more complex situation are separations
of mixtures of fast and slowly migrating analytes. Optimization of
separation then has to be done for the fast ions, but this can lead
to exceedingly long migration times for the slow ions. The separation of a range of 9 amines, separated in their protonated cationic
form, shown in the electropherogram of Fig. 5a illustrates the situation. The first 6 ions are separated within about 7 min while the
passage of the slow ions (with negative going peaks) requires more
than 20 min. The situation is also familiar from HPLC and is the
+
+
Li
Pi
0
50
100
150
200
250
200
250
Time (s)
(B)
*
4.2. Separations with hydrodynamic flow in the same direction as
the electrophoretic mobility
4.2.1. Optimization of analysis time of inorganic cations
When the resolution between analytes in CE is found to be more
than adequate (R ≥ 2), an optimization of analysis time, and hence
sample throughput, is possible. This can in principle be achieved
by an increase of the separation voltage or by a shortening of the
capillary. The first approach may however not be possible if the
upper limit of the available voltage range is already used or Joule
heating is problematic, and the second method requires mechanical
manipulations which can only be reversed by installing and conditioning a new capillary. Using a hydrodynamic flow to push the ions
through is an alternative, flexible and easily reversible approach.
The electropherograms for the three inorganic cations K+ , Na+ and
Li+ obtained subsequently without and with parallel pumping are
shown in the two parts of Fig. 3 along with the recorded pressure
profiles. As can be seen, the pressurization allows optimization of
the analysis time on the fly, the separation time is reduced to less
than half, while baseline resolution is still preserved.
For a further demonstration, the method was applied to the
separation of inorganic cations in a sample of red wine. The electropherograms of a standard mixture containing 6 cationic species,
as well as those of a diluted red wine sample, with and without
pressure assistance, are shown in Fig. 4. To determine the cations
present in the red wine sample, each peak was identified by comparing the migration time with that of the standard mixtures. It is
seen that K+ , Ca2+ , Mg2+ and Na+ are present in abundant amounts
and the complete passage through the detector with more than
adequate baseline resolution was observed after 5 min without the
application of pressure (electropherograms a and b). By employing
a pressure of 1.6 bar from the beginning of electrophoresis the running time could be reduced to around 2 min while still obtaining
baseline resolution (electropherograms c and d). Thus the sample
throughput could be significantly improved. Note that a number of
additional peaks were detected, but no effort was made to identify
these species.
+
K
+
Na
+
+
Li
Ps
Pi
0
50
100
150
Time (s)
Fig. 3. Optimization of electrophoresis time with hydrodynamic flow. Analytes:
100 M. Separation: 10 m ID capillary with leff = 37 cm; E = 400 V/cm. The pressure was recorded on-line during hydrodynamic injection and (pressure-assisted)
electrophoretic separation. (A) Separation without pressure; (B) separation with
pressure. Pi : pressure applied for injection; Ps : pressure applied for separation;
*Voltage pulse occurring when HV is turned on, indicating the start of the electrophoresis process.
reason why for this method usually gradient elution is employed.
However, this approach is not possible in capillary electrophoresis.
As more than adequate baseline resolution was obtained with the
conditions employed, a significant overall shortening of the analysis time to 4 min is possible by superimposing a hydrodynamic flow
using an applied pressure of 0.9 bar as illustrated in electropherogram of Fig. 5b. A further improvement is possible by increasing the
applied pressure to 3 bar after passage of the faster ions, as shown
in Fig. 5c. Note that a constant pressure of 3 bar from the beginning
of the separation would not allow resolution of any of the analytes. The calibration data obtained under parallel-flow driven CE
with moderate pressure of 0.9 bar is given in Table 2. The detection
limits achieved for the conditions are in the range from 1.5 M to
15 M and calibration curves were acquired up to 300 M. As the
reproducibility data for retention time (approximately 1%) and for
peak area (between 2 and 5%) also given in Table 2 shows, the precision obtained in the approach is not deteriorated compared to
conventional CE without pumping.
4.3. Separations with hydrodynamic flow against the
electrophoretic mobility
4.3.1. Separation of high mobility inorganic cations
In CE-C4 D fast migrating cations may not be resolved under
given conditions, and this is more pronounced when the concentrations are high. Overlaps can generally be minimized by reducing the
injected volume, or by dilution of the sample, but this approach is
1232
T.D. Mai, P.C. Hauser / Talanta 84 (2011) 1228–1233
1
3
2
5
(a)
4
6
(a)
1 23
4 5
6
7
2
200
400
(b)
5
8
600
9
800
1000
1 2 3
System peak
1200
1400
4 5
6
3
4
(b)
7
5
3
12
4
1 2 3
(c)
5
System peak
8
9
6
6
(c)
7
50
2
100
89
150
200
Migration time (s)
Fig. 5. Concurrent separation of fast and slowly migrating amines. Analytes:
(1) methylamine (100 M); (2) dimethylamine (100 M); (3) trimethylamine
(100 M); (4) 1-amino-2-propanol (200 M); (5) 2-amino-1-butanol (200 M);
(6) 1-phenyl-ethylamine (200 M); (7) 3,5-dimethylaniline (200 M); (8) 2,6dimethylaniline (100 M); (9) 2,6-diisopropylaniline (100 M). Separation: 10 m
ID capillary with leff = 40 cm; E = 400 V/cm. (a) No pressure applied; (b) P = 0.9 bar
from t = 0 s; (c) P1 = 0.9 bar from t = 0 s and P2 = 3 bar from t = 175 s.
5
3
4
(d)
2+
100
150
200
250
Ca
300
Migration time (s)
+
Fig. 4. Separation of inorganic cations in a red wine sample. (a) Solutions of standards, 200 M, P = 0 bar; (b) diluted red wine sample, P = 0 bar; (c) solution of
standards, 200 M, P = 1.6 bar; (d) diluted red wine sample, P = 1.6 bar. CE conditions:
10 m ID capillary with leff = 43 cm; E = 400 V/cm; BGE: His 12 mM and 18-Crown-6
2 mM adjusted to pH 4 with acetic acid. Analytes: (1) NH4 + ; (2) K+ ; (3) Ca2+ ; (4) Na+ ;
(5) Mg2+ ; (6) Li+ .
not possible when one of the adjacent peaks is at low concentration.
This situation is illustrated by electropherogram (a) of Fig. 6. The
relatively small signal for the sodium ion is completely obscured
by the large and tailing peak for calcium ions. As demonstrated by
electropherogram (b) of Fig. 6, it is possible to resolve the peaks
by increasing the residence time of the ions via the introduction
of a hydrodynamic flow against the electrophoretic and electroosmotic migration. This requires a reversal of the applied voltage.
The analytes then migrate electrophoretically towards the injection end, but are slowly pushed hydrodynamically to the detector
end. This leads to a swapping of the peak order and the more slowly
migrating Na+ is now arriving at the detector first. The separation
was achieved in a short capillary of only 7 cm length. The triangular peak shapes are a common feature of capillary electrophoresis
Na
(a)
2+
Ca
+
Na
(b)
100
200
300
400
500
600
Migration time (s)
Fig. 6. Separation of Ca2+ (2000 M) and Na+ (100 M). (a) Normal CE, 10 m ID
capillary with leff = 40 cm; E = 400 V/cm; (b) counter-pressure assisted CE, 10 m ID
capillary with leff = 7 cm; E = 400 V/cm, P = 0.9 bar.
due to electrodispersion which occurs because of differences in the
electrophoretic mobilities ( ) of analyte and buffer ions, and this
effect is more pronounced for higher concentrations. For conductivity detection a certain mismatch is necessary for good detection
Table 2
Calibration ranges, detection limits (LODs) and reproducibility for the determination of amines with pressure-assisted CE.
Amine
Range (M)a
Correlation coefficient, r
LODb (M)
RSD% MTc (n = 4)
RSD% PAd (n = 4)
Methylamine
Dimethylamine
Trimethylamine
1-Amino-2-propanol
2-Amino-1-butanol
1-Phenyl-ethylamine
3,5-Dimethylaniline
2,6-Dimethylaniline
2,6-Diisopropylaniline
5–200
5–200
5–200
10–300
10–300
15–300
40–400
5–200
5–200
0.9992
0.9995
0.9993
0.9991
0.9992
0.9993
0.9980
0.9993
0.9989
1.5
1.5
1.5
3.0
3.0
5.0
15.0
2.0
2.0
0.7
0.7
0.8
0.8
0.9
0.8
0.9
1.0
1.2
2.2
2.6
2.4
2.9
3.1
3.0
3.9
4.2
4.6
a
b
c
d
5 concentrations.
Based on peak heights corresponding to 3 times the baseline noise.
Effective migration time.
Peak area.
T.D. Mai, P.C. Hauser / Talanta 84 (2011) 1228–1233
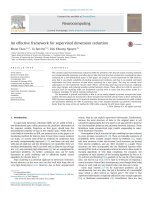
1233
which show the detector response following increasing numbers
of passages. Complete separation is achieved at the 10th round.
1 2
5. Conclusions
(a)
150
200
250
300
12
(b)
1250
1300
1350
1400
1 2
(c)
2150
2200
2250
Pressure assisted capillary electrophoresis can be carried out
without significant penalty in terms of resolution and sensitivity
in capillaries of 10 m internal diameter when contactless conductivity detection is employed. The use of hydrodynamic flow as an
additional parameter leads to increased flexibility in the optimization of separations and can be implemented on the fly for different
tasks at hand without requiring mechanical changes to the system
geometry. This then allows separations which otherwise are difficult to achieve. The use of an SIA manifold for pressurization was
found to be straightforward, allows precise control, and is highly
flexible.
2300
Acknowledgement
1
(d)
2
The authors would like to thank the Swiss National Science
Foundation for partial funding (Grant No. 200021-129721/1).
3150
3200
3250
3300
Migration time (s)
Fig. 7. Separation of diethylamine (1) and 1-amino-2-propanol (2) (300 M) by
normal CE, but repeated several times by using hydrodynamic flow to return the
sample to the starting point before each run. (a) 1st electrophoresis run; (b) 4th
run; (c) 7th run; (d) 10th run. 10 m ID capillary with leff = 7 cm; E = 400 V/cm. Fluidic
pressure for sample delivery: 5.5 bar.
sensitivity as mobility is directly related to ionic conductivity ( )
according to = F, where F is the Faraday constant.
4.3.2. Separation of organic cations of moderate electrophoretic
mobility
Previous work in our group showed that the two amines, 1amino-2-propanol and diethylamine can be separated in capillary
electrochromatography (CEC) carried out in monolithic columns
with contactless conductivity measurements [36], but no success
was obtained when trying to achieve baseline separation under
normal CE conditions in open capillaries with conductivity detection. Therefore the use of a hydrodynamic flow to counter-balance
the mobility and electroosmotic flow, as described above for the
fast inorganic cations, was also investigated for this pair of hard
to separate species. It was found that this was more challenging
than for the inorganic cations in that a much longer residence time
was required. This poses a difficulty in that it was also found hard
to accurately balance the electroosmotic flow for extended periods, as this depends on the surface condition of the capillary and
is not perfectly stable over time. A different approach was therefore chosen. First, the sample plug is delivered close to the high
voltage end of the capillary by using hydrodynamic pumping while
the separation voltage is off. During this process no separation is
expected. Pressurization is then ended by opening the stop valves
and the anodic separation voltage turned on. The two amines then
move towards the grounded end of the capillary electrophoretically. As soon as the amines reach the proximity of the grounded
end, the separation voltage is turned off, and pressurization triggered again to force the two amines to move back to the HV-end by
hydrodynamic flow. These steps are repeated several times until
baseline separation of the two amines is obtained. Note that the
detector is positioned near the grounded end of the capillary in this
case. The process is illustrated by the electropherograms of Fig. 7,
References
[1] T.H. Henley, R.T. Wilburn, A.M. Crouch, J.W. Jorgenson, Anal. Chem. 77 (2005)
7024–7031.
[2] B. Chankvetadze, N. Burjanadze, D. Bergenthal, G. Blaschke, Electrophoresis 20
(1999) 2680–2685.
[3] C.T. Culbertson, J.W. Jorgenson, Anal. Chem. 66 (1994) 955–962.
[4] J. Wang, M. Ma, R. Chen, L. Li, Anal. Chem. 80 (2008) 6168–6177.
[5] T. Soga, T. Ishikawa, S. Igarashi, K. Sugawara, Y. Kakazu, M. Tomita, J. Chromatogr. A 1159 (2007) 125–133.
[6] K. Harada, E. Fukusaki, A. Kobayashi, J. Biosci. Bioeng. 101 (2006) 403–409.
[7] Z. Szakács, B. Noszái, Electrophoresis 27 (2006) 3399–3409.
[8] A.R. Ivanov, C. Horváth, B.L. Karger, Electrophoresis 24 (2003) 3663–3673.
[9] H. Wan, A.G. Holmén, Y.D. Wang, W. Lindberg, M. Englund, M.B. Någård, R.A.
Thompson, Rapid Commun. Mass Spectrom. 17 (2003) 2639–2648.
[10] T. Soga, Y. Ueno, H. Naraoka, K. Matsuda, M. Tomita, T. Nishioka, Anal. Chem.
74 (2002) 6224–6229.
[11] Z.J. Jia, T. Ramstad, M. Zhong, J. Pharm. Biomed. Anal. 30 (2002) 405–413.
[12] Y. Ishihama, M. Nakamura, T. Miwa, T. Kajima, N. Asakawa, J. Pharm. Sci. 91
(2002) 933–942.
[13] K. Mayrhofer, A.J. Zemann, E. Schnell, G.K. Bonn, Anal. Chem. 71 (1999)
3828–3833.
ˇ S.S. Khaloo, P.C. Hauser, Analyst 131 (2006) 944–949.
[14] A. Wuersig, P. Kubán,
[15] M. Trojanowicz, Anal. Chim. Acta 653 (2009) 36–58.
ˇ P.C. Hauser, Electrophoresis 30 (2009) 176–188.
[16] P. Kubán,
ˇ P.C. Hauser, Anal. Chim. Acta 607 (2008) 15–29.
[17] P. Kubán,
[18] J.G.A. Brito-Neto, J.A.F. da Silva, L. Blanes, C.L. do Lago, Electroanalysis 17 (2005)
1198–1206.
[19] J.G.A. Brito-Neto, J.A.F. da Silva, L. Blanes, C.L. do Lago, Electroanalysis 17 (2005)
1207–1214.
ˇ P.C. Hauser, Electrophoresis 25 (2004) 3398–3405.
[20] P. Kubán,
ˇ P.C. Hauser, Electrophoresis 25 (2004) 3387–3397.
[21] P. Kubán,
[22] B. Horstkotte, O. Elsholz, V.C. Martín, Talanta 76 (2008) 72–79.
[23] B. Horstkotte, O. Elsholz, V.C. Martín, Int. J. Environ. Anal. Chem. 87 (2007)
797–811.
[24] S. Kulka, G. Quintás, B. Lendl, Analyst 131 (2006) 739–744.
[25] C.K. Zacharis, F.W.A. Tempels, G.A. Theodoridis, A.N. Voulgaropoulos, W.J.M.
Underberg, G.W. Somsen, G.J. de Jong, J. Chromatogr. A 1132 (2006) 297–303.
[26] C.H. Wu, L. Scampavia, J. Ruzicka, Analyst 128 (2003) 1123–1130.
[27] C.-H. Wu, L. Scampavia, J. Ruzicka, Analyst 127 (2002) 898–905.
[28] T.D. Mai, S. Schmid, B. Müller, P.C. Hauser, Anal. Chim. Acta 665 (2010) 1–6.
[29] U. Tallarek, E. Rapp, T. Scheenen, E. Bayer, H. Van As, Anal. Chem. 72 (2000)
2292–2301.
[30] C.A. Keely, R.R. Holloway, T. Vandegoor, D. McManigill, J. Chromatogr. A 652
(1993) 283–289.
[31] E. Grushka, J. Chromatogr. 559 (1991) 81–93.
[32] J.P. Liu, V. Dolnik, Y.Z. Hsieh, M. Novotny, Anal. Chem. 64 (1992) 1328–1336.
ˇ A. Engström, J.C. Olsson, G. Thorsén, R. Tryzell, B. Karlberg, Anal. Chim.
[33] P. Kubán,
Acta 337 (1997) 117–124.
ˇ P.C. Hauser, Meas. Sci. Technol. 17 (2006)
[34] L. Zhang, S.S. Khaloo, P. Kubán,
3317–3322.
[35] X.H. Huang, W.F. Coleman, R.N. Zare, J. Chromatogr. 480 (1989) 95–110.
[36] T.D. Mai, H.V. Pham, P.C. Hauser, Anal. Chim. Acta 653 (2009) 228–233.