DSpace at VNU: A comparative assessment of human exposure to tetrabromobisphenol A and eight bisphenols including bisphenol A via indoor dust ingestion in twelve countries
Bạn đang xem bản rút gọn của tài liệu. Xem và tải ngay bản đầy đủ của tài liệu tại đây (1.92 MB, 9 trang )
Environment International 83 (2015) 183–191
Contents lists available at ScienceDirect
Environment International
journal homepage: www.elsevier.com/locate/envint
Full length article
A comparative assessment of human exposure to tetrabromobisphenol A
and eight bisphenols including bisphenol A via indoor dust ingestion in
twelve countries
Wei Wang a, Khalid O. Abualnaja b, Alexandros G. Asimakopoulos a, Adrian Covaci c, Bondi Gevao d,
Boris Johnson-Restrepo e, Taha A. Kumosani b, Govindan Malarvannan c, Tu Binh Minh f, Hyo-Bang Moon g,
Haruhiko Nakata h, Ravindra K. Sinha i, Kurunthachalam Kannan a,b,⁎
a
Wadsworth Center, New York State Department of Health, Department of Environmental Health Sciences, School of Public Health, State University of New York at Albany, Empire State Plaza, P.O.
Box 509, Albany, NY 12201-0509, United States
b
Biochemistry Department, Faculty of Science, Experimental Biochemistry Unit, King Fahd Medical Research Center, Bioactive Natural Products Research Group, King Abdulaziz University, Jeddah,
Saudi Arabia
c
Toxicological Center, University of Antwerp, Universiteitsplein 1, 2610 Wilrijk-Antwerp, Belgium
d
Environmental Management Program, Environment and Life Sciences Center, Kuwait Institute for Scientific Research, P.O. Box 24885, Safat, 13109, Kuwait
e
Environmental and Chemistry Group, Sede San Pablo, University of Cartagena, Cartagena, Bolívar 130015, Colombia
f
Faculty of Chemistry, Hanoi University of Science, Vietnam National University, Hanoi, 19 Le Thanh Tong, Hoan Kiem, Hanoi, Viet Nam
g
Department of Marine Sciences and Convergent Technology, College of Science and Technology, Hanyang University, Ansan, South Korea
h
Graduate School of Science and Technology, Kumamoto University, 2-39-1 Kurokami, Kumamoto 860-8555, Japan
i
Department of Zoology, Patna University, Patna 800 005, India
a r t i c l e
i n f o
Article history:
Received 20 April 2015
Received in revised form 22 June 2015
Accepted 25 June 2015
Available online xxxx
Keywords:
TBBPA
BPA
Human exposure
Indoor dust
Microenvironment
a b s t r a c t
Tetrabromobisphenol A (TBBPA) and eight bisphenol analogues (BPs) including bisphenol A (BPA) were determined in 388 indoor (including homes and microenvironments) dust samples collected from 12 countries
(China, Colombia, Greece, India, Japan, Kuwait, Pakistan, Romania, Saudi Arabia, South Korea, U.S., and
Vietnam). The concentrations of TBBPA and sum of eight bisphenols (ƩBPs) in dust samples ranged from b1 to
3600 and from 13 to 110,000 ng/g, respectively. The highest TBBPA concentrations in house dust were found
in samples from Japan (median: 140 ng/g), followed by South Korea (84 ng/g) and China (23 ng/g). The highest
∑BPs concentrations were found in Greece (median: 3900 ng/g), Japan (2600 ng/g) and the U.S. (2200 ng/g).
Significant variations in BPA concentrations were found in dust samples collected from various microenvironments in offices and homes. Concentrations of TBBPA in house dust were significantly correlated with BPA and
∑BPs. Among the nine target chemicals analyzed, BPA was the predominant compound in dust from all countries. The proportion of TBBPA in sum concentrations of nine phenolic compounds analyzed in this study was
the highest in dust samples from China (27%) and the lowest in Greece (0.41%). The median estimated daily intake (EDI) of ∑BPs through dust ingestion was the highest in Greece (1.6–17 ng/kg bw/day), Japan (1.3–16) and
the U.S. (0.89–9.6) for various age groups. Nevertheless, in comparison with the reported BPA exposure doses
through diet, dust ingestion accounted for less than 10% of the total exposure doses in China and the U.S. For
TBBPA, the EDI for infants and toddlers ranged from 0.01 to 3.4 ng/kg bw/day, and dust ingestion is an important
pathway for exposure accounting for 3.8–35% (median) of exposure doses in China.
© 2015 Elsevier Ltd. All rights reserved.
1. Introduction
Chemical concentrations in residential dust have been used as surrogates for indoor chemical exposures in many studies (Whitehead et al.,
2011; Wang et al., 2013a; Ma et al., 2014). Indoor dust is a source of
human exposure to pesticides, polychlorinated biphenyls (PCBs),
⁎ Corresponding author at: Wadsworth Center, Empire State Plaza, P.O. Box 509, Albany,
NY 12201-0509, United States.
E-mail address: (K. Kannan).
/>0160-4120/© 2015 Elsevier Ltd. All rights reserved.
polybrominated diphenyl ethers (PBDEs), phthalates, and bisphenols
(BPs) (Liao et al., 2012a; Besis and Samara, 2012; Wang et al., 2013b,
2013c, 2013d). Indoor dust is an important source of human exposure
to brominated flame retardant (BFR) such as PBDEs in North America
(Besis and Samara, 2012).
Tetrabromobisphenol A (TBBPA) is the largest production volume
BFR, with an annual global production of more than 170,000 t in 2004
and is applied as a reactive or additive FR in polymers, resins, adhesives,
and in the manufacture of printed circuit boards and electric equipment
(ECB, 2006; Ni and Zeng, 2013). TBBPA released from these products
184
W. Wang et al. / Environment International 83 (2015) 183–191
can adhere to suspended particulate matter, due to its low vapor pressure (6.24 × 10⁻⁶ Pa) and high affinity for organic surfaces (log Kow:
7.20) (European Union, 2006). TBBPA has been reported to occur in indoor dust from Belgium (0.85–1480 ng/g), Japan (490–520 ng/g), and
the UK (b 1–382 ng/g) (Geens et al., 2009; Takigami et al., 2009;
Abdallah et al., 2008); Little is known on the occurrence of TBBPA in indoor dust from other countries and on the relationship of TBBPA with
other bisphenols including BPA (Ma et al., 2014).
With the structural resemblance to the thyroid hormone, thyroxin,
TBBPA can bind to human transthyretin and disrupt thyroid hormone
functions (Covaci et al., 2009). TBBPA's potential as an endocrine
disruptor (EDC) is of concern and several studies have indicated the thyroid hormone-like and estrogen receptor-mediated effects of this compound (Kitamura et al., 2002; Ghisari and Bonefeld-Jorgensen, 2005;
Grasselli et al., 2014). TBBPA was reported as a reproductive toxicant
(Van der Ven et al., 2008). Additionally, immunotoxicity, neurotoxicity
and interference of cellular signal pathways have been reported for
TBBPA (Mariussen and Fonnuma, 2003; Pullen et al., 2003; Strack
et al., 2007). In a recent study, TBBPA-mediated uterine cancer has
been shown in rodents exposed under laboratory conditions (Dunnick
et al., 2015).
Bisphenols (BPs) are a group of chemicals with two hydroxyphenyl
functionalities and are used as additives and/or reactive raw materials
in polycarbonate plastics, plastic linings for food containers, dental sealants, and thermo-sensitive coatings for paper products among others
(Song et al., 2014). Among BPs, BPA is widely used in numerous commercial applications and has been produced at over 3,600,000 t annually
worldwide (Liao et al., 2012b). Human exposure to BPA is of concern because animal and human studies have identified potential health effects
(Liao et al., 2012a; Song et al., 2014). The Canadian Government, the
European Union and the U.S. Food and Drug Administration (FDA)
have prohibited BPA-based baby bottles/packaging in 2010, 2011 and
2012, respectively (Government of Canada, 2010; The European Commission, 2011; FDA, 2012). Owing to adverse health effects associated
with exposure to BPA and other BPs, including bisphenol S (BPS, 4,4′sulfonyldiphenol) and bisphenol F (BPF, 4,4′-dihydroxydiphenylmethane), these chemicals are under scrutiny by various global health
organizations (Zhou et al., 2014; Liao et al., 2012c).
Although diet is an important source of human exposure to contaminants such as PCBs and BPA, indoor dust contributes to a considerable
proportion of exposure to certain contaminants, especially in toddlers
(Liao et al., 2012a; Besis and Samara, 2012; Wang et al., 2013d). Contribution of dust to TBBPA exposure in humans is not well known. In light
of the above gaps in knowledge, this study was conducted to (1) report
the occurrence and profiles of TBBPA and BPs in indoor dust (home and
other microenvironments) collected from 12 countries, and (2) estimate
human exposure to TBBPA and BPs via dust ingestion.
opportunistic sampling is not expected to be representative of the country, but it can obtain a sufficient sample size in the variety of different
types of sites (homes, offices, cars, etc.) desired for the study. Floor dust
samples were obtained from vacuum cleaner bags in each of the sampling
sites following the same sampling protocol, with the exception of samples
from China and India, which were obtained by sweeping the floor. Only
bedrooms and living rooms of homes and apartments (all countries)
were selected for sampling. All samples were transported to the laboratory at Wadsworth Center, sieved through a 150 μm sieve to represent the
indoor settled dust, homogenized, packed in clean aluminum foil, and
stored at 4 °C until analysis.
2. Materials and methods
2.4. Instrumental analysis
2.1. Sample collection
The concentrations of BPs were determined with a Shimadzu Prominence LC-20 AD HPLC (Shimadzu, Kyoto, Japan) interfaced with an
Applied Biosystems API 3200 electrospray triple quadrupole mass spectrometer (ESI-MS/MS; Applied Biosystems, Foster City, CA). An analytical column (Betasil® C18, 100 × 2.1 mm column; Thermo Electron
Corporation, Waltham, MA), connected to a Javelin guard column
(Betasil® C18, 20 × 2.1 mm) was used for LC separation. TBBPA was determined with an Agilent 1260 HPLC (Agilent Technologies Inc., Santa
Clara, CA) interfaced with an Applied Biosystems QTRAP 4500 mass
spectrometer (ESI-MS/MS; Applied Biosystems, Foster City, CA). An analytical column (Ultra Biphenyl USP L11 5 μm, 100 × 2.1 mm column;
Restek Corporation, Bellefonte, PA), connected to a Javelin guard
column (Betasil® C18, 20 × 2.1 mm), was used for LC separation. The
negative ion multiple reaction monitoring (MRM) mode was used.
The MS/MS parameters were optimized by infusion of individual compounds into the MS through a flow injection system (Table S2). The
In total, 388 indoor dust samples were collected from 12 countries,
with 284 samples from homes and 104 from other microenvironments
(laboratories, offices, cars, air conditioner, and e-waste workshop)
(Table S1; Supporting Information). House dust samples (5–50 g) were
collected from select cities in China (CN, number of samples: n = 34),
U.S. (US, 22), India (IN, 35), Japan (JP, 14), Greece (GR, 28), Colombia
(CO, 42), Pakistan (PK, 22), Saudi Arabia (SA, 19), South Korea (KR, 16),
Kuwait (KW, 17), Romania (RO, 23), and Vietnam (VN, 12) from 2012
to 2014. Dust samples from laboratories, offices, cars, and public areas
were collected from South Korea (lab, n = 11; office, 14), Kuwait (car,
15), Pakistan (car, 6; office 24), Saudi Arabia (air conditioners in homes,
12; car, 10), and Vietnam (e-waste work shop, 4; public area, 8). We
employed volunteers to collect samples in each country, and these volunteers sampled sites for which they had access. This approach of
2.2. Chemicals and reagents
BPA, BPS, BPF, bisphenol Z (BPZ), bisphenol AP (BPAP), and bisphenol
AF (BPAF) were obtained from Sigma-Aldrich (St. Louis, MO). Bisphenol B
(BPB) and TBBPA were purchased from TCI America (Portland, OR)
and BOC Sciences (Shirley, NY), respectively. Mass-labeled 13C-BPA
(RING-13C12, 99%) and 13C-TBBPA (RING-13C12, 99%) were obtained
from Cambridge Isotope Laboratories (Andover, MA) and Wellington
Laboratories (Guelph, Ontario, Canada), respectively. HPLC grade methanol and tetrahydrofuran were supplied by J.T. Baker (Phillipsburg, NJ).
Ultra-pure water (18.2 Ω) was generated using a Milli-Q system
(Millipore, Billerica, MA). Sep-Pak® C18 (1 g, 6 mL) solid-phase extraction
cartridges were obtained from Waters (Milford, MA).
2.3. Sample preparation
Dust samples were extracted and analyzed by following the method
described elsewhere (Liao et al., 2012a; Song et al., 2014), with some
modifications. Briefly, 0.1 g of sample was weighed and transferred
into a 15 mL polypropylene (PP) conical tube. After spiking with 20 ng
13
C12-BPA and 13C12-TBBPA (internal standards, IS), sample was extracted with a 5 mL solvent mixture of methanol and water (5:3, v/v) by
shaking for 60 min. The mixture was centrifuged at 4500 g for 5 min
(Eppendorf Centrifuge 5804, Hamburg, Germany), and the supernatant
was transferred into a glass tube. The extraction step was repeated three
times with same amount of solvent, and the extracts were combined
and concentrated to ∼4 mL under a gentle nitrogen stream. The solution
was diluted to 10 mL with 0.2% formic acid (pH 2.5), and the extracts
were loaded onto a Sep-Pak C18 cartridge preconditioned with 5 mL
of methanol and 5 mL of water. After loading, the cartridge was washed
with 5 mL of water and the analytes were eluted with 4 mL of methanol,
3 mL of tetrahydrofuran/methanol (4:6) and 3 mL of tetrahydrofuran,
and finally concentrated to 1 mL prior to high performance liquid
chromatography-tandem mass spectrometry (HPLC-MS/MS) analysis.
W. Wang et al. / Environment International 83 (2015) 183–191
MRM transitions of ions monitored are listed in Table S3. Nitrogen was
used as both a curtain and a collision gas.
2.5. Quality assurance and quality control (QA/QC)
With each set of 20 samples analyzed, a procedural blank, a spiked
blank (containing water instead of dust), a pair of matrix spike samples
(20 ng), and duplicate samples were analyzed. Trace levels of BPA and
BPF (approximately 0.25 and 0.34 ng/g, respectively) were found in procedural blanks, and background subtraction was performed for these
compounds in the quantification of concentrations. Recoveries of BPs
in spiked matrices ranged from 78.3 ± 24.0% for BPB to 105 ± 29.5%
for BPAF (Table S3). Duplicate analysis of randomly selected samples
showed a coefficient variation of b 20% for BPs and TBBPA. The limits
of quantification (LOQs) were 0.1 ng/g for BPAF, 0.5 ng/g for BPA,
BPAP and BPZ, 1 ng/g for BPF, BPB and TBBPA, and 2.0 ng/g for BPS
and BPP (Table S3), which were calculated from the lowest acceptable
calibration standard and a nominal sample weight of 0.1 g. A midpoint
calibration standard (in methanol) was injected as a check for instrumental drift in sensitivity after every 20 samples, and a pure solvent
(methanol) was injected as a check for carry-over from sample to sample. Instrumental calibration was verified by injection of 10 calibration
standards (ranging from 0.02 to 100 ng/g), and the linearity of the calibration curve (r) was N 0.99. Concentrations of TBBPA and BPs in the
fourth extraction with a mixture of methanol and water (5:3, v/v) for
15 randomly selected dust samples were b1% of the concentrations
found in the first three extractions, which indicated that the three extraction cycles completely extracted the target chemicals. For ease of
discussion and exposure assessment, dust from homes and other microenvironments were segregated.
2.6. Calculation of exposure doses
The median and 95th percentile concentrations of the target
analytes measured in home dust were applied for the estimation of
median and high scenarios for daily intakes (EDI; ng/kg bw/day), respectively, through dust ingestion, as shown in Eq. (1)
EDI ¼
C Â DIR
BW
ð1Þ
where C is the TBBPA/BPs concentration in measured house dust (ng/g),
DIR is the dust ingestion rate (g/day), and BW is the body weight (kg). In
this study, only a limited number of samples were analyzed from offices,
cars and other public places. Therefore, only residential dust exposures
were taken into account, with median and high exposure profiles, based
on the median and the 95th percentile concentrations of the contaminants in house dust. The dust intake rate was applied as 0.03, 0.06,
0.06, 0.06, 0.03 g/d for infants (b1 year), toddlers (1–5 year), children
(6–10 year), teenagers (11–20 year) and adults (N20 year), respectively, by following the data reported elsewhere (US EPA, 2011). The
respective average body weights for infants, toddlers, children, teenagers and adults in Asian countries were 5, 19, 29, 53, and 63 kg, as reported for China (Guo and Kannan, 2011; Liao et al., 2012a), while the
values for U.S., Colombia, and European countries were 7, 15, 32, 64, and
80 kg as reported for the U.S. (US EPA, 2011). Considering the low concentrations of other bisphenol analogues, such as BPB, only the exposure
doses for BPA, BPS, BPF, ∑BPs and TBBPA were calculated in this study.
Details of the parameters used in EDI calculation are shown in Table S4.
2.7. Statistical analysis
Statistical analyses were performed with Origin ver 8 (for profile
analyses and box plot) and SPSS 16.0 software (for correlation analyses,
test for normality and ANOVA). Normality of the data was checked by
Shapiro–Wilk test. The 95% upper confidence limit (UCL) was calculated
185
using ProUCL 4.0. Concentrations below the LOQ were substituted with
a value equal to LOQ divided by the square root of 2 for the calculation of
geometric mean (GM). Differences between groups were compared
using a one-way ANOVA followed by a Tukey test. Prior to one-way
ANOVA, the data were log-transformed to meet the normality assumptions. Spearman correlation was used to investigate the relationship between BPs and TBBPA concentrations. The probability value of p ≤ 0.05
was set for statistical significance.
3. Results and discussion
3.1. TBBPA in house dust
In spite of the limited sample size for individual countries, this study
describes the widespread occurrence of TBBPA in indoor dust. TBBPA
was found in 80% of house dust samples at a concentration that ranged
from b1 to 2300 ng/g (Table 1). High concentrations of TBBPA were
found in house dust from Japan (range: 12–1400 ng/g), South Korea
(43–370 ng/g) and China (b1–2300 ng/g) and the concentrations
found in these three countries were 10 to 100 times higher than the
concentrations found in the other countries studied. Relatively lower
concentrations of TBBPA were found in dust from Colombia (b 1–280
ng/g), Romania (b1–380), Kuwait (b 1–36) and Greece (b 1–630).
In 2001, the highest TBBPA consumption was registered in Asia
(89,400 t/year) (Covaci et al., 2009). Considering the high market demand for this flame retardant in eastern Asian countries, high concentrations of TBBPA found in dust from Japan, South Korea, and China
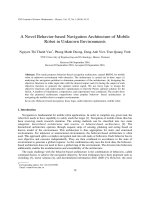
can be related to the emission from commercial products. The median
concentrations of TBBPA in house dust were in the following decreasing
order: Japan (140 ng/g) N South Korea (84) N China (23) N the U.S.
(20) N Saudi Arabia (18) N Greece (11) N India (9.0) N Kuwait
(8.4) N Pakistan (7.2) N Romania (6.0) N Colombia (3.3) N Vietnam
(1.6) (Fig. 1). In comparison with the reported median concentrations of PBDEs in indoor dust from China (median: 739–1940 ng/g)
(Kang et al., 2011), the U.S. (1910–21,000) (Johnson-Restrepo and
Kannan, 2009; Batterman et al., 2009), Kuwait (90) (Gevao et al., 2006)
and Japan (485–700) (Suzuki et al., 2006; Takigami et al., 2009), TBBPA
concentrations were significantly (one to three orders of magnitude)
lower, possibly attributing to the limited proportion (20–30%) of this
compound applied as an additive BFR in products. However, TBBPA concentrations as high as 2300 ng/g were found in dust from Chinese homes.
3.2. BPs in house dust
BPA was found in all house dust samples at concentrations that ranged
from 9.6 to 32,000 ng/g, with a global median concentration of 440 ng/g,
which was 10 to 100 times higher than that of TBBPA concentration. The
highest BPA concentration was found in dust from Japan (median: 1700
ng/g), followed by Greece (1500), the U.S. (1500) and South Korea
(720) (Fig. 1). Besides BPA, BPS and BPF were also found widely in dust
samples, collectively accounting for, on average, 45% of ∑BPs concentrations. This profile was similar to those reported previously for indoor dust
from the U.S., Japan, South Korea and China (Liao et al., 2012a). High concentrations of BPF found in dust from South Korea (median: 1000 ng/g),
Greece (780), Japan (230), and the U.S. (200) indicated high usage of
this BP analogue in these countries. BPF has been reported as a major alternative to BPA in industrial applications in South Korea (Lee et al.,
2015). BPP (detection frequency: 0.34%), BPAF (73%), and BPAP (0.68%)
were also found in some dust samples, but their concentrations were
very low. The concentrations of ∑BPs in house dust from the 12 countries investigated, were in the following decreasing order: Greece (range
510–110,000; median 3900 ng/g), Japan (360–12,000; 2600), the U.S.
(550–89,000; 2200), South Korea (540–6100, 1600), Saudi Arabia
(130–3200, 1200), Romania (37–6000, 870), Vietnam (66–1600, 400),
Kuwait (61–1400, 380), China (43–4400, 350), India (40–6200, 180),
Colombia (42–2300, 180) and Pakistan (23–860, 150).
186
W. Wang et al. / Environment International 83 (2015) 183–191
Table 1
TBBPA and BP concentrations in house dust (ng/g) from 12 countries.
China
n = 34
Colombia
n = 42
Greece
n = 28
India
n = 35
Japan
n = 14
South Korea
n = 16
Kuwait
n = 17
Pakistan
n = 22
Romania
n = 23
Saudi Arabia
n = 19
U.S.
n = 22
Vietnam
n = 12
Total
n = 284
a
Mean
Median
Min
Max
DRa%
Mean
Median
Min
Max
DR%
Mean
Median
Min
Max
DR%
Mean
Median
Min
Max
DR%
Mean
Median
Min
Max
DR%
Mean
Median
Min
Max
DR%
Mean
Median
Min
Max
DR%
Mean
Median
Min
Max
DR%
Mean
Median
Min
Max
DR%
Mean
Median
Min
Max
DR%
Mean
Median
Min
Max
DR%
Mean
Median
Min
Max
DR%
Mean
Median
Min
Max
DR%
BPF
BPA
BPB
BPS
BPZ
BPAP
BPAF
BPP
∑BPs
TBBPA
1.9
b1
b1
13
53
69
33
b1
780
90
5500
780
b1
110,000
82
29
6.7
b1
290
77
650
230
b1
2900
93
1300
1000
13
3600
100
78
22
b1
390
89
56
50
5.6
140
100
41
2.0
b1
340
61
160
73
5.5
1500
100
4400
200
39
89,000
100
200
57
b1
1500
92
1000
36
b1
110,000
83
670
330
37
4400
100
420
120
9.6
2000
100
1700
1500
27
4400
100
360
130
20
6200
100
2800
1700
250
10,000
100
1100
720
270
3600
100
390
250
39
1200
100
100
66
9.7
710
100
680
600
18
1700
100
1100
650
110
3200
100
3800
1500
260
32,000
100
330
230
27
1400
100
1000
440
9.6
32,000
100
b1
b1
b1
4.6
6
b1
b1
b1
b1
–
b1
b1
b1
b1
–
b1
b1
b1
b1
–
b1
b1
b1
b1
–
b1
b1
b1
b1
–
b1
b1
b1
b1
–
b1
b1
b1
b1
–
b1
b1
b1
b1
–
b1
b1
b1
b1
–
1.1
b1
b1
8.4
5
b1
b1
b1
b1
–
b1
b1
b1
8.4
1
b2
b2
b2
b2
–
3.7
2.4
b2
35
62
1500
860
b2
21,000
86
12
4.2
b2
150
60
440
160
8.8
1800
100
8.8
3.6
b2
32
50
38
20
b2
200
68
10
1.8
b2
66
50
380
82
6.2
4900
100
110
28
b2
1100
63
2.1
b2
b2
12
18
28
b2
b2
260
33
220
3.2
b2
21,000
100
b0.5
b0.5
b0.5
b0.5
–
b0.5
b0.5
b0.5
b0.5
–
b0.5
b0.5
b0.5
b0.5
–
b0.5
b0.5
b0.5
b0.5
–
b0.5
b0.5
b0.5
b0.5
–
b0.5
b0.5
b0.5
b0.5
–
b0.5
b0.5
b0.5
b0.5
–
b0.5
b0.5
b0.5
b0.5
–
b0.5
b0.5
b0.5
b0.5
–
b0.5
b0.5
b0.5
b0.5
–
b0.5
b0.5
b0.5
b0.5
–
b0.5
b0.5
b0.5
b0.5
–
b0.5
b0.5
b0.5
b0.5
–
b0.5
b0.5
b0.5
b0.5
–
b0.5
b0.5
b0.5
b0.5
–
b0.5
b0.5
b0.5
b0.5
–
b0.5
b0.5
b0.5
b0.5
–
b0.5
b0.5
b0.5
b0.5
–
b0.5
b0.5
b0.5
b0.5
–
b0.5
b0.5
b0.5
b0.5
–
b0.5
b0.5
b0.5
b0.5
–
b0.5
b0.5
b0.5
b0.5
–
b0.5
b0.5
b0.5
b0.5
–
0.5
b0.5
b0.5
3.4
5
0.7
b0.5
b0.5
4.5
8
0.38
b0.5
b0.5
4.5
1
4.4
1.9
0.8
54
100
4.3
2.2
0.07
34
98
4.6
2.5
b0.1
47
79
1.7
1.5
b0.1
6.5
83
4.8
4.1
0.88
14
100
2.6
3.0
b0.1
5.6
94
3.2
2.5
0.38
13
100
1.3
1.3
b0.1
2.9
77
0.88
0.39
b0.1
5.2
74
2.5
2.2
b0.1
6.7
89
4.7
1.4
0.23
25
100
1.3
1.1
b0.1
2.9
92
3.1
1.8
b0.1
54
73
b2
b2
b2
9.4
3
b2
b2
b2
b2
–
b2
b2
b2
b2
–
b2
b2
b2
b2
–
b2
b2
b2
b2
–
b2
b2
b2
b2
–
b2
b2
b2
b2
–
b2
b2
b2
b2
–
b2
b2
b2
b2
–
b2
b2
b2
b2
–
b2
b2
b2
b2
–
b2
b2
b2
b2
–
b2
b2
b2
9.4
–
690
350
43
4400
100
500
180
42
2300
100
8800
3900
510
110,000
100
410
180
40
6200
100
3900
2600
360
12,000
100
2400
1600
540
6100
100
520
380
61
1400
100
170
150
23
860
100
1100
870
37
6000
100
1400
1200
130
3200
100
8300
2200
550
89,000
100
560
400
66
1600
100
2200
610
23
110,000
100
250
23
b1
2300
79
21
3.3
b1
280
76
36
11
b1
630
68
45
9.0
b1
640
86
360
140
12
1400
100
130
84
43
370
100
12
8.4
b1
36
89
50
7.2
b1
800
77
28
6.0
b1
380
81
61
18
b1
360
84
91
20
b1
650
77
99
1.6
b1
670
50
87
9.5
b1
2300
80
DR = detection rate.
3.3. TBBPA and BPA in various microenvironments and comparison of
results with other studies
The concentrations and profiles of TBBPA and BPs in dust from various microenvironments are shown in Table S5 and Fig. 2, respectively.
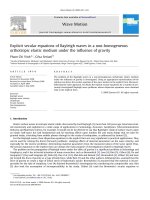
The concentrations of TBBPA in dust from laboratories and offices
from South Korea (65–660 ng/g) were significantly (p b 0.05) higher
than those in homes (43–370 ng/g). Similarly, significantly (p b 0.05)
higher BPA concentrations were found in dust from offices (510–
6600 ng/g) and laboratories (980–27,000 ng/g) than homes
W. Wang et al. / Environment International 83 (2015) 183–191
187
Fig. 1. Worldwide distribution of TBBPA and BPA (median values) in house dust from 12 countries.
Fig. 2. Comparison of TBBPA (A) and BPA (B) concentrations in indoor dust from various
microenvironments (KRH, KRL, KRO-Home, laboratory and office dust from South
Korea; KWC and KWH-Car and home dust from Kuwait; PKC, PKR, PKU and PKO-Car,
rural home, urban home and office dust from Pakistan; SAA, SAC and SAH-Air conditioner,
car and home dust from Saudi Arabia; VNE, VNH and VNP-E-waste work shop, home and
public area dust from Vietnam. The box represented 25–75 percentiles, the whiskers were
10th and 90th percentiles, the lowest and highest circles were the minimum and maximum, and line inside the box showed the median).
(270–3600 ng/g) in South Korea. Our results are similar to those
found for house and office dust from Belgium, with the concentrations in office dust (median: BPA 6530, TBBPA 75 ng/g) 5–10 times
higher than those in house dust (median: BPA 1460, TBBPA 10 ng/g)
(Geens et al., 2009). The use of TBBPA and BPA in electrical and electronic
equipment in offices is an explanation for the elevated concentrations of
these chemicals in offices. However, dust samples from Pakistan did not
show a significant difference in TBBPA and BPA concentrations between
offices and homes. Harrad et al. found significantly higher concentrations
of TBBPA in dust from classrooms (n = 43) and homes (n = 45) than in
offices (n = 28) and cars (n = 20) (Abdallah et al., 2008). The nature and
magnitude of indoor products, ventilation, and residential settings can
contribute to variations in emissions of TBBPA and BPA. No significant
difference was found for BPA and TBBPA concentrations between dust
samples collected from homes and air conditioners in Saudi Arabia. No
significant difference was found for TBBPA concentrations in dust collected from cars and homes in Pakistan (median: car dust 28, house dust
7.2 ng/g) and Kuwait (median: car dust 6.7, house dust 8.4 ng/g). BPA
concentrations in house dust from rural homes (range: b0.5–29 ng/g)
in Pakistan were significantly lower than those in urban (b0.5–800 ng/g)
homes, which can be attributed to lifestyles including consumer products
usage. However, TBBPA concentrations in dust collected in urban
homes were not significantly different from those in rural homes in
Pakistan. These results suggest differences in the sources of BPA and
TBBPA in dust. The highest TBBPA concentrations were found in dust
from e-waste workshops in Vietnam, with TBBPA concentrations that
ranged from 23 to 3600 ng/g; these values were significantly (p b 0.05)
higher than those found for dust from homes and public areas in Vietnam.
A summary of median and range of concentrations for TBBPA and
BPA in indoor dust analyzed in this study and those reported in earlier
studies is shown in Fig. S1. The concentrations of TBBPA measured in
house dust for various countries in this study were similar to those
reported in earlier studies: the U.S. (b10–3400 ng/g, sampling year:
2006/2011) (Dodson et al., 2012), Japan (495–520 ng/g, 2006)
(Takigami et al., 2009), the UK (b MQL-382 ng/g, 2007) (Abdallah
et al., 2008) and Belgium (0.85–1481 ng/g, 2008) (Geens et al., 2009).
The concentrations of TBBPA determined in office dust in this study
were higher than those reported in the UK (bMQL-140 ng/g, 2007)
188
W. Wang et al. / Environment International 83 (2015) 183–191
(Abdallah et al., 2008) and Belgium (45–100 ng/g, 2008) (Geens et al.,
2009). For BPA, the concentrations determined in house dust from
Japan were similar to those reported previously (496–12,300 ng/g,
2010) (Liao et al., 2012a). BPA concentrations found in dust from
office and laboratories were within the ranges reported from Belgium
(4685–8380 ng/g, 2008), China (117–3490, 2010), Japan (11,400–
21,800, 2010), South Korea (2310–39,100, 2010) and the U.S.
(445–2950, 2006/2010) (Geens et al., 2009; Loganathan and Kannan,
2011; Liao et al., 2012a).
3.4. Correlations and profiles
A significant (p b 0.05), but weak correlation (r = 0.27) was found
between TBBPA and BPA concentrations in 284 house dust samples
(only house dust samples were compared here) (Table S6), indicating
the existence of multiple sources. An earlier study reported that
TBBPA concentrations in dust samples were not correlated with BPA
concentrations (Geens et al., 2009). No significant correlation was
found between TBBPA and BPF/BPS concentrations, which suggests differences in sources and emissions of these compounds. A significant
correlation was found between BPA and BPS (p b 0.05, r = 0.21), and
between BPA and BPF (p b 0.05, r = 0.17).
The contribution of each of the target compounds to the sum concentrations of all nine target chemicals analyzed in dust is presented in Fig. 3.
BPA accounted for 64 ± 22% of the total concentrations. TBBPA accounted
for 27% of the total concentrations in dust from China, followed by
Pakistan (22%) N Vietnam (15%) N India (10%) N Japan (8.4%) N South
Korea (5.2%) N Saudi Arabia (4.4%) N Colombia (4.0%) N Romania
(2.4%) N Kuwait (2.3%) N the U.S. (1.1%) N Greece (0.41%). The proportion
of BPF and BPS to the total concentrations in house dust from the U.S.,
Fig. 3. Composition profiles of TBBPA and BPs in house dust from 12 countries (A) and indoor dust from various microenviroments (B) (KRL, KRO-Laboratory and office dust from
South Korea; KWC-Car dust from Kuwait; PKC, PKO-Car and office dust from Pakistan;
SAC-Car dust from Saudi Arabia; VNE, VNP-E-waste work shop, and public area dust
from Vietnam).
South Korea, and Greece was higher than in other countries, indicating
a greater usage of BPF and BPS in resin coatings and polycarbonate plastics
in these countries (Lee et al., 2015) and hence the market shift from BPA
to its alternatives. The contribution of BPF was elevated in office dust in
South Korea than in home dust. These results agree with elevated concentrations of BPF found in sewage sludge from South Korea (Lee et al., 2015),
which suggested high usage of BPF in that country. The proportion of
TBBPA was elevated in dust from e-waste workshop in Vietnam, which
can explain that electronic products are the sources of this chemical in
dust. TBBPA/BPA ratios in home dust from Asian countries (0.12–0.48)
were considerably higher than those found for Greece and the U.S.
(0.02), which suggests differences in contamination profiles among
various countries. Principal Component Analysis (PCA) was carried out
on house dust samples from each country to identify patterns in their concentrations (Table S7). Two principal components were identified based
on the component matrix (except for Kuwait), and TBBPA and BPA
were identified with similar potential origin in China, Columbia, India
and Greece, while with varied sources in Japan, Pakistan and Romania.
Furthermore, BPF and BPAF explained the predominance of total variance
for samples from Korea.
3.5. Exposure assessment
The sources and pathways of human exposure to TBBPA are not well
known (Covaci et al., 2009). We estimated daily intake (EDI) dose for
TBBPA and BPs via dust ingestion for different age groups. Since the
number of samples collected from offices, cars and other microenvironments is small, data collected only for residential homes were taken into
account for exposure calculation. Median and high exposure scenarios
were assessed for BPA, BPS, BPF, ∑ BPs and TBBPA based on median
and 95th percentile concentrations of the target contaminants determined in home dust. Because of the low frequency of detection of
other BPs, they were not included in the calculation.
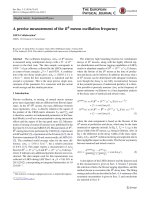
The median EDIs of TBBPA and BPA through dust ingestion have
been summarized in Fig. 4. Further details (median and 95UCL) of
EDIs for BPS, BPF, and ∑ BPs are shown in Fig. S2 and Table S8. The
highest exposure dose was found for toddlers, which can be explained
by the high dust ingestion rate and the low body weight. The highest
EDI was found for BPA in all 12 countries, except for South Korea and
Greece where BPS and BPF showed highest EDIs. The highest exposure
doses of ∑ BPs were found for the U.S. (median, high: 0.89–9.6, 6.2–
66 ng/kg bw/day) and Greece (1.6–17, 6.2–67), whereas the lowest intakes were found for Pakistan (0.07–0.88, 0.12–1.5), Kuwait (0.19–2.3,
0.34–4.1), Romania (0.35–3.8, 0.57–6.2), and India (0.09–1.1, 0.35–
4.2). The overall median EDI of BPA was estimated to be 0.4–10, 0.21–
5.3, 0.14–3.6, 0.07–1.9, and 0.03–0.85 ng/kg bw/day for infants, toddlers, children, teenagers, and adults, respectively.
The daily dietary intakes of BPA and BPs in the U.S. (calculated from
the mean concentration of foods from the U.S.) were reported to be 195,
243; 114, 142; 91.2, 117; 48.6, 63.6; and 44.6, 58.6 ng/kg bw/day for
toddlers, infants, children, teenagers, and adults, respectively (Liao
and Kannan, 2013). Lorber et al. (2015) reported the dietary BPA intake
at 12.6 ng/kg/day for the U.S. population, with canned food accounting
for a majority of the exposure dose. Based on the 2005–2006 U.S.
NHANES data for the urinary levels of BPA, the total daily intake of
BPA was estimated at 35.1 ng/kg/day (Lakind and Naiman, 2011).
Similarly, the daily dietary intakes of BPs in China were 646 and
664 ng/kg bw/day for adult men and women, respectively (Liao and
Kannan, 2014). In comparison with the median intake doses for BPs estimated via dust ingestion in the U.S. and China, diet contributes N 90% of
the daily intake of BPs. Our results suggest that dust ingestion is a minor
contributor to total BPA exposure in the U.S., and the EDI values are
much lower than the oral reference dose for BPA (50 μg/kg bw/day)
(US EPA, 2008). This finding agrees well with the report that diet
accounted for N 90% of the total daily BPA intake in human populations
(Geens et al., 2012), potentially from the usage of BPA in epoxy can
W. Wang et al. / Environment International 83 (2015) 183–191
189
Fig. 4. Median levels of Estimated Daily Intakes (EDI, ng/kg bw/day) of TBBPA and BPA from house dust ingestion for different age groups in 12 countries.
linings for foods (Guo and Kannan, 2011). In this study, a high exposure
dose for BPS via dust ingestion was found for Greece (median 0.34–3.7;
high 1.1–12 ng/kg bw/day) and Japan (median 0.08–0.96; high 0.35–
4.3 ng/kg bw/day). Liao et al. (2012b) also found high BPS concentrations in urine from Japanese populations (0.10–15.3, with a mean of
3.47 μg/day). Japan banned the use of BPA in certain products (such as
thermal receipt papers) in 2001 and BPS was used as a replacement
since then (Liao et al., 2012b).
Dust is an important source of chemical exposures for young
children because of frequent hand-to-mouth contact. For TBBPA, the
highest EDI was found for infants and toddlers in Japan (median: 0.82,
0.43 ng/kg bw/day), South Korea (0.50, 0.26), and China (0.14, 0.07),
and the estimated values for these three countries were 10 times higher
than those found for other countries. At high exposure scenario (95th
percentile), the EDIs of TBBPA were the highest for infants and toddlers
in China (2.5, 1.3 ng/kg bw/day), Japan (3.4, 1.8) and South Korea (1.1,
0.56), which were up to 100 times higher than those estimated for
other countries. In general, the overall EDIs of TBBPA ranged from 0.01
to 3.4; 0.01 to 1.8; 0.01 to 1.2; 0.003 to 0.61; 0.001 to 0.28 ng/kg bw/
day for infants, toddlers, children, teenagers, and adults, respectively,
in this study.
The reported TBBPA exposure via dust ingestion for adults in
Belgium was 0.0128 to 0.0286 ng/kg bw/day from home dust and
0.0417 ng/kg/day from office dust (Geens et al., 2009). The median exposure dose of TBBPA for UK adults via the dust ingestion was
0.002 ng/kg bw/day (Abdallah et al., 2008). In China, the average exposure dose to TBBPA via PM2.5 and PM10 inhalation was 0.0462 ng/kg bw/
day for adults (Ni and Zeng, 2013). Assuming that TBBPA concentrations
in indoor dust from China were similar to those in airborne particulate
matter, the contributions of dust ingestion, inhalation, and diet to
TBBPA intake were estimated to be ~76%, ~4%, and ~20% for adults (Ni
and Zeng, 2013). TBBPA exposure via dietary intake in China was reported
to range from 0.032 to 1.3 ng/kg bw/day, with a mean value of
0.256 ng/kg bw/day (Shi et al., 2009). In our study, the median exposure
doses for TBBPA via dust ingestion in China ranged from 0.01 to
0.14 ng/kg bw/day for the five age groups, which were 3.8–35% of the
total TBBPA exposures. In Japan, the daily exposure dose for TBBPA via
dust ingestion was estimated to range from 2.0 to 4.0 ng/kg bw/day for
children and 0.035 to 0.46 ng/kg bw/day for adults (Takigami et al.,
2009). Takigami et al. (2009) concluded that dust ingestion was an important contributor to TBBPA exposure in Japan. In our study, the TBBPA
exposure doses calculated for Japanese children and adults ranged in
0.29–1.2 and 0.07–0.28 ng/kg bw/day, respectively. TBBPA exposure
doses calculated via dust ingestion for Greece (median EDI: 0.004–
0.05 ng/kg bw/day; high EDI: 0.055–0.59 ng/kg bw/day) were higher
than the reported dietary intake estimates for the Netherlands
(0.04 ng/kg bw/day) (Abdallah et al., 2008). Abdallah et al. (2008)
reported that dust ingestion accounted for 34% and 90% of the total
TBBPA exposures for adults and toddlers in the UK, respectively. Geens
et al. (2009) reported that 7% of the total daily intakes of TBBPA for adults
and 56% of the intake for toddlers in Belgium originated from dust ingestion. Thus, dust ingestion is an important pathway for human exposure to
TBBPA whereas diet is the major source of BPs exposures. Considering the
limited data available for the assessment of exposure to TBBPA, future
work should focus dietary and inhalation sources of exposures.
To compare exposures from various microenvironments (Table S9,
Fig. S3), the exposure estimates were calculated based on a typical
activity pattern as described previously, i.e., 63.8% home, 22.3% office,
and 4.1% car for adults (Klepeis et al., 2001; U.S. EPA, 2002). Exposure
doses of TBBPA, BPA and BPF from offices were higher than those in
houses, and laboratories, based on data for samples from Korea. The
exposure doses for BPA, BPF, BPS and TBBPA were lower based on
data obtained for dust from cars, compared to households in Pakistan,
Saudi Arabia and Kuwait, which can be explained by low exposure
190
W. Wang et al. / Environment International 83 (2015) 183–191
fraction. A significantly higher exposure dose for TBBPA was found in
e-waste workshop than homes in Vietnam, which can be attributed to
the elevated contamination levels.
4. Conclusions
In summary, TBBPA and BPA were detected in N 80% of the 388
indoor dust samples collected from 12 countries, indicating widespread
occurrence of these phenolic compounds in the indoor environment.
The highest TBBPA exposures were found in house dust collected
from China, Japan, and South Korea which can be explained by high
consumption/production in Asian countries; whereas the highest BPA
exposures were found in the U.S., Greece, and Japan. The ratios of
TBBPA/BPA were higher in house dust from China (0.37), Pakistan
(0.48), Vietnam (0.30), India (0.12) and Japan (0.13), than in Greece
(0.02) and the U.S. (0.02), which suggested differences in contamination profiles and sources for these two chemicals among countries. Concentration profiles of TBBPA and BPs varied among several indoor
microenvironments. The contribution of dust to daily intakes of TBBPA
and BPA varied. For BPA, dust ingestion accounted for a minor (b 10%)
proportion of EDI in countries such as China and the U.S., in comparison
with the dietary sources. However, dust ingestion is an important
pathway for TBBPA exposure, accounting for 3.8–35% (median intake
scenario) of exposure in China. However, the number of samples
collected from each country was limited and comprehensive sampling
strategies are needed in the future.
Acknowledgments
Pierina Maza-Anaya, a youth research follow, supported by
Colciencias, helped in the collection of dust samples from Colombia; Dr.
Dilip Kumar Kedia, Patna University, helped in the collection of dust samples from India. This study was funded by a grant (1U38EH000464-01)
from the Centers for Disease Control and Prevention (CDC, Atlanta, GA)
to Wadsworth Center, New York State Department of Health. Its contents
are solely the responsibility of the authors and do not necessarily represent the official views of the CDC.
Appendix A. Supplementary data
Supporting information for this article includes additional details
of methods as well as samples (Table S1), instrument parameters
(Table S2), summary statistics for LOQs (Table S3), exposure analyses
parameters (Table S4), correlation analyses (Table S6) and compound
specific exposure estimates (Table S8). Plots of worldwide data for
TBBPA and BPA and EDI estimates for compound specific exposure
are contained therein.
References
Abdallah, M.A., Harrad, S., Covaci, A., 2008. Hexabromocyclododecanes and
tetrabromobisphenol-A in indoor air and dust in Birmingham, UK: implications for
human exposure. Environ. Sci. Technol. 42, 6855–6861.
Batterman, S., Chernyak, S., Jia, C., Godwin, C., Charles, S., 2009. Concentrations and emissions of polybrominated diphenyl ethers from U.S. Houses and Garages. Environ. Sci.
Technol. 43, 2693–2700.
Besis, A., Samara, C., 2012. Polybrominated diphenyl ethers (PBDEs) in the indoor and
outdoor environments—a review on occurrence and human exposure. Environ.
Pollut. 169, 217–229.
Covaci, A., Voorspoels, S., Abdallah, M.A., Geens, T., Harrad, S., Law, R.J., 2009. Analytical
and environmental aspects of the flame retardant tetrabromobisphenol-A and its derivatives. J. Chromatogr. A 1216, 346–363.
Dodson, R.E., Perovich, L.J., Covaci, A., Van den Eede, N., Ionas, A.C., Dirtu, A.C., Brody, J.G.,
Rudel, R.A., 2012. After the PBDE phase-out: a broad suite of flame retardants in repeat house dust samples from California. Environ. Sci. Technol. 46, 13056–13066.
Dunnick, J.K., Sanders, J.M., Kissling, G.E., Johnson, C.L., Boyle, M.H., Elmore, S.A., 2015.
Environmental chemical exposure may contribute to uterine cancer development: studies with tetrabromobisphenol A. Toxicol. Pathol. 43, 464–473.
ECB, 2006. European union risk assessment report. 2,20,6,60-Tetrabromo-4,40isopropylidenediphenol (tetrabromobisphenol-A or TBBP-A). Part II — human health.
In: E.C.B. European Commission Directrate-General Joint Research Center, Institute
for Health and Consumer Protection (Eds.), European Union Risk Assessment Report.
European Chemicals Bureau, United Kingdom.
European Union, 2006. Risk Assessment Report TBBP-A, Part II-Human Health.
FDA, 2012. Bisphenol A (BPA): Use in Food Contact Application. Food and Drug
Administration.
Geens, T., Roosens, L., Neels, H., Covaci, A., 2009. Assessment of human exposure to
bisphenol-A, triclosan and tetrabromobisphenol-A through indoor dust intake in
Belgium. Chemosphere 76, 755–760.
Geens, T., Aerts, D., Berthot, C., Bourguignon, J.P., Goeyens, L., Lecomte, P., MaghuinRogister, G., Pironnet, A.M., Pussemier, L., Scippo, M.L., Loco, J.V., Covaci, A., 2012. A
review of dietary and non-dietary exposure to bisphenol-A. Food Chem. Toxicol. 50,
3725–3740.
Gevao, B., Al-Bahloul, M., Al-Ghadban, A.N., Al-Omair, A., Ali, L., Zafar, J., Helaleh, M., 2006.
House dust as a source of human exposure to polybrominated diphenyl ethers in
Kuwait. Chemosphere 64, 603–608.
Ghisari, M., Bonefeld-Jorgensen, E.C., 2005. Impact of environmental chemicals on the
thyroid hormone function in pituitary rat GH3 cells. Mol. Cell. Endocrinol. 244, 31–41.
Government of Canada, 2010. Order Amending Schedule I to the Hazardous Products Act
(bisphenol A), Part II Vol. 144, No. 7. Government of Canada (http://www.
chemicalsubstanceschimiques.gc.ca/challenge-defi/batch-lot-2/bisphenol-a/bparisk_hazard-eng.php).
Grasselli, E., Cortese, K., Fabbri, R., Smerilli, A., Vergani, L., Voci, A., Gallo, G., Canesi, L.,
2014. Thyromimetic actions of tetrabromobisphenol A (TBBPA) in steatotic FaO rat
hepatoma cells. Chemosphere 112, 511–518.
Guo, Y., Kannan, K., 2011. Comparative assessment of human exposure to phthalate esters
from house dust in China and the United States. Environ. Sci. Technol. 45, 3788–3794.
Johnson-Restrepo, B., Kannan, K., 2009. An assessment of sources and pathways of human
exposure to polybrominated diphenyl ethers in the United States. Chemosphere 76,
542–548.
Kang, Y., Wang, H.S., Cheung, K.C., Wong, M.H., 2011. Polybrominated diphenyl ethers
(PBDEs) in indoor dust and human hair. Atmos. Environ. 45, 2386–2393.
Kitamura, S., Jinno, N., Ohta, S., Kuroki, H., Fujimoto, N., 2002. Thyroid hormonal activity of
the flame retardants tetrabromobisphenol A and tetrachlorobisphenol A. Biochem.
Biophys. Res. Commun. 293, 554–559.
Klepeis, N.E., Nelson, W.C., Ott, W.R., Robinson, J.P., Tsang, A.M., Switzer, P., Behar, J.V.,
Hern, S.C., Engelmann, W.H., 2001. The National Human Activity Pattern Survey
(NHAPS): a resource for assessing exposure to environmental pollutants. J. Expo.
Sci. Environ. Epidemiol. 11, 231–252.
Lakind, J.S., Naiman, D.Q., 2011. Daily intake of bisphenol A and potential sources of
exposure: 2005–2006 National Health and Nutrition Examination Survey. J. Expo.
Sci. Environ. Epidemiol. 21, 272–279.
Lee, S., Liao, C., Song, G.J., Ra, K., Kannan, K., Moon, H.-B., 2015. Emission of bisphenol
analogues including bisphenol A and bisphenol F from wastewater treatment plants
in Korea. Chemosphere 119, 1000–1006.
Liao, C., Kannan, K., 2013. Concentrations and profiles of bisphenol A and other bisphenol
analogues in foodstuffs from the United States and their implications for human
exposure. J. Agric. Food Chem. 61, 4655–4662.
Liao, C., Kannan, K., 2014. A survey of bisphenol A and other bisphenol analogues in foodstuffs from nine cities in China. Food Addit. Contam., Part A 31, 319–329.
Liao, C., Liu, F., Guo, Y., Moon, H.-B., Nakata, H., Wu, Q., Kannan, K., 2012a. Occurrence
of eight bisphenol analogues in indoor dust from the United States and several
Asian countries: implications for human exposure. Environ. Sci. Technol. 46,
9138–9145.
Liao, C., Liu, F., Alomirah, H., Loi, V.D., Mohd, M.A., Moon, H.-B., Nakata, H., Kannan, K.,
2012b. Bisphenol S in urine from the United States and seven Asian countries: occurrence and human exposures. Environ. Sci. Technol. 46, 6860–6866.
Liao, C., Liu, F., Kannan, K., 2012c. Bisphenol S, a new bisphenol analogue, in paper
products and currency bills and its association with bisphenol A residues. Environ.
Sci. Technol. 46, 6515–6522.
Loganathan, S.N., Kannan, K., 2011. Occurrence of bisphenol A in indoor dust from two
locations in the eastern United States and implications for human exposures. Arch.
Environ. Contam. Toxicol. 61, 68–73.
Lorber, M., Schecter, A., Paepke, O., Shropshire, W., Christensen, K., Birnbaum, L., 2015.
Exposure assessment of adult intake of bisphenol A (BPA) with emphasis on canned
food dietary exposures. Environ. Int. 77, 55–62.
Ma, W.L., Subedi, B., Kannan, K., 2014. The occurrence of bisphenol A, phthalates,
parabens and other environmental phenolic compounds in house dust: a review.
Curr. Org. Chem. 18, 2182–2199.
Mariussen, E., Fonnuma, F., 2003. The effect of brominated flame retardants on neurotransmitter uptake into rat brain synaptosomes and vesicles. Neurochem. Int. 43, 533–542.
Ni, H.G., Zeng, H., 2013. HBCD and TBBPA in particulate phase of indoor air in Shenzhen,
China. Sci. Total Environ. 458–460, 15–19.
Pullen, S., Boecker, R., Tiegs, G., 2003. The flame retardants tetrabromobisphenol A and
tetrabromobisphenol A-bisallylether suppress the induction of interleukin-2 receptor
alpha chain (CD25) in murine splenocytes. Toxicology 184, 11–22.
Shi, Z.X., Wu, Y.N., Li, J.G., Zhao, Y.F., Feng, J.F., 2009. Dietary exposure assessment of Chinese
adults and nursing infants to tetrabromobisphenol-a and hexabromocyclododecanes:
occurrence measurements in foods and human milk. Environ. Sci. Technol. 43,
4314–4319.
Song, S.J., Song, M.Y., Zeng, L.Z., Wang, T., Liu, R., Ruan, T., Jiang, G., 2014. Occurrence and
profiles of bisphenol analogues in municipal sewage sludge in China. Environ. Pollut.
186, 14–19.
Strack, S., Detzel, T., Wahl, M., Kuch, B., Krug, H.F., 2007. Cytotoxicity of TBBPA and effects
on proliferation, cell cycle and MAPK pathways in mammalian cells. Chemosphere
67, 405–411.
W. Wang et al. / Environment International 83 (2015) 183–191
Suzuki, G., Nose, K., Takigami, H., Takahashi, S., Sakai, S.-I., 2006. PBDEs and PBDD/Fs in
house and office dust from Japan. Organohalogen Compd. 68, 1843–1846.
Takigami, H., Suzuki, G., Hirai, Y., Sakai, S.I., 2009. Brominated flame retardants and other
polyhalogenated compounds in indoor air and dust from two houses in Japan.
Chemosphere 76, 270–277.
The European Commission, 2011. Commission Directive 2011/8/EU of 28 January 2011
Amending Directive 2002/72/EC as Regards the Restriction of Use of Bisphenol A in
Plastic Infant Feeding Bottles. Official Journal of the European Union.
US EPA, 2002. Child-Specific Exposure Factors Handbook, EPA-600-P-00-002B. National
Center for Environmental Assessment, Washington, DC.
US EPA, 2008. Child-specific Exposure Factors Handbook, EPA/600/R-06/096 F. National
Center for Environmental Assessment, Office of Research and Development,
Washington, DC ( />US EPA, 2011. Exposure Factors Handbook. United States Environmental Protection Agency
(link is: />Van der Ven, L.T., Van de Kuil, T., Verhoef, A., Verwer, C.M., Lilienthal, H., Leonards, P.E., et
al., 2008. Endocrine effects of tetrabromobisphenol-A (TBBPA) in Wistar rats as
tested in a one-generation reproduction study and a subacute toxicity study. Toxicology 245, 76–89.
Wang, W., Huang, M.J., Chan, C.Y., Cheung, K.C., Wong, M.H., 2013a. Risk assessment of
non-dietary exposure to polycyclic aromatic hydrocarbons (PAHs) via PM2.5,
191
TSP and dust in home and the implications from human hair. Atmos. Environ. 73,
204–213.
Wang, W., Huang, M.J., Wu, F.Y., Kang, Y., Wang, H.S., Cheung, K.C., Wong, M.H., 2013b.
Risk assessment of bioaccessible organochlorine pesticides exposure via indoor and
outdoor dust. Atmos. Environ. 77, 525–533.
Wang, W., Huang, M.J., Zheng, J.S., Cheung, K.C., Wong, M.H., 2013c. Exposure assessment
and distribution of polychlorinated biphenyls (PCBs) contained in indoor and outdoor dusts and the impacts of particle size and bioaccessibility. Sci. Total Environ.
463–464, 1201–1209.
Wang, W., Wu, F.Y., Huang, M.J., Kang, Y., Cheung, K.C., Wong, M.H., 2013d. Size fraction
effect on phthalate esters accumulation, bioaccessibility and in vitro cytotoxicity of
indoor/outdoor dust, and risk assessment of human exposure. J. Hazard. Mater.
261, 753–762.
Whitehead, T., Metayer, C., Buffler, P., Rappaport, S.M., 2011. Estimating exposures to
indoor contaminants using residential dust. J. Expo. Sci. Environ. Epidemiol. 21,
549–564.
Zhou, X., Kramer, J.P.K., Calafat, A.M., Ye, X.Y., 2014. Automated on-line column-switching
high performance liquid chromatography isotope dilution tandem mass spectrometry
method for the quantification of bisphenol A, bisphenol F, bisphenol S, and 11 other phenols in urine. J. Chromatogr. B 944, 152–156.