DSpace at VNU: Sedimentation in an estuarine mangrove system
Bạn đang xem bản rút gọn của tài liệu. Xem và tải ngay bản đầy đủ của tài liệu tại đây (1.04 MB, 10 trang )
Journal of Asian Earth Sciences 29 (2007) 566–575
www.elsevier.com/locate/jaes
Sedimentation in an estuarine mangrove system
P. Van Santen a,¤, P.G.E.F. Augustinus a, B.M. Janssen-Stelder b, S. Quartel a, N.H. Tri c
a
Utrecht University, Department of Physical Geography, P.O. Box 80115, 3508 TC, Utrecht, The Netherlands
b
Rijkswaterstaat, Rijksdienst IJsselmeerpolders, Lelystad, The Netherlands
c
Mangrove Ecosystem Research Division, Vietnam National University, Hanoi, Viet Nam
Received 10 April 2003; received in revised form 25 January 2005; accepted 26 May 2006
Abstract
Sediment dynamics were studied in a mangrove system in the Ba Lat estuary of the Red River, Vietnam. The study area was situated on a
riverbank, which consisted of a bare mudXat containing a vegetation gradient from pioneering mangroves to 5- to 7-year-old mangroves.
Measurements were conducted in the dry season (February/March 2000) and in the wet season (July/August 2000). Actual sedimentation
rates were measured using sediment traps and the elevation of the area was surveyed in both periods. Two undisturbed sediment cores were
taken in the densely vegetated area for 210Pb-dating analysis and showed long-term sedimentation rates of 0.22 g cm¡2 yr¡1 and
0.36 g cm¡2 yr¡1. Sedimentation rates recorded by the sediment traps in the vegetated area were 2.94 g cm¡2 yr¡1 in the dry season and
3.46 g cm¡2 yr¡1 in the wet season. In both seasons, the sedimentation rates on the bare mudXat were Wve to ten times higher than in the
densely vegetated area. However, the elevation of the mudXat was slightly lower in the wet season than in the dry season. This implies that
erosion must have taken place between March and July. This study demonstrates that the bare mud bank of an estuary is highly dynamic
until mangroves cover it. Sediment delivery to the vegetated zones is low but the protective eVect of vegetation against erosion by waves and
currents is strong. This results in small but steady actual sedimentation rates under mangroves and therefore sustained long term accretion.
The study further identiWes the need for similar measurements to be made in diVerent seasons covering the eVects of periodic storm events.
© 2006 Elsevier Ltd. All rights reserved.
Keywords: Mangroves; Sedimentation rate; Estuary; Red River; Vietnam
1. Introduction
Mangroves are tidal forest ecosystems in sheltered saline
to brackish environments. They are generally known to
favour deposition. The dense and rigid network of stems,
branches and aerial roots causes an increased bottom
roughness that results in reduction of currents and attenuation of waves (see also Quartel et al. (2006)). However, sedimentation rates under mangroves, based on reliable
measurements, are scarcely published and show large variation (Augustinus, 1995). This is especially true for estuarine
mangroves. Estuaries are characterized by a large spatial
and temporal variation in current velocity, current direction,
suspension load and related processes of sedimentation and
erosion due to the action of river outXow and/or tides. Wave
*
Corresponding author.
E-mail address: (P. Van Santen).
1367-9120/$ - see front matter © 2006 Elsevier Ltd. All rights reserved.
doi:10.1016/j.jseaes.2006.05.011
activity in estuaries is generally of minor importance. Large
waves will only occur in the mangrove area during storm or
typhoon events with onshore directed winds.
Estuarine mangroves give natural support to the protection of the riverbanks, due to their accumulative nature. To
study this eVect, it is necessary to measure sedimentation
rates under estuarine mangroves. For this reason, a
research study has been conducted on a riverbank of the Ba
Lat estuary in the Red River delta (Vietnam). The aim of
the measurements was:
• to demonstrate the current velocity reduction by estuarine mangroves;
• to establish the actual accumulation or erosion on an estuary bank with coverage, ranging from bare to dense coverage by mangroves, in the dry as well as in the wet season;
• to establish long-term sedimentation rates under estuarine mangroves by 210Pb-dating analysis.
P. Van Santen et al. / Journal of Asian Earth Sciences 29 (2007) 566–575
2. The Ba Lat estuary
The delta of the Red River extends from Viet Tri, a town
some 50 km upstream from Hanoi, to the south-east
(Fig. 1A). It is dissected by several distributaries, which discharge into the Gulf of Tonkin. The main stream of the
Red River Xows into the sea through the Ba Lat estuary.
2.1. Geomorphology
The southern part of the Red River delta, including
the Ba Lat estuary, has been classiWed as a wave-domi-
567
nated system (Mathers and Zalasiewicz, 1999), according
to the classiWcation of Galloway (1975). Sandy bars and
cheniers are parallel oriented to the coast (Fig. 1B) and
develop due to wave action (Van Maren, 2004). The
waves rework the initially deposited riverine sediments.
The sandy ridges are separated by Xat areas which are
covered with mangrove swamps or marshes. These are
the former tidal Xats and lagoons, which have been Wlled
up with silt, clay and peat. The rivers crossing the delta
show relatively straight to irregularly oriented segments,
and are characterized as anastomosing streams (Mathers
and Zalasiewicz, 1999).
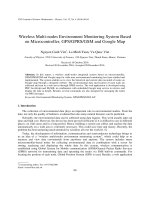
Fig. 1. (A) Location of the Red River delta in Vietnam; (B) geomorphology of the Ba Lat Estuary, the main branch of the Red River; (C) study area with
tripod locations (triangles) and vegetation zones (bordered by thin lines).
568
P. Van Santen et al. / Journal of Asian Earth Sciences 29 (2007) 566–575
2.2. Vegetation
The coastal vegetation mainly consists of mixed species
mangroves. Mangroves thrive in the tropics and even
extend into the temperate-zone if frost is rare and of short
duration. The Red River delta is situated in the tropics.
Nevertheless, the climatic conditions appear to be marginal
for the growth of mangroves, because mangroves of the
species Kandelia candel appear in dwarf form and other
species, e.g., Sonneratia, lose their leaves during wintertime.
2.3. Study area
The study area is situated at the southern bank of the Ba
Lat estuary, approximately 2 km from the open sea
(Fig. 1B). The Ba Lat estuary is the eastern boundary of the
study area. Tidal creeks form all other boundaries. A small
dike along the north-west side protects the inland lying
Wshponds (Fig. 1C). The study area consists of a bare (intertidal) mudXat in the east, which grades into an area with
5- to 7-year-old mangroves in the west through a zone with
pioneering mangroves (Fig. 1C). The pioneer plants are
mostly Aegiceras corniculatum, 0.7 m high in average. Bulrush (Scirpus spec.) comes up in large quantities in this zone
in summer. The pioneer vegetation towards the west
changes into a narrow zone, some 10 m wide, with moderately dense vegetation. Here, 0.9 to 1.3 m high mangroves
grow in groups, which stand about 5 m from each other.
Each group is about 2.5 m wide and consists of three to Wve
individual shrubs. West of this moderately vegetated zone
lies the zone with dense vegetation. The vegetation is
mainly composed of Aegiceras corniculatum (75%) that
have a maximum height of 1.85 m in the study area, and
Acanthus ilicifolia (20%). The species Kandelia candel, Sonneratia and Avicennia grow in the study area in small numbers. The separate shrubs of Aegiceras had a width of
0.55 m at the bottom and 1.20 m at their top.
3. Methods
This study comprised two measurement campaigns. The
Wrst lasted from 28 February 2000 to 28 March 2000 and
was indicative for the dry season. The wet season was represented by measurements conducted in the period 25 July
2000 to 7 August 2000. In the Wrst period, instrumented tripods were used to measure the hydrodynamics. Three tripods were installed in the study area (Fig. 1). Tripod A was
placed in the river at a bed level 0.5 m below the lowest
water level (Fig. 2). Tripod B is situated in the front zone of
the densely vegetated part of the study area, where the vegetation had a moderately dense character. Tripod C was
installed in the densely vegetated part of the study area.
Hydrodynamics were measured with an electro-magnetic
current meter (EMC) and a pressure sensor. The suspended
sediment concentration (ssc) was measured with an optical
back-scatterance sensor. Measurements were done in bursts
of 1024 s (17 min and 4 s) with a frequency of 2 Hz. Burst
interval was 1 h. The measurements were started on 28 February 2000, at 15:00 h (burst 1408) and ended on 28 March
2000 at 8:17 h (burst 2097). The OBS sensor was calibrated
in situ based on sediment concentrations of water samples
taken during the measurements.
Sedimentation rates were measured in diVerent ways.
• Bed level heights were obtained with a levelling instrument in both measuring campaigns. A continuous surface was created by spatial interpolation of the measured
bed level. The interpolated surfaces of the two campaigns were compared to estimate bed level changes. The
measurement error associated with levelling is generally
0.5 cm. The overall error is estimated to be in the order
of 2–3 cm, due to the lack of a Wxed reference point and
the muddy bed.
• Thin (0.4 mm) pieces of canvas of 0.4 by 0.4 m, with a
rough surface, were placed on the bed and Wxed with
0.5 cm thick wooden sticks into the bed. These canvas
pieces acted as sediment traps. Most traps were fully
covered by sediment after one Xood period and were
completely assimilated with its surroundings. The traps
with the sediment were removed after 3 weeks in February/March and after 2 weeks in July. The amount of sediment was measured and for the March traps the
fractions of lutum (<2 m), Wne silt (2–20 m), coarse silt
(20–50 m) and sand > 50 m were determined. The bed
level of the trap locations was measured with a levelling
instrument. The total time of inundation per trap was
estimated with the water level records of the Ba Lat
river. Accumulation rates of dry sediment were
expressed in g cm¡2 yr¡1.
• A marker (pure kaolinite) was smoothly dispersed over
the bed surface in two locations in the dense mangrove
vegetation. Two undisturbed samples of the top layers
(10 cm) were taken at these two locations at the end of
the campaign. Thin sections were prepared according to
the method described by (Jongerius and Heitzberger
(1975)). The thin sections were studied in plain transmitted light and under crossed polarisers, with magniWcations up to ten times.
• Two sediment cores of the top soil were taken using a
0.09 m diameter PVC tube in the dry season campaign.
The sediment was dated with the 210Pb method by means
of -spectrometry as described by Van Weering et al.
(1998) and results in a mass accumulation rate expressed
in g cm¡2 yr¡1. Dividing this value by the mean dry bulk
density over the proWle with decreasing 210Pb values,
results in a sedimentation rate in mm yr¡1.
4. Results
4.1. Hydrodynamics
The tidal water level oscillations were diurnal with a neap
and spring tidal range of 0.7 and 2.5 m, respectively. During
neap tide, a semidiurnal oscillation of approximately 0.3 m
P. Van Santen et al. / Journal of Asian Earth Sciences 29 (2007) 566–575
569
3
A
h (m)
2
1
B
0.2
on (m/s)
0.15
U
0
0.05
1/3
0.1
0
Ur (m/s)
C
0.5
0
–0.5
SSC (mg/l)
D
600
400
200
0
02/28
03/03
03/07
03/11
03/15
03/20
03/24
03/28
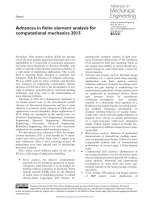
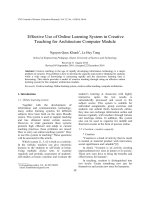
Fig. 2. Time series of (A) waterlevel (h), (B) onshore directed wave orbital velocity U1/3 (m s¡1) at z D 0.09 m, (C) mean current velocity magnitude Ur (m s¡1)
at z D 0.09 m (positive is seaward, negative means landward) and (D) suspended sediment concentration SSC (mg l¡1) at z D 0.1 m measured at tripod A.
was present (Fig. 2A). The tripod in the river (A) was continuously submerged with a minimum water level of 0.5 m. The
mangrove area was Xooded 9–10 h per day during spring
tide (Figs. 3A and 4A), with a maximum water level of 0.9 m
at tripod C. During neap tide, this area was Xooded 0–5 h a
day with a maximum water level of 0.2 m at tripod C.
Tidal currents were predominantly diurnal with a small
semi-diurnal oscillation during ebb tide. Maximum spring
tidal currents measured at tripod A were 0.5 m s¡1 seaward directed and 0.25 m s¡1 landward and maximum
neap tidal currents are 0.3 m s¡1 seaward directed and
0.15 m s¡1 landward (Fig. 2C). Tidal currents hardly
existed in the mangrove area (Figs. 3C and 4C). Measured
tidal currents did generally not exceed 0.03 m s¡1. The
currents, measured at 0.09 m above the bed, could occasionally reach 0.1 m s¡1 at tripod B, during the Wnal stages
of the ebb tide.
Wave motions were expressed in terms of the average
value of the highest one-third peak onshore wave orbital
velocities (U1/3) per burst. U1/3 values at tripod A reached
0.1 m s¡1 during low tide (Fig. 2B). Maximum U1/3 values at
tripod B (Fig. 3B) occurred between 7 March and 11 March
2000 and were between 0.15 and 0.2 m s¡1. Maximum U1/3
values at tripod C occurred in the same period and were
0.08 m s¡1 (Fig. 4B).
Sediment concentrations at tripod A in the river were
generally 30 mg l¡1 with peaks of 600 mg l¡1 (Fig. 2D). These
peaks can hardly be correlated to local measurements, since
570
P. Van Santen et al. / Journal of Asian Earth Sciences 29 (2007) 566–575
A
1.5
h (m)
1
0.5
0
U1/3on (m/s)
B
0.2
0.15
0.1
0.05
0
C
0.5
Ur (m/s)
0.4
0.3
0.2
0.1
D
600
SSC (mg/l)
0
400
200
0
02/28
03/03
03/07
03/11
03/15
03/20
03/24
03/28
Fig. 3. Time series of (A) waterlevel (h), (B) onshore directed wave orbital velocity U1/3 (m s¡1) at z D 0.09 m, (C) mean current velocity magnitude Ur
(m s¡1) at z D 0.09 m and (D) suspended sediment concentration SSC (mg l¡1) at z D 0.1 m measured at tripod B.
the peaks are most probably caused by advected clouds of
sediment. Minimum concentrations at tripod B were also
between 30 and 50 mg l¡1 (Fig. 3D). Peaks in the sediment
concentration on the mudXat-mangrove transition exceeded
300 mg l¡1 and predominantly occurred in the period
between 7 and 11 March. The related wave orbital velocities
were over 0.12 m s¡1 (Fig 3B). The overall trend of the sediment concentration at tripod C was similar to that at tripod
B (Fig. 4D).
The maximum wave orbital velocities of almost 0.2 m s¡1
at tripod B (Fig. 3B), resembled a wave bed-shear stress of
0.2 N m¡2. Whitehouse et al. (2000) showed that the critical
bed shear stress for erosion of muddy beds lies between 0.1
and 1 N m¡2 for beds with a bulk density between 1000 and
1200 kg m¡3. Bulk densities were not measured for the study
area, however, values between 1000 and 1200 kg m¡3 are
most common for estuarine mud (Whitehouse et al., 2000).
The maximum orbital velocity at tripod C was 0.08 m s¡1
(Fig. 4B) and resembled a bed-shear stress of 0.049 N m¡2.
This value was too small to erode the sediment from the
bed.
4.2. Actual sedimentation rates
The average amount of dry weight of the sediment collected by the sediment traps was 337 g in the dry season
campaign and 1513 g in the wet season campaign. The
amount of sedimentation on a trap was hardly inXuenced
P. Van Santen et al. / Journal of Asian Earth Sciences 29 (2007) 566–575
A
571
1
h (m)
0.8
0.6
0.4
0.2
B
0.2
on (m/s)
0.15
U
0
0.05
1/3
0.1
0
C
0.5
Ur (m/s)
0.4
0.3
0.2
0.1
D
600
SSC (mg/l)
0
400
200
0
02/28
03/03
03/07
03/11
03/15
03/20
03/24
03/28
Fig. 4. Time series of (A) waterlevel (h), (B) onshore directed wave orbital velocity U1/3 (m s¡1) at z D 0.09 m, (C) mean current velocity magnitude Ur
(m s¡1) at z D 0.09 m and (D) suspended sediment concentration SSC (mg l¡1) at z D 0.1 m measured at tripod C.
by the diVerences in bed levels of the traps. This was also
observed by Cahoon and Lynch (1997).
In the dry season, the average sedimentation rate in
the dense mangrove vegetation, based on trap measurements, was 1.94 g cm¡2 yr¡1. The values ranged from
0.37 g cm¡2 yr¡1 in the back of the mangroves to
4.06 g cm¡2 yr¡1 in the front zone of the dense mangrove
vegetation (Fig. 5). Similar higher accumulation rates in the
exposed front zone of the mangrove vegetation as compared to the rearside was found by e.g., Bird (1986), Lynch
et al. (1989) and Smoak and Patchineelam (1999). Sedimentation rates in the pioneer zone were much higher and
ranged from 4.57 g cm¡2 yr¡1 to 7.38 g cm¡2 yr¡1 (Fig. 5).
Erosion took place at the riverside, which was shown by a
1–2 cm elevation of the traps above their surroundings.
In the wet season, the sedimentation rate in the dense
mangrove area ranged from 0.86 g cm¡2 yr¡1 in the rear to
5.97 g cm¡2 yr¡1 in the front zone. The sedimentation rates
varied from 22.52 g cm¡2 yr¡1 to 57.89 g cm¡2 yr¡1 in the
pioneer zone. The highest sedimentation rate was measured
on the bare riverbank: 102.3 g cm¡2 yr¡1 (Fig. 5).
A marker (pure kaolinite) was dispersed over the surface
in two locations under the dense mangrove vegetation during the measuring campaign in March. Thin section analysis of the top 10 cm of the sediment demonstrated an
average sedimentation on this marker layer of 0.47 mm
572
P. Van Santen et al. / Journal of Asian Earth Sciences 29 (2007) 566–575
A
B
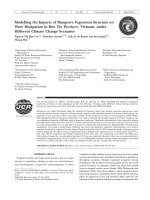
Fig. 5. Actual sedimentation rates in g cm¡2 yr¡1 per trap measured during (A) three weeks in March and (B) two weeks in July.
(8.1 mm yr¡1), respectively 0.84 mm (14.6 mm yr¡1) in 3
weeks.
The sediment collected by the sediment traps in the dry
season campaign mainly consisted of silt (between 2 and
50 m). The average amount of silt was 71.5% of which 66%
was Wner than 20 m and 34% coarser than 20 m. Some
14% of the total amount of sediment on the traps consisted
of clay (<2 m) and 14% of sand (coarser than 50 m). The
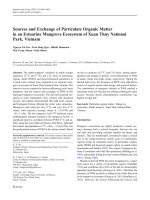
D50 was approximately 16 m. The amount of Wne silt (2–
20 m) and clay increased with increasing distance from the
river, while the amount of coarse silt and sand decreased
with increasing distance from the river (Fig. 6). Furukawa
et al. (1997) and Wolanski et al. (1998) also reported the
80
>50 μ m
20–50 μ m
2–20 μ m
<2 μ m
percentage
60
40
20
0
selective trapping of Wne sediment by mangroves. No grain
size distribution was determined in the wet season campaign.
4.3. Long-term sedimentation rates
Two sediment cores were taken in the densely vegetated
area. The cores were 0.75 m and 0.58 m long, respectively
and mainly consisted of a Wning upward alternation of laminated Wne silty sand, silt and silty clay. In the deepest part
of the 0.75 m long core (0.55–0.69 m) Xaser bedding (sand/
silty clay) occurred. Colours were in the range of dark reddish brown (5 YR 3/2) to brownish black (7.5 YR 3/2). The
sedimentary structures only locally showed disturbances by
burrows and roots. The cores appeared to be suitable for
the 210Pb-dating method, due to the silty, clayey character
of the sediments and the relatively low degree of disturbances. The compaction-corrected mass accumulation rates
of the two sediment samples were 0.24 and 0.31 g cm¡2 yr¡1
which accords to 1.8 mm yr¡1 (dry bulk density:
1.33 g cm¡3) and 2.4 mm yr¡1 (dry bulk density: 1.29 g cm¡3),
respectively.
4.4. Morphological changes
mangroves
pioneer
river
Fig. 6. Average grain size distributions based on the sediments caught by
the traps.
The interpolated surface of the study area showed a
smoothly sloping estuary bank during the dry season
P. Van Santen et al. / Journal of Asian Earth Sciences 29 (2007) 566–575
573
Fig. 7. Interpolated surface of the study area based on levelling measurements of (A) March (dry season) and (B) July (wet season). The solid line indicates
the location of the cross section shown in Fig. 8.
0
March
July
–0.4
–0.6
–0.8
mangrove
mangrove front
bed level (m)
–0.2
pioneer
–1
0
20
40
60
80
100
distance (m)
Fig. 8. Cross section through the study area from west to east. March is
the dry season and July is the wet season. Cross section location is shown
in Fig. 7.
campaign (Fig. 7). A cross-section, perpendicular to the
river showed a Xatter upper part, which convexly merged
into a smoothly sloping lower part (Fig. 8). A small bar of
approximately 5–10 cm high was present on this lower part.
The estuary bank was steeper in the wet season because the
pioneer zone was lowered and the small bar had disappeared (Fig. 8). An average accretion of 3 cm was measured
in the mangrove front zone. However, this value was much
lower than the accretion of 12 cm measured with the sediment traps in the wet season campaign. Consequently, the
pioneer zone and the mangrove front zone must have been
subject to erosion between March and July 2000. There was
no signiWcant change in elevation of the vegetated area
between the two campaigns (Fig. 8).
5. Discussion
Quantitative descriptions of current reduction by (estuarine) mangroves and the related increase in sedimentation
are scarce (Augustinus, 1995). In the Bimini Lagoon, Bahamas, ScoYn (1970) observed a decrease in current velocity
of 0.4 m s¡1 to zero over a distance of one meter, caused by
prop roots of Rhizophora at mutual distances of approximately 0.15 m. Similar results were obtained by experiments
at a natural setting (Yarringa, Victoria) by Bird (1986), and
by Spencely (1977) at Magnetic Island, Queensland, using
grids of rods to simulate the pneumatophores of Avicennia.
Wolanski (1992) measured current velocities in the Coral
Creek in Hinchinbrook, Queensland and in the adjacent
mangrove vegetation. He found current velocities in the
open channel regularly to exceed 1 m s¡1, while the water
Xow through the mangrove forest at 50 m from the creek
never exceeded 0.07 m s¡1. These values were similar to the
current reduction measured along the Ba Lat estuary. A
diVerence is that the current velocity already reduced to
nearly zero over the mudXat from tripod A to tripod B in
front of the mangrove zone (Figs. 2C and 3C).
The sediment traps in the pioneer zone measured the
highest sedimentation rates caused by the strong current
velocity reduction on the mudXat. The higher fractions of
clay in the mangrove area compared to the mudXat showed
that predominantly Wner sediments were taken further
towards the mangrove area. Wolanski et al. (1998) also
observed this feature in the Fly River Delta. Furukawa
et al. (1997) described the active capture of Wne cohesive
sediment by mangrove forests. Sedimentation takes place
mainly during slack water around high tide, while the consecutive ebb currents are too small to re-entrain this sediment. The high sedimentation rate of the mudXat was
counteracted by erosion. Erosion on a mudXat is often
caused by waves (Andersen and Pejrup, 2001). Erosion by
waves on the mudXat was possible and measured, while it
was not possible (or minimal) within the vegetated part of
the study area. This showed that the densely vegetated area
was an area of sustainable deposition, while the pioneer
zone was a highly dynamic area where large sedimentation
rates alternated with erosive events. Bird (1971) described a
comparable situation for Westernport Bay, Australia,
where the sustained deposition in the mangrove fringe also
contrasted with an alternation of accretion and erosion
of the adjacent mudXat. It remains unsure which event
caused the erosion between the two measuring campaigns.
574
P. Van Santen et al. / Journal of Asian Earth Sciences 29 (2007) 566–575
However, a big storm passed the Ba Lat estuary in May.
This storm probably caused higher water levels and higher
waves to occur, which were probably responsible for the
erosion on the mudXat and the front zone of the mangroves.
The bed in the landward part of the densely vegetated
mangrove zone appears to be the most stable in the study
area. The spatially averaged actual mass accumulation
rates are 2.94 g cm¡2 yr¡1 in the dry season and
3.46 g cm¡2 yr¡1 in the wet season, but some traps showed
accumulation rates of one order smaller. Quantitative
descriptions of directly measured sedimentation rates under
mangroves are scarce and show much variation. Cahoon
and Lynch (1997) present an overview of vertical accretion
and bed elevation under mangroves, arranged according to
the method applied: marker horizons, pins and elevation
tables. The sedimentation traps, used in this study, resemble
marker horizons and our study site resembles best the
fringe site in Rookery Bay. Clastic mass accumulation rates
at the fringe site in Rookery Bay was 0.35 g cm¡2 yr¡1 which
is one order smaller than the average mass accumulation
rate measured in the Ba Lat river mouth. Other studies
mentioned in Cahoon and Lynch (1997) reported their
accumulation rates in mm yr¡1 but are of the same order as
in Rookery Bay. Although diVerent sites and methods are
hard to compare, our measured actual mass accumulation
rates are signiWcantly higher, which is probably due to the
high sediment concentrations in the Ba Lat River, which
ranged from roughly 0.2 kg m¡3 in the dry season up to
1.4 kg m¡3 in the wet season (Van Maren and Hoekstra,
2004).
The long-term sedimentation rates in the dense mangrove area, determined by 210Pb analysis of two cores, were
0.24 g cm¡2 yr¡1
(1.8 mm yr¡1)
and
0.31 g cm¡2 yr¡1
¡1
(2.4 mm yr ). Lynch et al. (1989) gave comparable values
based on 210Pb and 137Cs analyses, for the Rookery Bay,
Florida (1.6 mm yr¡1) and Terminos Lagoon, Mexico
(2.4 mm yr¡1). Smoak and Patchineelam (1999) measured a
sedimentation rate of 1.2 mm yr¡1 under mangroves.
The diVerence between the long term sedimentation
rates and the actual ones is one order of magnitude. This is
partly due to the diVerent method. However, the mangrove
vegetation have appeared only 5–10 years ago which might
have caused an increase in sedimentation rates. Siltation
rates measured with thin sections of undisturbed sediment
in the dry season (8 and 14.6 mm yr¡1) appeared higher.
However, these sample location were in the dynamic area,
where erosion occurs as well.
It appears that the used pieces of canvas can be applied
successfully as sediment traps on a muddy estuarine bank
and adjacent mangroves, since these traps do not alter currents. However, the method might not work in moderate to
high wave energy environments. Sedimentation rates based
on just 2 or 3 weeks of measurements, even if diVerent seasons are covered, should be treated with great care. Periodic
events like typhoons, will interrupt general accumulation in
the pioneer zone and the adjacent lower mudXat as well as
in the front zone of the dense mangrove vegetation. Longterm mass accumulation rates, e.g., determined by 210Pb
analysis over one hundred years, are more reliable in these
cases, but do not show recent changes in the accumulation
rate. Therefore, for management purposes, knowledge of
the behaviour of the estuary banks is important, and in
these cases direct measurements, taking the impact of
events into account, are necessary to provide a better
understanding of the key processes acting to redistribute
sediment on the Xanks of the estuary.
6. Conclusions
The present study has shown that estuarine current
velocities were already reduced to nearly zero on the mudXat in front of the mangrove zone. Consequently, most sediment settled on this bare part of the estuary bank and only
the Wnest fraction was transported to the vegetated part of
the estuary bank where actual sedimentation rates were 5–
10 times lower than on the mudXat. Measurements showed
that waves were able to stir up sediment from the mudXat,
but hardly from the bed in the vegetated part. The mudXat
up to the front zone of the mangroves must have been
eroded, between March and July 2000, because the strong
sedimentation rates as measured by the sediment traps did
not match the bed level change of the estuary bank. The
lower part of the estuary bank was probably eroded by a
storm event in May 2000 creating signiWcant waves, even
inside the estuary. This shows that short-term sedimentation measurements must be treated with care and the eVect
of erosive events must be taken into account. Sedimentation rates inside the vegetated part of the estuary bank were
higher than other coastal areas known from literature. This
is possibly due to the high sediment discharge of the river.
The sedimentation rates measured in the rear zone of the
mangroves by the canvas sediment traps, the thin sections
and the 210Pb dating showed good agreement. The long
term sedimentation rate in the mangrove area was in the
order of 0.22–0.36 g cm¡2 yr¡1, while actual sedimentation
rates were on average one order of magnitude larger at
2.94–3.46 g cm¡2 yr¡1.
Acknowledgments
The authors are greatly indebted to the Vietnam
National University students and staV members and the
Ramsar site managers for their active participation in the
Weld research. Wim Boer is gratefully acknowledged for
analysing the 210Pb cores. Aart Kroon, Morten Pejrup and
an anonymous reviewer are thanked for the revision of an
earlier draft of this paper.
References
Andersen, T.J., Pejrup, M., 2001. Suspended sediment transport on a temperate, microtidal mudXat, the Danish Wadden Sea. Marine Geology
173, 69–85.
P. Van Santen et al. / Journal of Asian Earth Sciences 29 (2007) 566–575
Augustinus, P.G.E.F., 1995. Geomorphology and sedimentology of mangroves. In: Perillo, G. (Ed.), Geomorphology and sedimentology of
estuaries. No. 53 in developments in sedimentology. Elsevier, Amsterdam, pp. 333–357.
Bird, E.C.F., 1971. Mangroves as landbuilders. Victoria Naturalist 88, 189–
197.
Bird, E.C.F., 1986. Mangroves and intertidal morphology in Westernport
bay, Victoria, Australia. Marine Geology 69, 251–271.
Cahoon, D.R., Lynch, J.C., 1997. Vertical accretion and shallow subsidence in a mangrove forest of southwestern Florida, USA. Mangroves
and Salt Marshes 1, 173–186.
Furukawa, K., Wolanski, E., Mueller, H., 1997. Currents and sediment transport in mangrove forests. Estuarine. Coastal and Shelf Science 44, 301–310.
Galloway, W.E., 1975. Process framework for describing the morphologic
and stratigraphic evolution of deltaic depositional systems. In: Broussard, M.L. (Ed.), Deltas. Houston Geological Society, pp. 87–98.
Jongerius, A., Heitzberger, G., 1975. Methods in soil micromorphology. A
technique for the preparation of large thin sections. Tech. rep., Neth.
Soil Survey Inst., Wageningen.
Lynch, J.C., Meriweather, J.R., McKee, B.A., Vera-Herrera, F., Twilley,
R.R., 1989. Recent accretion in mangrove ecosystems based on 137Cs
and 210Pb. Estuaries 12 (4), 284–299.
Mathers, S., Zalasiewicz, J., 1999. Holocene sedimentary architecture of
the Red River. Journal of Coastal Research 15, 314–325.
Quartel, S., Kroon, A., Augustinus, P.G.E.F., Van Santen, P., Tri, N., 2006.
Wave attenuation in coastal mangroves in the Red River Delta, Vietnam. Journal of Asian Earth Sciences (this issue).
575
ScoYn, T.P., 1970. The trapping and binding of subtidal carbonate sediment by marine vegetation in Bimini Lagoon, Bahamas. Journal of
Sedimentary Petrology 40, 249–273.
Smoak, J., Patchineelam, S., 1999. Sediment mixing and accumulation in a
mangrove ecosystem: evidence from 210Pb. Mangroves and Salt
Marshes 3, 17–27.
Spencely, A.P., 1977. The role of pneumatophores in sedimentary processes. Marine Geology 23, 31–37.
Van Maren, D.S., 2004. Morphodynamics of a cyclic prograding delta: The
Red River, Vietnam. Ph.D. thesis, Utrecht University.
Van Maren, D.S., Hoekstra, P., 2004. Seasonal variation of hydrodynamics
and sediment dynamics in a shallow subtropical estuary. Estuarine,
Coastal and Shelf Science 60, 529–540.
Van Weering, T., Hall, I., De Stigter, H., McCave, I., Thomson, I., 1998.
Recent sediments, sediment accumulation and carbon burial at Globan
Spur, N.W. European Continental Margin (47–50N). Progress in
Oceanography 42, 5–35.
Whitehouse, R.J.S., Soulsby, R., Roberts, W., Mitchener, H., 2000.
Dynamics of Estuarine Muds. Thomas Telfort Ltd. and HR Wallingford.
Wolanski, E., Gibbs, R., Spagnol, S., King, B., Brunskill, G., 1998. Inorganic sediment budget in the mangrove-fringed Fly River delta, Papua
New Guinea. Mangroves and Salt Marshes 2, 85–98.
Wolanski, E., 1992. Hydrodynamics of mangrove swamps and their
coastal waters. In: Jaccarini, V., Martens, E. (Eds.). The Ecology
of Mangrove and related Ecosystems. Hydrobiologia, vol.247, pp.
141–161.