DSpace at VNU: Crystalline evolution and large coercivity in Dy-doped (Nd, Dy)(2)Fe14B alpha- Fe nanocomposite magnets
Bạn đang xem bản rút gọn của tài liệu. Xem và tải ngay bản đầy đủ của tài liệu tại đây (688.41 KB, 5 trang )
Home
Search
Collections
Journals
About
Contact us
My IOPscience
Crystalline evolution and large coercivity in Dy-doped (Nd,Dy)2Fe14B/α-Fe nanocomposite
magnets
This content has been downloaded from IOPscience. Please scroll down to see the full text.
2007 J. Phys. D: Appl. Phys. 40 119
( />View the table of contents for this issue, or go to the journal homepage for more
Download details:
IP Address: 141.161.91.14
This content was downloaded on 07/09/2015 at 15:31
Please note that terms and conditions apply.
INSTITUTE OF PHYSICS PUBLISHING
JOURNAL OF PHYSICS D: APPLIED PHYSICS
J. Phys. D: Appl. Phys. 40 (2007) 119–122
doi:10.1088/0022-3727/40/1/001
Crystalline evolution and large coercivity
in Dy-doped (Nd,Dy)2Fe14B/α-Fe
nanocomposite magnets
N D The1,2 , N Q Hoa1,3 , S K Oh3 , S C Yu3 , H D Anh1 , L V Vu1 and
N Chau1,4
1
Center for Materials Science, College of Science, Vietnam National University Hanoi,
334 Nguyen Trai Road, Hanoi, Vietnam
2
Department at Physics and Astronomy, University of Glasgow, Glasgow C12 8QQ, UK
3
Department of Physics, Chungbuk National University, 361-763 Cheongju, Korea
E-mail:
Received 6 April 2006, in final form 9 November 2006
Published 15 December 2006
Online at stacks.iop.org/JPhysD/40/119
Abstract
Nanocomposite hard magnetic materials (Nd,Dy)4.5 Fe77.5 B18 (No. 1) and
(Nd,Dy)4.5 Fe76 B18 Nb1.2 Cu0.3 (No. 2) have been prepared by crystallizing
amorphous ribbons, fabricated by single roll melt-spinning. The evolution
of a multiphase structure was monitored by an x-ray diffractometer and by
thermomagnetic measurement. We observed that, at annealing temperatures
below 670 ◦ C, there is crystallization of soft phase Fe3 B and a small amount
of hard phase Nd2 Fe14 B. At annealing temperatures above 670 ◦ C,
crystallization of α-Fe and probably Dy2 Fe14 B phases with large
magnetocrystalline anisotropy led to a drastic enhancement in the hard
magnetic properties of the materials. The maximum value of HC is found to
be 4.2 kOe for sample No. 1. For sample No. 2, with co-doping of Nb and
Cu, nanostructure refinement yields a strong enhancement in exchange
coupling between the component phases. Thereby, we obtained high
reduced-remanence of 0.78, high remanence of 1.15 and a high (BH)max
value up to 16.2 MGOe.
(Some figures in this article are in colour only in the electronic version)
1. Introduction
Nanocomposite exchange-spring magnets provide an alternative way of producing high remanence magnetic materials,
which can be used to make resin bonded magnets. Additional
merit is in the cost reduction owing to the low consumption
of rare-earth elements. Nanocomposite magnets have been
studied for compositions like (Pr,Nd)2 Fe14 B/Fe3 B [1, 2] and
(Pr,Nd)2 Fe14 B/α-Fe(Co) [3–8]. Some of the recently reported
new kind of nanocomposite magnets are self-assembled FePt
[9, 10], melt-spun nanocomposite magnets FePtB [11, 12]
and nanocomposite (Nd,Dy)(Fe,Co,Nb,B)5.5 /α-Fe multilayer
magnets [13]. So far, high-performance nanocomposite magnets have not been obtained with low rare-earth content because
4
Author to whom any correspondence should be addressed.
0022-3727/07/010119+04$30.00
© 2007 IOP Publishing Ltd
high coercivity has not been reached. Nonetheless, the effect
of doping elements on the microstructure and magnetic properties of nanocomposite magnets has shown something remarkable [8, 12–15]. With a small amount of Cr and Co doping, a
special microstructure, namely the cellular structure, was observed in α-Fe(Co)/Nd2 Fe14 B nanocomposite magnets [8]. In
fact, the formation of a cellular structure resulted in high shape
anisotropy of nano-grains, which contributes to the total magnetic anisotropy of the material. Thereby, a high-performance
nanocomposite magnet was obtained with a very low concentration of Nd (4.5 at.%). Hence, the role played by the cellular
structure could be an important ingredient that should be taken
into account in producing high-performance magnets with low
rare-earth content. Therefore, in this article, we investigate further the effect of substituting a small amount of Dy for Nd and
the role of Nb and Cu in microstructural refinement.
Printed in the UK
119
N D The et al
2. Experimental
The amorphous precursors with the composition of (Nd,Dy)4.5
Fe77.5 B18 (No. 1) and (Nd,Dy)4.5 Fe75.5 B18.5 Nb1.2 Cu0.3 (No. 2)
have been fabricated by the rapid-quenching technique in an Ar
atmosphere in an Edmund Buehler melt-spinner with a linear
speed of 30 m s−1 . Subsequently, we put the amorphous flakes
in a quartz tube, evacuated to a high vacuum state, then filled
the tube with highly purified Ar and finally annealed them
isothermally at appropriate temperatures.
The crystalline evolution of as-cast samples was
monitored using a differential scanning calorimeter (TA
Instruments model 2960). The structure of the samples
was examined by an x-ray diffractometer (Bruker model
D5005) with Cu–Kα radiation. Microstructural observation
was carried out by a scanning electron microscope (JEOL
model 5410 LV). Magnetic characteristics were measured by
a vibrating sample magnetometer (Model DMS 880) with
the maximum applied field of 13.5 kOe, and demagnetization
curves were measured using a hysteresisgrapher (Walker
model AMH 25). The demagnetizing factor of the specimens
was approximately corrected.
3. Results and discussion
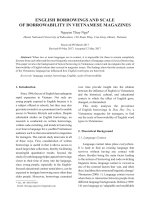
Figure 1(a) displays differential scanning calorimetry (DSC)
results for amorphous ribbons with a heating rate of
20 ◦ C min−1 . The curves exhibit three clearly exothermal
peaks, which are related to the formation of a magnetic phase
in the thermal process. According to Li et al [16], the
crystalline evolution of (Nd,Dy)FeB amorphous ribbons could
be expressed as:
Amorphous → Amorphous’ + o-Fe3 B → Amorphous” +
t-Fe3 B + (Nd,Dy)2 Fe14 B → t-Fe3 B + (Nd,Dy)2 Fe14 B + α-Fe.
However, structural examination by an x-ray diffractometer (XRD (figure 1(b))) shows a different result. It can be
described as follows:
Figure 1. DSC curves of as-cast samples with the heating rate of
20 ◦ C min−1 measured in flowing Ar gas (a) and XRD results for
sample No. 1 at different annealing temperatures (b).
• The first peak corresponds to the crystallization of the
Fe3 B and Nd2 Fe14 B phases, which is similar to that of
other NdFeB-based amorphous ribbons [5, 8];
• The second peak, occurring at a slightly higher
temperature, is related to the formation of α-Fe, and seems
to be a (Nd,Dy)2 Fe14 B phase (suggestion);
• In sample No. 2, the exothermal peaks shift to lower
temperature (see figure 1) because of the doping of Cu with
low melting temperature and a high diffusion coefficient
as the nucleation is accompanied in crystallization [17].
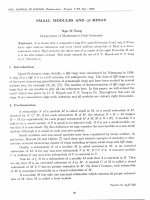
A multiphase structure is also confirmed by measuring
the thermomagnetic curve of the annealed samples (see
figure 2). Obviously, the curves exhibit Curie temperatures
of the Nd2 Fe14 B and Fe3 B phases. As seen in figure 2,
the thermomagnetic curve of the sample annealed at 650 ◦ C,
which is lower than the temperature at the second exothermal
peak, exhibits Curie temperatures of the Nd2 Fe14 B and Fe3 B
phases within the measuring temperature range. Meanwhile,
the Curie temperature of a (Nd,Dy)2 Fe14 B phase can be found
in the thermomagnetic curve of the sample annealed at 670 ◦ C,
which is the onset crystallization temperature of the second
exothermal peak.
120
Figure 2. Temperature dependence of magnetization of annealed
sample No. 1 measured in 100 Oe applied field.
Therefore, we suggest that the crystalline evolution
process in our materials is as follows:
Amorphous → Amorphous’ + Fe3 B → Amorphous” +
Fe3 B + Nd2 Fe14 B → Amorphous”’ + α-Fe + (Nd,Dy)2 Fe14 B
→ α-Fe + Fe3 B + (Nd,Dy)2 Fe14 B.
Crystalline evolution and coercivity in nanocomposite magnets
Table 1. Magnetic parameters for sample No. 1 at differing
annealing temperatures.
Ta (◦ C)
Mr (emu g−1 )
Mr /Mmax
B Hc
660
670
680
690
700
710
106
126
123
127
127
121
0.64
0.73
0.70
0.73
0.74
0.71
1370
3400
3500
3580
3660
3520
(Oe)
(BH)max (MGOe)
9.5
12.6
12.3
15.0
15.9
13.4
Table 2. Magnetic parameters for sample No. 2 at different
annealing temperatures.
Figure 3. Magnetic parameters as a function of annealing
temperature for sample No. 1 (annealing time of 5 min).
Ta (◦ C)
Mr (emu g−1 )
Mr /Mmax
B Hc
640
650
660
670
680
690
126
128
126
124
121
120
0.76
0.78
0.77
0.76
0.76
0.73
2110
3050
2980
2920
2840
2600
(Oe)
(BH)max (MGOe)
10.5
16.2
15.4
14.4
13.3
12.0
remanence as well as reduced remanence (see figures 3 and
4 and tables 1 and 2). The value 4.2 kOe for No. 1 is quite
a high achievement obtained so far for nanocomposite
magnets with low rare-earth contents.
Figure 4. Annealing time dependence of magnetic parameters for
sample No. 2 after annealing in 5 min.
Figures 3 and 4 show annealing temperature dependence
of magnetic characteristics of the samples derived from
VSM. First of all, coercivity and remanence of both samples
gradually increase with annealing temperature and after that
they drastically increase to large values. This could be
explained as follows:
• At an annealing temperature, which is lower than the
temperature of the second exothermal peak, there is the
crystallization of the Fe3 B phase and a small amount of
the Nd2 Fe14 B phase. The volume fraction of Nd2 Fe14 B
increases, leading to an increase in coercivity;
• As the annealing temperature increases to the temperature
at the second exothermal peak, Dy atoms replace the Nd
ones in the crystal lattice of the 2: 14: 1 phase to form
the (Nd,Dy)2 Fe14 B phase. In the Dy2 Fe14 B, which has
twice larger magnetocrystalline anisotropy than that of
Nd2 Fe14 B [18], there is a dramatic increase in coercivity
(see inset in figure 2). Besides the increase in the volume
fraction of hard phases, a strong exchange coupling
between the soft and the hard phases leads to an increase in
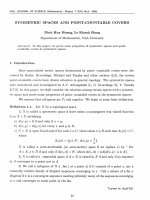
Microstructural observation was performed for the
annealed samples. Figure 5 is a typical example for this
measurement. We can say that, in sample No. 2, the grain
size is always smaller than that of sample No. 1. For example,
in figure 5, the average size of nano-crystallites is 45 nm for
sample No. 1 (after optimally annealing) whereas this value
is 27 nm for sample No. 2. In sample No. 2, there is a
co-doping of Nb and Cu. This produces a well-known effect
in that Cu promotes nucleation in the crystallization process,
and Nb plays a role in retarding the growth of the crystal
grains [5, 17]. Copper atoms form a high density of clusters
prior to the crystallization reaction, which serve as nucleation
sites for the bcc-Fe primary crystals. Niobium added in
combination with Cu induces the formation of the Nd2 Fe14 B
and metastable phases in the second stage of the crystallization
process by partitioning in it. Because two phases are formed
from the remaining amorphous phase, the crystal grain size
in the final microstructure becomes smaller than that of the
specimen without Nb and Cu. So, the co-doping of Cu and
Nb creates a grain refinement, which enhances the exchange
coupling between magnetically hard and soft nano-grains (see
table 2). Enhancement of exchange coupling causes a highly
reduced remanence up to 0.78 (for sample No. 2) at the optimal
annealing condition.
4. Conclusion
The crystalline evolution, and magnetic properties of
(Nd,Dy)2 Fe14 B/α-Fe nanocomposite magnets with low rareearth contents have been investigated. A small amount of Dy
substitution for Nd leads to an enhancement in the coercivity of
the materials, up to 4.2 kOe. This value is much larger than that
of similar compositions reported previously by other authors
[16]. The effect of Cu/Nb co-doping on microstructural
refinement is discussed.
121
N D The et al
for Natural Sciences (Project 406506), and research at
Chungbuk National University was supported by the Korean
Science and Engineering Foundation through the Research
Center for Advanced Magnetic Materials at Chungnam
National University.
References
Figure 5. SEM micrographs of optimally annealed samples.
No. 1 (a) and No. 2 (b).
Acknowledgments
Research at Center for Materials Science, VNU, is financially
supported by the Vietnamese Fundamental Research Program
122
[1] Coehoorn R, de Mooji D B and de Waard C 1989 J. Magn.
Magn. Mater. 80 101
[2] Xiong X Y, Hono K, Hirosawa S and Kaneikiyo H 2002
J. Appl. Phys. 91 9308
[3] Zhang X Y et al 2002 Phys. Rev. B 66 212103
[4] Lin Z Q, Cui B Z, Liu J P, Ding Y, Wang Z L and
Thadhanni N N 2004 Appl. Phys. Lett. 84 4382
[5] Chau N, Chien N X, Hoa N Q, Luong N H, Niem P Q, Tho N D
and Hiep V V 2004 J. Magn. Magn. Mater. 282 174
[6] Betancourt I and Davies H A 2005 Appl. Phys. Lett.
87 162516
[7] Chu K-T, Jin Z Q, Chakka V M and Liu J P 2005 J. Phys. D:
Appl. Phys. 22 4009
[8] The N D, Chau N, Vuong N V and Quyen N H 2006 J. Magn.
Magn. Mater. 303 e419–22
[9] Zeng H, Li J, Liu J P, Wang Z L and Sun S 2002 Nature
420 395
[10] Sui Y C, Liu W, Yue L P, Li X Z, Zhou J, Skomski R and
Sellmyer D J 2005 J. Appl. Phys. 97 10J304
[11] Zhang W, Louzguine D V and Inoue A 2004 Appl. Phys. Lett.
85 4998
[12] Chang C W, Chang H W, Chiu C H and Chang W C 2005
J. Appl. Phys. 97 10N117
[13] Liu W, Zhang Z D, Liu J P, Dai Z R, Wang Z L, Sun X K and
Sellmyer D J 2003 J. Phys. D: Appl. Phys. 36 L63
[14] Chang H W, Chiu C H and Chang W C 2003 Appl. Phys. Lett.
82 4513
[15] Zhang W Y, Chang H W, Chiu C H and Chang W C 2004
J. Alloys Compounds 379 28
[16] Li S, Gu B X, Sen Y, Hong B, Yaodong D, Zongjun T, Guozhi
X, Youwei D and Zuanru Y 2002 J. Phys. D: Appl. Phys.
35 732
[17] Ping D H, Hono K, Kanekiyo H and Hirosawa S 1999 Acta
Metall. 47 4641
[18] Sagawa M, Fujimura S, Yamoto H, Matsuura Y and Hiraga K
1984 IEEE Trans. Magn. 20 1584