DSpace at VNU: Shear Strength Model for Reinforced Concrete Columns with Low Transverse Reinforcement Ratios
Bạn đang xem bản rút gọn của tài liệu. Xem và tải ngay bản đầy đủ của tài liệu tại đây (448.76 KB, 14 trang )
Shear Strength Model for Reinforced Concrete
Columns with Low Transverse Reinforcement Ratios
Cao Thanh Ngoc Tran1,* and Bing Li2
1Department
of Civil Engineering, International University, Vietnam National University, Ho Chi Minh City, Vietnam
of Civil and Environment Engineering, Nanyang Technological University, Singapore
2School
(Received: 10 April 2012; Received revised form: 5 May 2014; Accepted: 16 May 2014)
Abstract: This paper introduces an equation developed based on the strut-and-tie
analogy to predict the shear strength of reinforced concrete columns with low
transverse reinforcement ratios. The validity and applicability of the proposed
equation are evaluated by comparison with available experimental data. The proposed
equation includes the contributions from concrete and transverse reinforcement
through the truss action, and axial load through the strut action. A reinforced concrete
column with a low transverse reinforcement ratio, commonly found in existing
structures in Singapore and other parts of the world was tested to validate the
assumptions made during the development of the proposed equation. The column
specimen was tested to failure under the combination of a constant axial load of
0.30 f c′ Ag and quasi-static cyclic loadings to simulate earthquake actions. The
analytical results revealed that the proposed equation is capable of predicting the shear
strength of reinforced concrete columns with low transverse reinforcement ratios
subjected to reversed cyclic loadings to a satisfactory level of accuracy
Key words: reinforced concrete columns, strut-and-tie, seismic, shear strength.
1. INTRODUCTION
The strut-and-tie analogy is a discrete modeling of
actual stress fields in reinforced concrete members. The
complex stress fields within structural components
resulting from applied external forces are simplified
into discrete compressive and tensile force paths. The
analogy utilizes the general idea of concrete in
compression and steel reinforcement in tension. The
longitudinal reinforcement in a beam or column
represents the tensile chord of a truss while the concrete
in the flexural compression zone is considered as part of
the longitudinal compressive chord. The transverse
reinforcement serves as ties holding the longitudinal
chords together. The diagonal concrete compression
struts, which discretely simulate the concrete
compressive stress field, are connected to the ties and
longitudinal chords at rigid nodes to attain static
equilibrium within the truss. This truss model provides
a convenient means of analyzing the strength of
reinforced concrete because it provides a visible
representation of the failure mechanism. Many
researchers have made significant contributions into the
development of truss models of reinforced concrete
beams subjected to shear and flexure. However, there is
limited effort focused on the utilization of truss models
to capture the shear strength of columns with low
transverse reinforcement ratios. The objective of this
paper is to propose a strut-and-tie model which is
capable of predicting the shear strength of columns with
low transverse reinforcement ratios.
The paper reported herein comprises two parts. The
first part presents the derivation of the equation used to
estimate the shear strength of reinforced concrete
columns with low transverse reinforcement ratios. The
validity and applicability of the proposed equation are
evaluated by comparison with available experimental
*Corresponding author. Email address: ; Tel: +848-946464649.
Advances in Structural Engineering Vol. 17 No. 10 2014
1373
Shear Strength Model for Reinforced Concrete Columns with Low Transverse Reinforcement Ratios
data. The second part examines the assumptions made
during the development of the proposed equation by
checking the capability of the model to predict the
experimental results obtained from the test of a
reinforced concrete column with low transverse
reinforcement ratio.
2. PREVIOUS DESIGN EQUATIONS FOR
SHEAR STRENGTH OF COLUMNS
2.1. ACI 318 (2008) Code Provisions
According to ACI 318 (2008), the shear strength of
reinforced concrete columns are calculated as:
Vn = Vc + Vs
(1)
P
Vc = 0.166 fc' 1 +
bd (MPa)
13.8 Ag
(2)
The contribution of truss mechanism is taken as:
Vs =
Av f yt d
s
(3)
2.2. Sezen and Moehle (2004)’s Equation
Sezen and Moehle (2004) developed a shear strength
model, which applies to columns with light transverse
reinforcement accounting for apparent strength
degradation associated with flexural yielding. The shear
strength based on Sezen and Moehle (2004)’s model is
defined as:
Vn = Vc + Vs = k
Av f y d
s
(MPa)
0.5 fc'
P
0.8 A
+k
1+
g
a/d
'
f
A
0
.
5
c g
Vn = Vc + Vs = k
1374
(4)
Av f y d
s
(psi)
6 fc'
P
0.8A
+k
1+
g
a/d
'
6 fc Ag
2.3. Priestley et al. (1994)’s Equation
Priestley et al. (1994) proposed an additive shear
strength equation:
V = Vc + Vs + Va
(6)
Vc = k fc' Ae
(7)
where
k depends on the displacement ductility factor µ∆, which
reduces from 0.29 (3.49) in MPa (psi) units for µ∆ ≤ 2.0
to 0.1 (1.2) in MPa (psi) units for µ∆ 4.0; and Ae is
taken as 0.8 Ag. The shear strength contribution by truss
mechanism is given by:
where
P
Vc = 2 fc' 1 +
bd (psi)
2000 Ag
where the parameter k is taken as 1 for displacement
ductility less than 2, as 0.7 for displacement ductility
more than 6 and varies linearly for intermediate
displacement ductility.
(5)
Vs =
Av f y hc
s
cot θ
(8)
where hc = the core dimension measured center-tocenter of the peripheral transverse reinforcements; and
θ = the angle of truss mechanism, taken as 30 degrees.
The shear strength enhancement by axial load is
given by:
Va = P tan α =
k1P ( h − x )
L
(9)
where L = column height; h = section height;
x = compression zone depth, determined from flexural
analysis; and k1 = 1.0 and 0.5 for double and single
column curvature respectively.
3. PROPOSED SHEAR STRENGTH MODEL
The concept of superposition of both truss and strut
actions in developing the shear strength model for
reinforced concrete columns has been previously
proposed by Watanabe and Ichinose (1991); and
Priestley et al. (1994). The truss action transfers shear
forces through the transverse reinforcement which act as
tension members and concrete struts running parallel to
the diagonal cracks act as compression members. The
strut action, on the other hand, transfers shear forces
directly through struts forming between centers of
flexural compression at the top and bottom of the
column. This shear force transfer mechanism concept is
applied herein to develop the new shear strength
equation.
Advances in Structural Engineering Vol. 17 No. 10 2014
Cao Thanh Ngoc Tran and Bing Li
3.1. Truss Mechanism
Dissimilar to Priestley et al. (1994)’s shear strength
model, in which the concrete contribution was
considered independently based on the tensile stress and
strain within transverse reinforcement, this paper
employs the tensile strain of transverse reinforcement as
an indirect parameter which incorporates the concrete
contribution into the shear strength of reinforced
concrete columns.
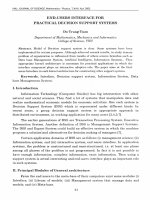
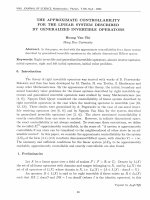
3.1.1. Concrete contribution
Shear carried by concrete has long been recognized as
an important portion of the shear strength of a
reinforced concrete member. Some research has tried to
use other parameters to represent this concrete
contribution. But amongst all these parameters,
transverse tensile stress and strain have prevailed
(Vecchio 1986). In this paper, the concrete contribution
is assumed as the amount of force transferred across
cracks, as shown in Figure 1. Transverse tensile stress
and strain were used to indirectly incorporate this
amount of force transferred across cracks into the shear
strength of reinforced concrete columns through the
compatibility conditions. By assuming a uniform
distribution of transverse reinforcement along cracks
and that the tensile strain in the transverse direction is
equal to the strain in the transverse reinforcement, the
tensile strain in the transverse direction can be
calculated as:
εx =
Vs
Vs s
=
jd cot θ Av Es jd cot θ
Es Av
s
(10)
The principal stress directions are the direction of
inclined strut, the angle θ measured from its longitudinal
direction to the direction perpendicular to it. At this stage,
the element has a compressive stress along the strut
direction and a tensile stress perpendicular to it. However,
the directions of the principal strains deviate from the
principal stress directions. Vecchio and Collins (1986)
have summarized a number of experimental data and found
that the direction of the principal strains only differed from
the principal stresses by ± 10°. Therefore, it is reasonable
to assume that the principal stress and strain directions for
an infinitesimal element of concrete coincide with each
other. The principal strain in the compressive direction is
readily determined by the stress and geometrical condition
of a strut as illustrated in Figure 2, thus,
ε1 = −
=−
(Vs /sin θ ) = − (Vs /sin θ )
Ec ( jd cos θ b )
Ec ( cstrut b )
Vs
(11)
jdbEc sin θ cos θ
with the known values of θ, εx, and ε1, a Mohr’s circle
can then be constructed as shown in Figure 3 to
calculate the tensile strain ε2, given below:
θ
εy
c
θ
ε2
jd
jd cot θ
εx
ε1
CStrut
vc
Vs
sinθ
θ
Vs
Figure 1. Local stresses and strains at a crack
Advances in Structural Engineering Vol. 17 No. 10 2014
Figure 2. Truss mechanism
1375
Shear Strength Model for Reinforced Concrete Columns with Low Transverse Reinforcement Ratios
2θ
ε1
sy
d by
smy = 2 c y + + 0.25k1
ρs
10
εx
εy
εx
where k1 is taken as 0.4 for deformed reinforced bars
and 0.8 for plain reinforcing bars.
The calculated vc from Eqn 13 is the shear stress
transferred at the crack surface. Hence, the shear
strength contributed from concrete is:
2θ
ε1
ε2
(a) θ _
< 45°
εy
ε2
(b) θ > 45°
Vc =
Figure 3. Compatible strain conditions in a reinforced
concrete element
2 (ε x − ε1 )
ε2 =
cos 2θ + 1
− ε1
(12)
This equation takes into consideration that θ may be
more than 45°.
Many researchers including Walraven (1981) have
concentrated on the experimental relationships between
the shear carried by concrete vc and the tensile strain ε2.
Vecchio and Collins (1986) derived the equation for the
limiting value of shear stress transferred across the
crack; the equation further used by Walraven (1981) in
his study is given below:
vc =
vc =
0.18 fc'
0.31 +
24 w
a' + 16
0.31 +
24 w
jdb
v sin θ = jdbvc
sin θ c
(18)
3.1.2. Transverse reinforcement contribution
Additional contribution to the truss mechanism from
transverse reinforcement can be defined as (ACI 2008):
Vs = cot θ Av f yt
d
s
(19)
The shear force carried by the truss mechanism is
assumed to reach its maximum value when the
transverse reinforcement yields. The yield strain of
transverse reinforcement can be reasonably taken as
0.002. Hence, the maximum shear force carried by the
truss mechanism is given by:
VT = Vc + Vs = jdb ( vc )ε
(MPa)
2.16 fc'
(17)
x
= 0.002
d
+ cot θ Av f yt (20)
s
If the inclination of compression strut θ and flexural
lever arm jd are assumed as 45° and 0.8d respectively,
Eqn 20 becomes:
(psi)
(13)
'
a + 0.63
Vc + Vs = 0.8db ( vc )ε
x = 0.002
d
+ Av f yt
s
(21)
The average crack width w can be taken as:
w = ε 2 sθ
(14)
where
sθ =
1
sin θ cos θ
+
smx
smy
(15)
and where smx and smy are the indicators of the crack
control characteristics of the transverse and longitudinal
shear reinforcement, respectively. According to the
provision of the CEB-FIP Code (1978):
d
s
smx = 2 cx + + 0.25k1 bx
ρv
10
1376
(16)
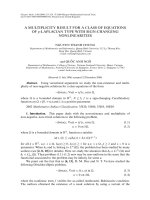
3.2. Strut Mechanism
There are similarities to the strut action of Priestley et al.
(1994)’s shear strength model, in which the beneficial
effects of axial load on shear strength were considered in
the proposed model through the strut action; although in
this model, ultimate compressive stress of the direct strut
was limited to cater for skew cracks along the columns.
The maximum shear force applied to the strut
mechanism is given as (Priestley 1994):
Va1 = P tan α
(22)
As shown in Figure 4, the shear strength of the direct
strut is calculated as:
Va 2 = Cu sin α
(23)
Advances in Structural Engineering Vol. 17 No. 10 2014
Cao Thanh Ngoc Tran and Bing Li
P
Va 2 = 0.2 fc' 0.25 + 0.85
h sin ( 2α )
Ag fc'
Vu
Cu sinα
The beneficial effect of axial load on shear strength in
this model is defined as:
Cu
Va = min {Va1 , Va 2 }
α
L
(28)
(29)
Then combining the Eqns 21 and 29, the shear
strength of reinforced concrete columns is given as:
W
Vn = Va + Vc + Vs
0.2 fc' 0.25 + 0.85 P
= min
Ag fc'
h sin ( 2α ) , P tan α
d
+ 0.8db ( vc )ε = 0.002 + Av f yt
x
s
c
(30)
Figure 4. Strut mechanism
(27)
4. VERIFICATION OF THE PROPOSED
SHEAR STRENGTH EQUATION
4.1. Experimental Database
Sezen and Moehle (2004) collected a database of
51 laboratory tests on reinforced concrete columns
representative of columns from older reinforced
buildings by applying a consistent set of criteria. All
specimens were subjected to unidirectional quasistatic cyclic lateral loading and had low transverse
reinforcement ratios (ρw) (less than 0.7%). Both
yielding of longitudinal reinforcement prior to loss of
lateral load capacity, and ultimate failure and
deformation capacity appears to be controlled by
shear mechanisms. The set of criteria applied in this
paper is similar to Sezen and Moehle (2004)’s with
the only exception being the lowered transverse
reinforcement the lower transverse reinforcement
ratios criterion was applied to ensure that the
assumption of yielding of transverse reinforcement at
the maximum shear force is satisfied. The database
includes columns satisfying the following criteria:
column aspect ratio, 1.8 ≤ a/d ≤ 4.0; concrete strength,
13 ≤ f c′ ≤ 50 (MPa); longitudinal and transverse
reinforcement nominal yield stress, fyt and fyl in the
range of 300–650 MPa; longitudinal reinforcement
ratio, 0.01 ≤ ρl ≤ 4.0; transverse reinforcement ratio,
0.0010 ≤ ρw ≤ 0.0031.
By substituting the Eqns 24, 25 and 26 into Eqn 23,
the shear strength of the direct strut becomes:
4.2. Discussion of Analytical Results
The validation of the proposed equation is
demonstrated by comparison with published
where
Cu = Wfu
(24)
Following Schaich et al. (1987) and Schlaich and
Schafer (1991)’s suggestions, the ultimate compressive
strength of the direct strut fu of 0.4 f c′ was chosen to cater
for skew cracks with extraordinary crack width. While
the effective depth, W, was calculated as:
W = c cos α
(25)
where the neutral axis depth c could be estimated
following Paulay and Priestley (1992)’s suggestion
P
c = 0.25 + 0.85
h
Ag fc'
(26)
Considering the geometrical condition, the direct
strut angle α is given as:
h − c
α = arctan
L
Advances in Structural Engineering Vol. 17 No. 10 2014
1377
Shear Strength Model for Reinforced Concrete Columns with Low Transverse Reinforcement Ratios
experimental results with respect to the maximum shear
force obtained from the test results. Details of the
reinforced concrete columns are shown in Table 1.
These columns encompass a wide range of cross
sectional sizes, material properties, and axial loads. It
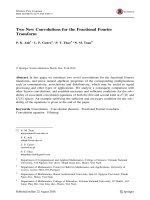
was found that the average ratio of the experimental to
predicted shear strength by the proposed equation is
1.033 as shown in Figure 5 and Table 1, showing a
good correlation between the proposed equation and
experimental data. The shear strengths of columns in
the database calculated based on ACI 318 (2008),
Sezen and Moehle (2004), and Priestley et al. (1994)
are also showed in Table 1. The mean ratio of the
experimental to predicted strength and its coefficient of
variation are 1.108 and 0.204, 1.022 and 0.171, and
0.740 and 0.128 for ACI 318 (2008), Sezen and Moehle
(2004), and Priestley et al. (1994), respectively.
Comparison of available models with experimental data
indicates that Sezen and Moehle (2004) model and the
proposed model produce better mean ratio of the
experimental to predicted strength and its coefficient of
variation than ACI 318 (2008), Sezen and Moehle
(2004), and Priestley et al. (1994) model. Both Sezen
and Moehle (2004) model and the proposed model may
be suitable as an assessment tool to calculate the shear
strength of reinforced concrete columns with low
transverse reinforcement ratios which have similar
detailing in the database.
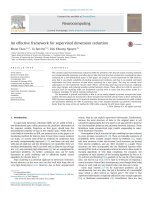
To investigate the validity and applicability of the
proposed equation across the range of several key
parameters including axial load, aspect ratio,
compressive strength of concrete and transverse
reinforcement ratio, the ratio of experimental shear
strength, Vu to shear strength calculated from the
proposed Eqn 30 versus axial load [P/(Ag f c′ )], aspect
ratio (a/d), transverse reinforcement index (ρw fyt / f c′ ) is
plot in Figure 6. The good correlation between the
experimental and predicted strengths across the range of
axial load, aspect ratio, transverse reinforcement index
indicates that the proposed model well represents the
effects of these key parameters.
The effect of displacement ductility demand on the
shear strength of reinforced concrete columns has
been recognized and incorporated into the shear
strength equations previously by some researchers
[e.g., Priestley et al. (1994); Sezen and Moehle
(2004)]. Priestley et al. (1994) proposed the model in
which concrete contribution to shear strength reduces
with increasing displacement ductility demand,
whereas Sezen and Moehle (2004) suggested both
concrete and steel contributions are reduced with
increasing displacement ductility demand. The
proposed model propounds that when the tensile strain
1378
of transverse reinforcement increases, the concrete
contribution to the shear strength decreases. Once the
transverse reinforcement reaches its yield strength, the
increase of displacement ductility will lead to a
reduction of VT in Eqn 20 due to constant value of Vs
and reduction of Vc in Eqn 20. Hence, the proposed
model could be used to qualitatively explain the effect
of displacement ductility demand on the shear
strength of reinforced concrete columns. In order to
quantitatively investigate the effect of displacement
ductility demand on the shear strength of reinforced
concrete columns by the proposed model, the
relationship between tensile strain of transverse
reinforcement versus displacement ductility is needed.
The difficulty in establishing this relationship
prevents the proposed model from being able to
quantitatively incorporate the effect of displacement
ductility.
4.3. Uncertainties of the Proposed Model
In the proposed model, the complicated shear
resisting mechanisms in reinforced concrete columns
with low transverse reinforcement ratios are
simplified into truss and strut mechanisms; hence,
several uncertainties in the proposed model can be
expected. The direct strut forming between the
centers of flexural compression at the top and bottom
of the columns is an imaginary stress field which
helps to explain certain experimental observations.
Currently, there are no physical evidences which help
to explain the existence of this direct strut. In the
proposed model, the effect of column axial load is
incorporated through the use of the direct strut which
could be one of the uncertainties. Furthermore, the
assumptions of a 45° crack angle and yielding of
transverse reinforcements are not always true for all
cases of the specimens in the database. For
simplicity, ACI 318 code (2008)’s 45° crack angle
assumption is adopted in the proposed model.
However, this assumption may lead to an
underestimation of the contribution from the shear
reinforcement. All empirical results indicate that
crack angle is not a constant value. The effects of
several parameters such as transverse reinforcement
ratio, axial load, longitudinal reinforcement and
compressive concrete strength on the crack angle are
inconclusive. Further study is required to
mathematically calculate the crack angle to enhance
the accuracy of the proposed model. In addition, the
validity of the assumption of uniform distribution of
transverse reinforcements along the crack relies on
the position of crack along the column. This could be
an additional uncertainty in the proposed model.
Advances in Structural Engineering Vol. 17 No. 10 2014
Advances in Structural Engineering Vol. 17 No. 10 2014
27.0
27.0
45.0
17.7
17.7
17.7
32.9
14.8
13.1
13.9
13.1
S1-0.0-N
S2-0.0-N
BR-S1
205
207
214
200
231
232
233
234
0.22
0.22
0.55
0.12
0.26
0.23
0.24
0.24
0.13
0.10
0.10
0.15
0.61
0.15
200
200
200
200
200
200
200
200
550
300
300
457
457
457
200
200
200
200
200
200
200
200
550
300
300
457
457
457
180
180
180
180
180
180
180
180
482
251
251
394
394
394
600
400
600
400
400
400
400
400
1485
450
450
1473
1473
1473
1473
1473
1473
1473
1473
1473
1473
1473
21.1
21.1
21.8
381
381
381
381
381
381
381
381
2CLD12
2CHD12
2CLD12M
457
457
457
457
457
457
457
457
0.09
0.09
0.07
0.07
0.28
0.26
0.26
0.28
25.6
25.6
33.1
33.1
25.7
27.6
27.6
25.7
3CLH18
3SLH18
2CLH18
2SLH18
2CMH18
3CMH18
3CMD12
3SMD12
457
457
457
457
457
457
457
457
P
h
b
d
a
Agfc' (mm) (mm) (mm) (mm)
f c′
Specimen (MPa)
Column section
3.33
2.22
3.33
2.22
2.22
2.22
2.22
2.22
3.08
1.79
1.79
3.74
3.74
3.74
3.87
3.87
3.87
3.87
3.87
3.87
3.87
3.87
a
d
Longitudinal
reinforce
ment
0.28
0.28
0.14
0.11
0.13
0.13
0.13
0.13
0.10
0.26
0.21
0.17
0.17
0.17
0.07
0.07
0.07
0.07
0.07
0.07
0.17
0.17
225.4
225.4
252.9
252.9
282.1
287.6
351.8
342.0
Umemura and Endo (Sezen 2004)
100
324
2.0
462
71
100
324
2.0
462 106
200
324
2.0
462
83
120
648
1.0
379
78
100
524
1.0
324
51
100
524
1.0
324
58
100
524
1.0
372
69
100
524
1.0
372
67
300
64.9
64.9
59.3
69.6
54.5
52.7
53.5
52.7
535.1
66.8
83.8
64.4
89.2
73.2
71.3
72.2
71.3
285.0
409.0
285.0
206.4
206.4
224.9
224.9
273.5
275.8
352.3
346.4
546.1
271.0
267.0
240.0
231.0
316.0
338.0
356.0
378.0
Yalcin (Sezen 2004)
425
2.0
445 578
Lynn (2001)
3.0
331
3.0
331
2.0
331
2.0
331
2.0
331
3.0
331
3.0
331
3.0
331
227.6
211.9
400
400
400
400
400
400
400
400
Sezen (2002); Sezen and Moehle (2006)
305
476
2.5
438 315.0 317.0
305
476
2.5
438 359.0 410.0
305
476
2.5
438 294.0 317.0
Lee (2006)
180
400
2.4
400 216
156.8
225
400
2.4
400 200
140.9
457
457
457
457
457
457
305
305
96.4
107.4
76.1
110.1
85.8
84.6
90.4
89.4
757.6
271.3
249.6
466.9
551.3
456.9
353.6
353.6
389.3
389.3
428.7
448.1
554.8
510.1
74.7
83.2
54.6
87.4
59.5
57.3
60.8
59.5
514.3
218.3
200.2
313.7
299.8
317.6
223.8
223.8
246.7
246.7
226.8
244.9
333.1
323
ρl
ρw
s
fyt
fyl
Vu VACI VSezen Vpriestley Vproposed
(%) (mm) (MPa) (%) (MPa) (kN) (kN) (kN)
(kN)
(kN)
Transverse
reinforce
ment
Table 1. Experimental verification
1.094
1.634
1.401
1.121
0.935
1.100
1.290
1.271
1.08
1.377
1.418
0.994
0.876
0.928
1.202
1.185
0.949
0.913
1.120
1.175
1.012
1.105
1.063
1.264
1.289
0.874
0.697
0.814
0.956
0.94
1.058
0.949
0.943
1.105
0.878
1.032
1.312
1.294
1.067
1.027
1.155
1.225
1.01
1.092
0.95
1.274
1.441
0.892
0.857
1.012
1.135
1.126
1.124
0.989
0.999
1.004
1.197
0.926
1.211
1.193
0.973
0.936
1.393
1.38
1.069
1.17
(Continued)
0.737
0.987
1.091
0.708
0.600
0.686
0.763
0.750
0.763
0.796
0.801
0.675
0.651
0.643
0.766
0.756
0.617
0.594
0.737
0.737
0.642
0.741
Vu
Vu
Vu
Vu
VACI VSezen Vpriestley Vproposed
Cao Thanh Ngoc Tran and Bing Li
1379
1380
19.6
19.6
19.6
19.6
19.6
19.6
19.6
49.3
43
44
45
46
62
63
64
SC01
0.30
0.10
0.10
0.20
0.20
0.10
0.20
0.20
0.45
0.45
350
200
200
200
200
200
200
200
200
200
350
200
200
200
200
200
200
200
200
200
301
173
173
173
173
173
173
173
170
170
850
500
500
500
500
500
500
500
500
500
500
500
21.9
21.9
170
170
452
452
200
200
0.20
0.20
19.9
20.4
372
372
200
200
P
h
b
d
a
Agfc' (mm) (mm) (mm) (mm)
f c′
Specimen (MPa)
Column section
2.82 0.13
0.28
0.28
0.28
0.28
0.28
0.28
0.28
2.94 0.31
2.94 0.31
2.89
2.89
2.89
2.89
2.89
2.89
2.89
Longitudinal
reinforce
ment
125
97.1
97.1
98.5
98.5
88.8
83.1
83.1
88.3
89.3
78.5
84
300.1
Average
Coefficient of variation
408.9
Current Experiment
393
3.2
409 357.1 320.5 309.5
83.0
83.0
86.7
86.7
75.2
78.7
78.7
118.4
118.4
125.0
125.0
106.8
110.4
110.4
74
77
82
81
58
69
69
109.9
109.9
107.7
108.2
87.7
87.7
94.8
94.8
79.8
86.8
86.8
Ikeda (Sezen 2004)
558
2.0
434
558
2.0
434
558
2.0
434
558
2.0
434
476
2.0
348
476
2.0
348
476
2.0
348
91.4
91.4
Kokusho and Fukuharo (Sezen 2004)
100
317
3.0
395
110 78.6
100
317
4.0
395
110 78.6
100
100
100
100
100
100
100
77.4
77.8
Kokusho (Sezen 2004)
352
1.0
524
74
352
2.0
524
88
69.3
69.8
100
100
ρl
ρw
s
fyt
fyl
Vu VACI VSezen Vpriestley Vproposed
(%) (mm) (MPa) (%) (MPa) (kN) (kN) (kN)
(kN)
(kN)
2.94 0.31
2.94 0.31
a
d
Transverse
reinforce
ment
Table 1. Experimental verification
1.149
1.108
0.204
0.891
0.928
0.946
0.935
0.771
0.876
0.876
1.399
1.399
1.068
1.261
1.153
1.022
0.171
0.844
0.878
0.865
0.855
0.727
0.795
0.795
1.203
1.203
0.956
1.131
0.873
0.740
0.128
0.625
0.650
0.656
0.648
0.570
0.625
0.625
1.001
1.001
0.687
0.813
1.190
1.033
0.194
0.762
0.793
0.832
0.822
0.653
0.83
0.83
1.246
1.232
0.943
1.048
Vu
Vu
Vu
Vu
VACI VSezen Vpriestley Vproposed
Shear Strength Model for Reinforced Concrete Columns with Low Transverse Reinforcement Ratios
Advances in Structural Engineering Vol. 17 No. 10 2014
Cao Thanh Ngoc Tran and Bing Li
Vproposedv (kip)
0.0
700
22.5
45.0
67.5
89.9 112.4 134.9 157.4
157.4
2.0
134.9
1.0
500
112.4
400
89.9
300
67.5
0.5
200
45.0
100
22.5
0
0
100
200
300
400
Vproposed (kN)
500
600
Vu (kip)
Vu (kN)
600
0.0
700
Figure 5. Correlation of experimental and predicted shear strength
based on the proposed equation
5. EXPERIMENTAL STUDY
5.1. Specimen and Test Procedure
To investigate several assumptions made within the
development of the shear strength model, a large-scale
reinforced concrete column with a low transverse
reinforcement ratio, which satisfies the set of criteria
used to establish the database, was constructed and
tested. Figure 7 illustrates the schematic dimensions and
detailing of the specimen. A schematic of the loading
apparatus is shown in Figure 8. A reversible horizontal
load was applied to the top of the column using a doubleacting 1000 kN capacity long-stroke dynamic actuator
which was mounted onto a reaction wall. The actuator
was pinned at both ends to allow rotation during the test.
The base of the column was fixed to a strong floor with
four post-tensioned bolts. The axial load was applied to
(a)
Vu / Vproposed
2
1.5
1
0.5
0
0
0.1
0.2
0.3
0.4
0.5
0.6
0.7
P/ (Agf'c)
(b)
Vu / Vproposed
2
1.5
1
0.5
0
1.5
2
2.5
3
3.5
4
Aspect ratio (a/d)
(c)
Vu/ Vproposed
2
1.5
1
0.5
0
0
0.02
0.04
0.06
0.08
0.1
ρwfyt/f'c
Figure 6. Variation of experimental to predicted strength ratio as a function of key parameters
Advances in Structural Engineering Vol. 17 No. 10 2014
1381
Shear Strength Model for Reinforced Concrete Columns with Low Transverse Reinforcement Ratios
400
135 degree hook
350
350
350
R6
350
8-T25
500 mm R6 – 125 mm spacing
30 mm clear cover
600 mm R6 – 200 mm spacing
1700
500 mm R6 – 125 mm spacing
350
T10
T20
350
800
900
Figure 7. Reinforcement details of test specimen (in mm)
L-shaped steel frame
Reaction wall
100 ton actuator
100 ton
actuator
1700
2650
100 ton actuator
Strong floor
Figure 8. Test setup (in mm)
the column using two double-acting 1000 kN capacity
dynamic actuators through a transfer beam. The typical
loading procedure is illustrated in Figure 9.
5.2. Experimental Results and Discussions
Figure 10 shows the load-displacement hysteresis loops
of the specimen. The hysteresis loops show the
degradation of stiffness and load-carrying capacity during
repeated cycles due to the cracking of the concrete and
yielding of the steel reinforcement. The low attainment of
stiffness and strength were attributed to the shear cracks
along the specimens. Pinching was seen in the hysteresis
loops of the specimen when a drift ratio of 1.0% was
applied, leading to limited energy dissipation as shown in
Figure 10. The specimen reached its maximum horizontal
strength in the first cycle at a drift ratio of 1.0%. At the
next drift ratio of 1.33%, the peak lateral load attained
was only 82.3% of the maximum recorded value of the
specimen. Continuous cycles caused additional damage
and loss of lateral resistance. During the first push cycle
1382
at a drift ratio of 2%, the column failed catastrophically
due to the failure of its transverse reinforcements. At this
stage, the applied axial load dropped suddenly from
1804 kN to 400 kN showing the brittle behavior of the
specimen caused by its low transverse reinforcement
ratio. The maximum shear strength obtained from the
specimen was 357.1 kN, whereas the value obtained by
the proposed equation was 300.5 kN.
Figure 11 illustrates the formation of the cracking
patterns of the specimen. At a drift ratio of 0.25%,
flexural cracks were found at the bottom and top of the
column. The inclined bending-shear cracks at the
bottom and top of the column, which were formed at a
drift ratio of 0.67%, were believed to be the extension of
these flexural cracks. Shear cracks occurred at a drift
ratio of 0.67% and started to develop rapidly at drift
ratio of 1.0% which continued to expand as the loading
progressed. Limited new flexural cracks along the
specimen were observed when a drift ratio was
increased to 1.0%. Failure accompanied by gradual
stiffness degradation of the column occurred due to
extensive opening of the shear cracks. In development
of the proposed model, the crack angle is assumed as
45°, whereas the measured crack angle at the maximum
shear force state is 35°. Using the experimental crack
angle, 35° to predict the shear strength based on the
proposed model obtains 354.6 kN. The ratio of
experimental shear strength to predicted shear strength
based on experimental crack angle is 1.007. The
improvement in predicting the shear strength based on
experimental crack angle is obtained. This indicates the
uncertainty of the proposed model when the crack angle
Advances in Structural Engineering Vol. 17 No. 10 2014
Cao Thanh Ngoc Tran and Bing Li
40
1.57
DR = 1/55
Displacement (mm)
0
0
1
2
3
4
5
6
7
8
9
1.18
0.79
0.40
0.00
10 11 12 13 14 15 16 17 18 19 20
−10
−0.39
−20
−0.78
−30
−1.18
Displacement (in)
DR = 1/75
DR = 1/100
DR = 1/150
DR = 1/200
DR = 1/300
20
DR = 1/400
DR = 1/600
DR = 1/1000
10
DR = 1/2000
30
−1.57
−40
Cycle number
Figure 9. Loading procedure
0
0.0
−200
−400
−45.0
−89.9
Drift ratio
2.0%1.5%1.0%0.5%
−600
0
10 20
−40 −30 −20 −10
Displacement (mm)
30
40
−134.9
Strain gauge position (mm)
Figure 10. Hysteresis loops of specimen SC01
Lateral load (kip)
Lateral load (kN)
44.9
200
is assumed to be 45°. Further study is required to refine
the proposed model to take into account varied crack
angles, to enhance the accuracy of the proposed model.
Figure 12 shows the measured strain distribution of
the longitudinal reinforcements along the height of the
column of the specimen. It was observed that the
distribution of strain along the longitudinal
reinforcements varied considerably with an increase in
lateral load. With reference to this strain profile, no
tensile yielding of the longitudinal bars was observed
during the tests, thus indicating the dominance of shear
failure behavior of the specimen. The largest tensile
strain of the specimen was detected at 250 mm away
from the fixed-end. The tensile strains within
longitudinal bars initially increased with increasing drift
ratio, apparently owing to the growth of flexural cracks
at top and bottom of the column but eventually these
strains began to reduce as shown in Figure 12.
900
35.4
600
23.6
300
0
(b) At axial failure
Figure 11. Cracking patterns of specimen SC01
Advances in Structural Engineering Vol. 17 No. 10 2014
11.8
Column mid-height
0
−300
−11.8
−23.6
−600
−900
−3000
(a) At the maximum shear force
DR = 0.50% (1)
DR = 0.67% (1)
DR = 1.00% (1)
DR = 1.33% (1)
DR = 1.82% (1)
Strain gauge position (in)
Displacement (in)
−1.57−1.18−0.79−0.39 0.00 0.39 0.79 1.18 1.57
600
134.9
0.5% 1.0%1.5% 2.0%
Drift ratio
400
89.9
εy
−2000
εy
−1000
0
1000
2000
−35.4
3000
Strain (x10−6)
Figure 12. Local strains in longitudinal bars of specimen SC01
1383
900
35.4
600
23.6
300
11.8
Column mid-height
0
−300
−600
−900
−1000
0
1000
2000
0.0
−11.8
DR = 0.50%(1)
DR = 0.67%(1)
DR = 1.00%(1) −23.6
DR = 1.33%(1)
εy
DR = 1.82%(1)
−35.4
3000
4000
5000
Strain (x10−6)
Figure 13. Local strains in steel links of specimen SC01 in the
direction parallel to the lateral load direction
1384
Hoop position (in)
Hoop position (mm)
900
35.4
600
23.6
300
11.8
Column mid-height
0
DR = 0.50% (1)
DR = 0.67% (1)
DR = 1.00% (1)
DR = 1.33% (1)
DR = 1.82% (1)
−300
−600
εy
−900
−1000
0
1000
2000
0.0
−11.8
Hoop position (in)
Figure 13 shows the measured strain distribution of
the transverse reinforcement in the direction parallel
to the lateral load direction along the height of the
column of the specimen. It was observed that
the distributions of strains along the transverse
reinforcement varied considerably with the increase
of lateral load and increased with increasing drift
ratio. With reference to this strain profile, yielding of
the transverse steel bars was observed at a drift ratio
of 1.33%. The largest tensile strain was detected at
240 mm away from the fixed-end. It was observed
that the transverse strain suddenly increased at a drift
ratio of 1.33% owing to the growth and opening of
shear cracks along the column. The yielding of
transverse reinforcement is assumed in the
development of the proposed model. However, as
shown in Figure 13, when the specimen reached its
maximum shear force, no yielding of transverse
reinforcement was observed. It is also noticeable that
the measured strains are localized strains along
transverse steel bars. Yielding of transverse steel bars
may occur elsewhere, such as at the shear crack
locations. The measured strain distribution of the
transverse reinforcement in the direction
perpendicular to the lateral load direction is shown in
Figure 14. It was observed that there was a sudden
increase in the strain distribution within the
transverse reinforcement in the direction
perpendicular to the lateral load direction, at a drift
ratio of 1.82%. With reference to this strain profile,
yielding of the transverse steel bars in the direction
perpendicular to the lateral load direction was
observed only at a drift ratio of 1.82%.
Hoop position (mm)
Shear Strength Model for Reinforced Concrete Columns with Low Transverse Reinforcement Ratios
−23.6
−35.4
3000
Strain (x10−6)
Figure 14. Local strains in steel links of specimen SC01 in the
direction perpendicular to the lateral load direction
5. CONCLUSIONS
Based on the results of this study, the following
conclusions can be drawn:
The complicated shear resisting mechanism in
reinforced concrete columns with low transverse
reinforcement ratios can be analyzed by the proposed
equation, which was derived from the strut-and-tie
model and incorporated concrete contribution. The
proposed equation provides a good estimate of the
shear strength of reinforced concrete columns with low
transverse reinforcement ratios in the database with the
average ratio of experimental to predicted shear
strength of the 34 shear-critical reinforced concrete
columns being 1.033. The proposed equation can be
utilized to determine shear strength of reinforced
concrete columns with low reinforcement ratios that
exhibit shear failure behaviors.
A full-scale reinforced concrete column with a low
transverse reinforcement ratio, which is commonly
found in existing structures in Singapore and other parts
of the world, was tested under a constant axial load,
0.30 f c′ Ag and quasi-static cyclic loadings simulating
earthquake actions to further validate the proposed
model. The experimental results show improvement in
predicting the shear strength of the test column based
on the experimental crack angle; the ratio of
experimental shear strength to predicted shear strength
based on the experimental crack angle is 1.007.
ACKNOWLEDGEMENTS
This research is funded by Vietnam National
Foundation for Science and Technology Development
(NAFOSTED) under grant number 107.01-2013.12.
Advances in Structural Engineering Vol. 17 No. 10 2014
Cao Thanh Ngoc Tran and Bing Li
REFERENCES
ACI 318 (2008). Building Code Requirements for Structural
Concrete and Commentary, American Concrete Institute,
Michigan, USA.
CEB-FIP (1978). Model Code for Concrete Structures, ComiteEuro-International du Beton/Federation Internationale de la
Precontrainte, Paris, France.
Lee, H.H. (2006). “Shear strength and behavior of steel fiber
reinforced concrete columns under seismic loading”, Engineering
Structures, Vol. 29, No. 7, pp. 1253–1262.
Lynn, A.C. (2001). Seismic Evaluation of Existing Reinforced
Concrete Building Columns, PhD Thesis, Department of Civil
and Environmental Engineering, University of California,
Berkeley, California, USA.
Paulay, T. and Priestley, M.J.N. (1992). Seismic Design of
Reinforced Concrete Masonry Buildings, John Willey & Sons,
New York, USA.
Priestley, M.J.N., Verma, R. and Xiao, Y. (1994). “Seismic shear
strength of reinforced concrete columns”, Journal of Structural
Engineering, ASCE, Vol. 120, No. 7, pp. 2310–2329.
Schlaich, J. and Schafer, K. (1991). “Designs and detailing of
structural concrete using strut-and-tie models”, The Structural
Engineer, Vol. 69, No. 6, pp. 113–125.
Schlaich, J., Schafer, K. and Jennewein, M. (1987). “Toward a
consistent design of structural concrete”, PCI Journal, Vol. 32,
No. 3, pp. 74–150.
Sezen, H. (2002). Seismic Response and Modeling of Reinforced
Concrete Building Columns, PhD Thesis, Department of Civil
and Environmental Engineering, University of California,
Berkeley, California, USA.
Sezen, H. and Moehle, J. (2004). “Shear strength model for lightly
reinforced concrete columns”, Journal of Structural Engineering,
ASCE, Vol. 130, No. 11, pp. 1692–1703.
Advances in Structural Engineering Vol. 17 No. 10 2014
Sezen, H. and Moehle, J. (2006). “Seismic tests of concrete columns
with light transverse reinforcement”, ACI Structural Journal,
Vol. 103, No. 6, pp. 842–849.
Vecchio, F.J. and Collins, M.P. (1986). “The modified compressionfield theory for reinforced concrete elements subjected to shear”,
ACI Journal Proceedings, Vol. 83, No. 2, pp. 219–231.
Walraven, J.C. (1981). “Foundamental analysis of aggregate
interlock”, Journal of the Structural Division, ASCE, Vol. 107,
pp. 2245–2270.
Watanabe, F. and Ichinose, T. (1991). “Strength and ductility design
of RC members subjected to combined bending and shear”,
Proceedings of Workshop on Concrete in Earthquake, University
of Houston, Texas, USA, pp. 429–438.
NOTATION
f c′
compressive strength of concrete
Vn nominal shear strength of columns
P
applied axial load
b
width of columns
h
depth of columns
fyt
yield strength of transverse reinforcement
d
distance from the extreme compression fiber to
centroid of tension reinforcement
s
spacing of transverse reinforcement
Av total transverse reinforcement area within spacing s
θ
the inclination of compression struts
Vc shear force carried by concrete
Vs
shear force carried by transverse reinforcement
Va shear force carried by strut mechanism
Ag cross sectional area
k
parameter depends on the displacement ductility
demand
a/d aspect ratio
1385