DSpace at VNU: Longitudinal and cross sectional assessments of health utility in adults with HIV AIDS: a systematic review and meta-analysis
Bạn đang xem bản rút gọn của tài liệu. Xem và tải ngay bản đầy đủ của tài liệu tại đây (1.09 MB, 16 trang )
Tran et al. BMC Health Services Research (2015) 15:7
DOI 10.1186/s12913-014-0640-z
RESEARCH ARTICLE
Open Access
Longitudinal and cross sectional assessments of
health utility in adults with HIV/AIDS: a systematic
review and meta-analysis
Bach Xuan Tran1,2*†, Long Hoang Nguyen3†, Arto Ohinmaa4, Rachel Marie Maher2, Vuong Minh Nong2
and Carl A Latkin1
Abstract
Background: Utility estimates are important health outcomes for economic evaluation of care and treatment
interventions for patients with HIV/AIDS. We conducted a systematic review and meta-analysis of utility measurements
to examine the performance of preference-based instruments, estimate health utility of patients with HIV/AIDS by
disease stages, and investigate changes in their health utility over the course of antiretroviral treatment.
Methods: We searched PubMed/Medline, Cochrane Database of Systematic Review, NHS Economic Evaluation
Database and Web of Science for English-language peer-reviewed papers published during 2000–2013. We selected 49
studies that used 3 direct and 6 indirect preference based instruments to make a total of 218 utility measurements.
Random effect models with robust estimation of standard errors and multivariate fractional polynomial regression were
used to obtain the pooled estimates of utility and model their trends.
Results: Reliability of direct-preference measures tended to be lower than other types of measures. Utility elicited by
two of the indirect preference measures - SF-6D (0.171) and EQ-5D (0.114), and that of Time-Trade off (TTO) (0.151) was
significantly different than utility elicited by Standard Gamble (SG). Compared to asymptomatic HIV patients, symptomatic
and AIDS patients reported a decrement of 0.025 (p&#×2009;=&#×2009;0.40) and 0.176 (p&#×2009;=&#×2009;0.001) in
utility scores, adjusting for method of assessment. In longitudinal studies, the pooled health utility of HIV/AIDS
patients significantly decreased in the first 3 months of treatment, and rapidly increased afterwards. Magnitude of
change varied depending on the method of assessment and length of antiretroviral treatment.
Conclusion: The study provides an accumulation of evidence on measurement properties of health utility estimates
that can help inform the selection of instruments for future studies. The pooled estimates of health utilities and their
trends are useful in economic evaluation and policy modelling of HIV/AIDS treatment strategies.
Keywords: Quality of life, Utility, HIV, Longitudinal meta-analysis, Systematic review
Background
The rapid scale-up of antiretroviral treatment (ART) services globally has brought about substantial progress in
care and treatment for HIV+ patients, transforming HIV/
AIDS from a terminal illness into a chronic illness [1,2].
With ART, patients can be socially and economically productive, and thus have not only a longer life, but also a
* Correspondence:
†
Equal contributors
1
Johns Hopkins Bloomberg School of Public Health, Baltimore, MD, USA
2
Institute for Preventive Medicine and Public Health, Hanoi Medical
University, Hanoi, Vietnam
Full list of author information is available at the end of the article
better quality of life. Given this change in the nature of the
disease, monitoring of HIV treatment must consider not
only the prevention of death but also the maximization of
the patients’ quality of life. Traditionally, monitoring HIV
treatment has considered medical outcomes and objective
indicators, such as treatment retention, viral load, CD4
levels and death [3]. However, health-related quality of life
(HRQL) has become a crucial complementary indicator
for monitoring health services and patient-related outcomes, and evaluating effectiveness of health interventions
in HIV+ populations. Since HIV disease has social and
© 2015 Tran et al.; licensee BioMed Central. This is an Open Access article distributed under the terms of the Creative
Commons Attribution License ( which permits unrestricted use, distribution, and
reproduction in any medium, provided the original work is properly credited. The Creative Commons Public Domain
Dedication waiver ( applies to the data made available in this article,
unless otherwise stated.
Tran et al. BMC Health Services Research (2015) 15:7
structural components, it is important to have measures
that can capture this complexity.
While in general quality of life is an abstract concept
that is difficult to quantify, health-related quality of life
(HRQL) is a concept that researchers and clinicians have
used to assess a patients’ ability to function in their daily
life and their perceived well-being [4]. Many different
tools have been developed for the measurement of
HRQL, and although they vary widely, it is common that
HRQL is multi-dimensional that captures all the relevant
areas of a patient’s life, including physical health, mental
health and functioning, social interaction and role functioning, and general well-being [5]. HRQL can be assessed
using generic or condition specific measures. Generic
measures are those that are applicable to the general
population and large variety of diseases, while conditionspecific measures are concerned with issues and symptoms involved with a specific disease. Generic measures
can typically be categorized as health status profiles, in
which each domain of a patients’ HRQL is scored separately, or as preference-based HRQL (utility) measures, in
which patients’ individual scores are preference weighted
to achieve an aggregate single score [6]. In health assessment, utility is defined as “a cardinal measure of the preference for, or desirability of, a specific level of health
status or specific health outcome”. Utility is defined as a
function of health status and the consumption of goods,
services, and leisure over a specified period of time [7].
Utility measures are classified by two major approaches:
the direct and indirect preference. Direct preference-based
measures ask the patients about the value they attach to
their current subjective health states. Meanwhile, indirect
preference-based approaches use preferences from other
samples, usually from general population, to generate preference index scores for hypothetical health states from a
HRQOL instrument [8].
Various generic and disease-specific HRQL measures
have been applied in HIV populations [5,9-11], most of
which, however, were developed before the advent of
ART. As a result, the breadth of these measures might
include aspects of HRQL which are now less relevant,
while lack increasingly important issues in HIV care and
treatment [11]. For example, HIV patients may have
concerns with sexual functioning, stigma, or body image,
and their HRQL may be negatively affected by some of
the side-effects of antiretroviral medication [5,9]. In
addition, some important methodological considerations
of HRQL measures have emerged, such as their sensitivity or responsiveness, and the appropriateness of repeated use in HIV populations [12]. Since many clinical
interventions for HIV patients result in small, but significant changes, it is important that HRQL measures used in
HIV/AIDS populations are sensitive to such treatment
changes [9]. Additionally, since HIV is a progressive and
Page 2 of 16
episodic disease, with different symptoms appearing at different times, any HRQL tool must also be responsive to
patients’ disease states over time. Finally, the ability of a
tool to capture changes in HRQL over time is complicated
by the fact that patients often get acclimated to their own
disease state, and thus rate their current health as higher
although there has not been any change in clinical health
status [3].
One of the most important uses of HRQL assessments
in the sphere of HIV/AIDS is in decision making about the
effectiveness and cost-effectiveness of treatments and interventions [13]. Generic, preference-based measures provide
a single summary score of HRQL outcomes, an integral
part of the quality-adjusted life-year (QALY) estimation, a
measure which has been widely used in cost-effectiveness
analyses of health interventions [8,14]. Although utility approaches have been increasingly applied in HIV interventions [15-18], measurements indicate a wide range of
scores and use a wide range of methods [15,16]. Therefore, pooled estimates of utility measures both aggregate
this data and maximize their external validity, making
them more relevant and useful for policy makers, and
researchers making economic evaluations of HIV interventions [19].
Previous reviews have compared various instruments in
HIV studies [9,11,12,20], however, they did not sufficiently
identify the applications of preference-based HRQL measures [9,11,21], nor examine the longitudinal changes in
HRQL over time of these measures [16]. We hypothesized
that the choices of indirect- and direct- preference based
HRQL measures might yield significantly different utility
scores, and that utility of patients deteriorated as the disease progressed, and could be improved given antiretroviral treatment. The objectives of this study were to
systematically review utility measures applied in HIV studies, estimate health utility of HIV/AIDS patients by disease
stages, and investigate changes in their health utility over
the course of antiretroviral treatment.
Methods
Eligibility criteria
This review followed the PRISMA (Preferred Reporting
Items for Systematic Reviews and Meta-Analyses) guidelines when selecting studies for inclusion [22]. Studies
were included if 1) they were written in English in the
period of 2000 up to February 2014 and accessed following our search strategy; 2) they were longitudinal or crosssectional design studies, employing preference-based
instruments of health utility and reporting the composite
score of health utility, 3) their sample included adult participants (≥18 years old) and 4) their full-text articles were
available. To minimize the file-drawer effect, we contacted
principle investigators of studies on health utility and
HIV/AIDS identified but no paper or report published. In
Tran et al. BMC Health Services Research (2015) 15:7
addition, we specifically searched for current well-known
utility measures that have been applied to HIV populations, including indirect utility measures such as: EuroQol
(EQ-5D-3L and EQ-5D-5L), Health utility index (HUI),
Quality of Wellbeing (QWB), Short form-6D (SF-6D),
15D; and direct utility measures such as: Standard Gamble
(SG), Time trade-off (TTO) and Visual Analogue Scale
(VAS). Studies were excluded if they 1) were letters, opinion pieces, editorials, ecological studies, abstracts, and
conference proceedings and full reports were not available;
2) were systematic review or meta-analysis studies; 3) used
non-utility measures and 4) reported health utility from
proxies (e.g. doctors or caregivers). Due to accessibility,
we limited our search strategies only for English-language
papers. Since a previous study by Tengs and Lin did
synthesize utility estimates among HIV/AIDS patients till
2000, we restricted our search for those studies published
after 2000 [16].
Page 3 of 16
Table 1 Keywords used for search process
General term
Health utility term
MeSH
MeSH
HIV infection
Quality of life
Antiretroviral therapy,
highly active
Quality-adjusted
life year
Title/Abstract
Title/Abstract
Human immunodeficiency
virus
Health-related
quality of life
SF-6D
HIV
HRQoL
Health utility index
Acquired immunodeficiency
syndrome
Health utility
HUI
Antiretroviral therapy
Utility scores
HUI2
Information sources and search strategy
Two separate search strategies were performed, including:
1) searching with a combination of free text keywords and
2) searching for the application of well-known utility measures in HIV/AIDS field. The search process was conducted from 15th February, 2014 to 8th March, 2014 (date
of last search). Four databases were used for the search
process, including PubMed/Medline, Cochrane Database
of Systematic Review, NHS Economic Evaluation Database
and Web of Science. The search terms used are listed in
Table 1. The search strategy was modified for each database by experienced experts and librarians. Finally, the
bibliographies of selected papers were reviewed and the
authors of unpublished papers were contacted to identify
all of potential relevant studies.
Study selection
After the search was completed, all duplicated studies
were removed. Next, titles and abstracts of all remaining
studies were screened by the research team to ensure
that they matched the selection criteria. All papers
whose title and abstract revealed that it did not match
the selection criteria were excluded. Several further studies were excluded if their full-text articles revealed that
they did not measure utility or duplicated data.
Data items and data collection
Using a data extraction form, three independent reviewers
extracted specified data from the final selected studies.
These reviewers compared their extraction results, discussing and resolving any disagreements prior to producing the final data file for the statistical analysis Reliability
of the data extraction among the three independent
reviewers was 90%.
Utility assessment
HUI3
Utility measure
15D
Preference based
Quality of
well-being
Utility based
QWB
Preference elicitation
Standard gamble
Cost utility analysis
SG
QALY
Time trade-off
Quality adjusted
life years
TTO
Euroqol
Visual analog scale
Eq-5d
Visual analogue
scale
Eq5d
VAS/RS
Time
2000-2014
Language
English
Data collected included information about study setting,
study design, sample size, utility measure used, mean or
median utility scores, standard deviations, methods of assessment, length of follow-up, and clinical and demographic characteristics of respondents. We collected some
additional information about the measures used, including
data about validity, reliability and responsiveness of each
measure (if available).
To define the health utility of each subject based on
clinical characteristics, we divided subjects into 3 disease
stage categories: asymptomatic, symptomatic and AIDS.
However, when we coded disease stage, we found that
HIV/AIDS status was reported in numerous ways. For
example, some of articles simply reported their cohorts
into 3 groups (asymptomatic HIV infection, symptomatic HIV infection, and AIDS) [23], while some authors
reported CD4 cell count or the presence of HIV/AIDSdefining illnesses. In the latter case, we used all available
data to identify the health state based on the current
Centre for Disease Control and Prevention (CDC) guidelines [23]. If authors described subjects without indicating
Tran et al. BMC Health Services Research (2015) 15:7
data about HIV/AIDS stages or CD4 counts, the HIV/
AIDS status was classified as “combined stages”. If two articles described overlapping research findings from the
same dataset, we removed the article that reported less
methodological information.
Data analysis
We used two approaches in analyzing the data. The first
one aimed to obtain the pooled estimates of utility and
examine the influences of study characteristics on these
estimates [24]. We consider every assessment using a
specific tool in both cross-sectional and longitudinal
studies as a single measurement, making a dataset of
218 observations. Since most studies actually applied
several HRQL measures, these studies were considered
as clusters in the model, in which each within-study
measurement was seen as a nested observation [25].
Therefore, we conducted meta-regression analysis, using
a random effect model with robust estimation of standard error. If the standard deviation of the estimated utility was missing, we calculated it using standard error or
95% confident interval of the estimated utility. In the
first model, comparison of individual measure was conducted. Second, we fit separate models for each of the
subgroups of interest and adjusted for type of HRQL
measure. Finally, we included all study characteristics in
a multivariate model. The second approach was applied
for longitudinal measurements (n = 99)
to estimate the changes in health utility of patients during ART. Traditionally, regression models often provide
a linear dose–response relationship that might not truly
reflect the variability of health outcomes given different
time on ART. To better describe the association between
utility scores and duration on ART, we applied multiple
fractional polynomials models which are Intermediate
between polynomials and non-linear curves. We fitted
first-order and second-order fractional polynomial regression with powers (−2,-1, −0.5, 0, 0.5, 1, 2, 3) for the
“duration on ART” to increase the flexibility in estimating the best-fitting curve to the health utility trajectories.
Data were analyzed using STATA 12.0, ‘xtmixed’ and
‘mfp’ syntax. The details of data analysis and extracted
data set are provided in Additional files 1 and 2.
Ethical approval
All data included in this review were previously published and publicly available. We only synthesize and analyzed aggregated data. Therefore, this study did not
require ethical approval.
Results
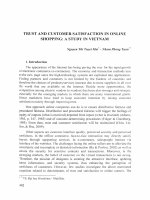
Our systematic literature search yielded 49 studies for
inclusion in this study (see Figure 1 for flow chart of the
search). We selected these studies for their application
Page 4 of 16
of nine utility instruments to the field of HIV. These utility
measures included 6 indirect and 3 direct preferencebased measures (see Table 2 for descriptions of the measures and their psychometric properties). Of the 49 total
studies, 14 utilized longitudinal designs, while 37 studies
were cross-sectional, generating 218 utility estimates.
Of these 218 utility measures, 8 were of asymptomatic
patients, 15 were of symptomatic patients, 56 were from
AIDS patients, and 139 were of a combination of patients of different stages (Table 3). VAS accounted for
the majority of utility measures (100 times, 45.9%), while
HUI2 was only used in 1 measure (0.5%).
The majority of utility measures were conducted in developed countries (i.e. USA, UK, Canada, etc.) (with
n = 168; 77.1%). 119 utility measures
(54.6%) were from cross-sectional studies and 99 (45.4%)
were from longitudinal studies.
Psychometric properties of utility measures in HIV
population
Few studies have reported the reliability of these measures. Stavem (2005) [17] determined that the test-retest
reliability of EQ-5D, 15D and SF6D was 0.78, 0.90 and
0.94 respectively. Among direct utility measures, Lara
(2008) showed a low reliability of 0.41 for SG while it was
around 0.71-0.83 for TTO and VAS [16]. Many studies
evaluated the validity of utility measures using concurrent
and predictive validation. Several studies established convergent validity of EQ-5D, EQ-VAS, HUI3, SG, TTO and
VAS by demonstrating their correlation with the subscales
of the condition specific MOS-HIV [17,26,27]. In addition,
the EQ-5D and HUI3, along with 3 direct preferencebased measures, were shown to discriminate subjects by
disease severity according to the levels of CD4+ and viral
load. Finally, the EQ-5D single index, 15D and SF-6F demonstrated responsiveness relative to a global rating of
change [18], while the EQ-VAS and HUI3 demonstrated
responsiveness to the development of opportunistic infections, clinical AIDS-defining events, and adverse events
[18,26,27] (Table 4).
Utility estimates
Data from the 218 utility measurements of 27,951 subjects
were extracted for meta-analysis. The meta-regression results are shown in Table 5, including Model 7 for comparison of individual measure, Model 2-6 for the subgroups of
interest and adjusted for type of HRQL measure and
Model 1 for all characteristics.
Type of instrument used was a significant predictor of
health utility estimates. Adjusting for study characteristics, the SF-6D and the HUI yielded the highest and
lowest scores, respectively. We found large, statistically
significant differences between utility elicited by SF-6D
(0.171), EQ-5D (0.114), and TTO (0.151) and the
Tran et al. BMC Health Services Research (2015) 15:7
Page 5 of 16
Figure 1 Flow of study selection.
reference measure, SG. Meanwhile, VAS and HUI provided utility estimates that were not significantly different than SG.
Compared to asymptomatic HIV patients, symptomatic and AIDS patients reported a decrease in utility score
of 0.025 (p = 0.40) and 0.176 (p
= 0.001), respectively, when adjusting for method
of assessment, 0.017 (p = 0.65) and 0.173
(p < 0.001), respectively, when adjusting
for all study characteristics.
Health utility of HIV/AIDS patients in developing
countries was 0.082 lower than those who lived in developed countries. We did not find significant differences
in utility estimates across different years of publication.
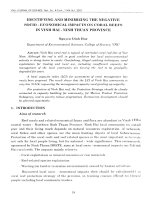
Longitudinal changes in health utility of HIV/AIDS patients
We used a multivariate fractional polynomial model of
the 99 utility measurements from the 14 selected longitudinal studies to analyse changes in health utility over
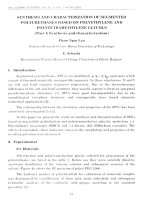
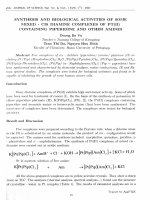
time (see Table 5-Model 8, Figures 2 and 3). The model’s
coefficients show that the duration of ART was a significant predictor of the changes in health utility scores of
HIV/AIDS patients, after adjusting for study characteristics. Health utility of HIV/AIDS patients significantly
decreased in the first 3 months of treatment, and rapidly increased afterwards (Figure 2). The magnitude of
change was also affected by duration of ART, as well as
by the methods of assessment. Direct preference-based
measures resulted in greater changes in utility scores
Measures
Country
of origin
Domain
No.
items
Response
options
No. health
states
Ranges
1. EQ-5D-3L(EuroQol -five
dimensions-3 levels)
EuroQoL Group
mobility, self-care, usual activities,
pain/discomfort and anxiety/depression
5
3 levels
243
2. EQ-5D-5L(EuroQol -five
dimensions-5 levels)
EuroQoL Group
mobility, self-care, usual activities,
pain/discomfort and anxiety/depression
5
5 levels
3. 15D
Finland
breathing, mental function,
speech (communication),
vision, mobility, usual activities,
vitality, hearing, eating, elimination,
sleeping, distress, discomfort and
symptoms, sexual activity,
and depression
15
4. Health Utility Index
Mark 2 (HUI2)
Canada
sensation, mobility, emotion,
cognition, self-care, pain and fertility
5. Health Utility Index
Mark 3 (HUI3)
Canada
6. Short form 6 (SF-6D)
Endpoints
Admin (time)
1 (100)
0
−0.59 to 1.00
full health
death
I, SA* (2 mins)
3125
−0.45 to 1.00
full health
death
I, SA* (2 mins)
5 levels
31 billions
0.00 to 1.00
full health
death
I, SA* (5–10 mins)
7
3-5 levels
972,000
−0.02 to 1.00
full health
death
I, SA* (5–10 mins)
Vision, hearing, speech,
ambulation, dexterity,
emotion, cognition, and pain
8
5–6 levels
972,000
−0.36 to 1.00
full health
death
I, SA* (5–10 mins)
UK
physical functioning; role limitations;
social functioning; pain; mental
health and vitality
11
4-6 levels
18000
0.00 to 1.00
best health state
worst health state
I, SA* (2 mins)
7. Standard Gamble (SG)
USA
-
-
Continuous
-
0.00 to 1.00
full health
death
I, SA* (2 mins)
8. Time trade-off (TTO)
USA
-
-
Continuous
-
0.00 to 1.00
full health
death
I, SA* (2 mins)
9. Visual analog scale (VAS)
EuroQoL Group
-
-
Continuous
-
0 to 100
full health
worst health
I, SA* (1 mins)
Tran et al. BMC Health Services Research (2015) 15:7
Table 2 Overview of selected health utilities measures applied in adults with HIV/AIDS
*I: Interview, SA: Self-administered.
Page 6 of 16
Tran et al. BMC Health Services Research (2015) 15:7
Page 7 of 16
Table 3 Characteristics of selected utility measurements
Category
Characteristic
Number of
utility measures
(n = 218)
Number
Disease stage Asymptomatic
Measures
Settings
Study design
Percentage
8
3.7%
Symptomatic
15
6.9%
AIDS
56
25.7%
Not reported/Combined* 139
63.8%
EQ-5D-3L
53
24.3%
EQ-5D-5L
3
1.4%
HUI2
1
0.5%
HUI3
20
9.2%
15 D
2
0.9%
SF-6D
7
3.2%
SG
15
6.9%
TTO
17
7.8%
VAS
100
45.9%
Developed countries
168
77.1%
Developing countries
50
22.9%
Cross-sectional
119
54.6%
Longitudinal
99
45.4%
*Data were reported for patients at various disease stage categories.
than indirect preference-based measures during the
first year of treatment. Starting from the second year,
though, the magnitude of change in health utility measured by indirect-preference instruments was larger than
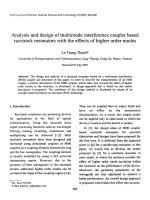
direct-preference ones. While this trend was typical for
studies conducted in developed countries, it was slightly
different in developing countries. In such countries as
South Africa, Brazil, Thailand, Uganda, and Vietnam, patients’ health utility markedly increased right after the initiation of ART, and then changed only slightly during the
first 6 months of treatment, before increasing rapidly
again afterwards (Figure 3).
Discussion
By systematically reviewing studies of health utility
among HIV/AIDS patients, we provide an accumulation
of psychometric evidence of the preference-based HRQL
instruments applied in this patient group. Moreover, we
compared the performance and utility estimates by various
instruments, as well as modelled the changes in health
utility over the course of HIV/AIDS treatment. Prior to
this work, Tengs and Lin did a meta-analysis of health
utility estimates from studies published from 1985–2000
[16]. In this study, we found similar findings that disease
stage is an important predictor of health utility. Also, different HRQL instruments might yield clinically important
differences in health utility scores. Moreover, findings of
this study provide most-updated evidence of preferencebased HRQL assessments among patients with HIV/AIDS
during 2000–2013. This is the period when HIV/AIDS
treatment services have been rapidly scaled up in developing countries. We extend previous work by analyzing the
changes in health utility of patients over the course of
ART. Especially, we revealed that different types of instruments had different levels of responsiveness over the early
and stable periods of ART.
When analyzing the performance of the different instruments, we found that the Time Tradeoff (TTO) instrument, SF-6D, and EQ-5D yielded higher utility
scores than the reference Standard Gamble (SG) instrument, while the Visual Analogue Scale (VAS), HUI, and
15D showed no statistically significant difference in
measurement than the SG. This is in contrast to various
other studies, in which the use of the SG method generally yields the highest utility score among directpreference instruments [8,72]. Generally, it is believed
that SG yields higher health utilities, because it asks patients to make a gamble between a chance of good
health and a chance of death, and most people are reluctant to accept a large risk of death to avoid an adverse
health state [72,73]. There has been very little research
about the effect of context on SG and TTO instruments,
and yet our results indicate that these instruments may
perform differently in HIV/AIDS populations [74]. Indeed, one of the papers included in this review showed
that SG was an unreliable measurement of healthy utility
in HIV/AIDS patients (0.41) and that TTO and VAS
were much more reliable (0.71-0.83) [17]. This low reliability may help explain why SG yielded lower utility
scores, contrary to what was expected.
Given that HIV is a chronic disease that changes over
time, it is essential that HRQL measures are responsive to
clinically significant changes the patient experiences. Most
of the indirect measures included in this study were responsive to opportunistic infections, clinical AIDS-defining
events, adverse events, or global rating of change, and the
direct preference-based measures were able to discriminate
subjects by disease severity. When analysing the performance of measures throughout the duration of ART,
we found that during the first year of treatment, direct
preference-based measures resulted in greater changes
in utility scores than indirect preference-based measures, but starting from the second year, this trend reversed and indirect preference-based measures resulted
in great changes than direct preference measures. This
may be due to the fact that direct preference-based
measures may reflect the change in subjects’ perception
of their health status rather than a true change in health
status [74,75]. Therefore, change in utility, in short
term, might be influenced by the hope of HIV patients
getting treated [19]. Similarly, in the long-term, patients
Tools
HIV/AIDS population
Subjects
EQ-5D3L*
HIV+ patient
[18,26-46]
Country
Developing
[37-39,41,46]
Reliability
Sample ICR
size
Validity
TTR
16-2261 0.81-0.86 0.78 [18]
[39]
Construct
Longitudinal validity
Criterion (concurrent)
Convergent Other measures
HIV clinical Other clinical
signs
characteristic
MOS-HIV
[27]
CD4 count
[18,28,38]
SF36
(r
=
0.55-0.74) [18]
SF6D
(r
=
0.74) [18]
Developed
[18,26-36,40,
42-45,47]
HIV stages
[29,36]
Improve
over time
[30]
15D
HIV+
patients [18]
HIV+
patients [34]
Developing
[48]
Viral load
[28]
Decline after
health status
worse [18]
SAE
status [34]
Decline after
CD4 and VL
decline [32]
Developed
[18]
Developed
[34]
60
57
-
-
0.9 [18]
-
-
-
-
0 [18]
10-12
[18]
Improve when
CD4 improve
[38]
VAS (r
= 0.41-0.80)
[18,28,29,39]
0.85 [48] -
12.4 - 39.7
[18,26-28,
32,37,47]
CD4 count
group
[32,37]
HUI3 (r
= 0.551) [41]
1016
0.0 [18,2628,37,47]
Viral load
group [32]
Decline before
and after
diagnosis of
SAE* [35,40]
VAS (r
= 0.73) [48]
HIV
stages [48]
Global rating of
HRQoL (r
= 0.36) [48]
CD4 count
group [48]
-
-
Duration of
ART [48]
SF36 (r
=
0.59-0.80) [18]
CD4 count
[18]
VAS (r
= 0.73)
[18]
Viral load
[18]
-
-
Change follow
the change
of health
status [18]
-
-
Page 8 of 16
HUI2*
HIV+
patients [48]
Decline after
diagnosis of
AE [26,27,
35,40]
ART*
status [33]
MOS-HIV (r
= 0.40-0.72)
[26,28,29,32,47]
EQ-5D5L*
Ceiling
GBV-C
status [31]
WHOQOL-BREF
(r
=
0.31-0.60) [37]
AQOL
(r
=
0.539) [41]
Floor
Sensitivity Responsiveness
Tran et al. BMC Health Services Research (2015) 15:7
Table 4 Psychometric properties of selected health utilities measures in HIV population
HUI3*
HIV+ patient
[26,35,40,41,49]
Developing
[41]
57-1200 -
-
-
Developed
[26,35,40,
47,49]
MOS-HIV
CD4 count
(r = [35,40,49]
0.34-0.70) [26,47]
Decline after
diagnosis of
AE* [26]
AQOL (r
=
0.543) [41]
Decline before
and after
diagnosis of
SAE* [35,40]
Viral load
[40]
EQ-5D-3L (r
= 0.551) [41]
SF-6D*
HIV+ patients
[4,18,50]
Developed
[4,18,50-52]
55-2508 -
0.94 [18]
-
HIV+
women [51]
HIV+ patients
[4,6,17,26,37,
40,53-56]
-
3.15-5.4
[26,47]
-
Change follow
the change
of health
status [18]
0 [18]
6-10 [18]
-
Decline after
diagnosis
of SAE* [40]
7.6-11
[26,37,47]
0.8-22
[26,37,47]
Improve
over time
[17]
Decline after
diagnosis of
SAE* [40]
4.4 [26,47]
18.3
[26,47]
VAS (r
= 0.75) [18]
HIV+ IDUs [52]
SG*
SF36 (r
=
0.73-0.79) [18]
0-3.2 [26,47]
Developing
[17,37,55]
75-450
-
0.41-0.42
[17]
-
TTO (r
=
0.21-0.39) [17]
CD4 count
groups
[26,37,53]
Tran et al. BMC Health Services Research (2015) 15:7
Table 4 Psychometric properties of selected health utilities measures in HIV population (Continued)
VAS (r
=
0.26-0.34) [17]
Developed
[4,6,26,40,47,
53,54,56]
MOS-HIV (r
=
0.14-0.15) [26,47]
WHOQOL-BREF
(r
=
0.09-0.34) [37]
HIV stages [4]
Global rating
of change [17]
TTO*
HIV+ patients
[6,17,26,40,53,
54,56,57]
Developing
[17]
66-450
-
0.71-0.83
[17]
-
Global rating
of change [53]
SG (r
=
0.21-0.39) [17]
Developed
[6,26,40,47,
53,54,56,57]
CD4
count [40]
CD4 count
group [26,53]
VAS (r
=
0.45-0.61) [17]
Page 9 of 16
MOS-HIV (r
= 0.21-0.29)
[26,47]
VAS*
HIV+ patient
Developing
[4,6,17,26-30,37,39, [17,37,39,46,
40,42,44-46,48,
58,63,71]
53,54,56,58-71]
Developed
[4,6,26-30,34,
40-42,44,45,47,
53,54,56,60,
61,64-70]
16-2865 -
0.71-0.83
[17]
MOS-HIV
[27]
Global rating
of change [17]
CD4 count HIV stages
[28,40,61,64] [4,29]
MOS-HIV (r
= 0.33-0.72)
[26,28,29,47,63]
EQ-5D-3L (r
= 0.41-0.63)
[28,29,39]
CD4 count
groups [37,53]
EQ-5D-5L (r
= 0.73) [48]
HIV-RNA
groups [64]
SG (r
= 0.26-0.34)
[17]
TTO (r
= 0.45-0.61)
[17]
Viral load
[28,64]
Improve
over time
[58]
Decline after
diagnosis of
AE* [26,27]
and OI* [27]
0-2 [18,26-28, 3.3-10.8
37,47]
[18,26-28,
37,47]
Decline before
and after
diagnosis of
SAE* [40,64]
Tran et al. BMC Health Services Research (2015) 15:7
Table 4 Psychometric properties of selected health utilities measures in HIV population (Continued)
WHOQOL-BREF
(r =
0.36-0.54) [37]
*EQ-5D-3L: EuroQol −5 dimensions-3 levels; EQ-5D-5L: EuroQol −5 dimensions-5 levels; HUI2: Health utility index 2; HUI3: health utility index 3; SF-6D: Short form 6-dimensions; SG: standard gamble; TTO: time trade-off;
VAS: visual analogue scale; ART: Antiretroviral therapy; VL: viral load; AE: Adverse events; ADE: AIDS defining events; OI: Opportunistic infection; SAE: serious adverse events.
Page 10 of 16
N
%
Const
Model 1
Model 2
Model 3
Model 4
Model 5
Model 6
Model 7
Model 8
Coefficient
(95% CI)
Coefficient
(95% CI)
Coefficient
(95% CI)
Coefficient
(95% CI)
Coefficient
(95% CI)
Coefficient
(95% CI)
Coefficient
(95% CI)
Coefficient
(95% CI)
0.784
(0.703; 0.865)
0.624
0.653
(0.508; 0.740) (0.562; 0.744)
0.639
(0.535; 0.742)
0.696
(0.555; 0.838)
0.612
(0.454; 0.77)
0.616
(0.463; 0.768)
Measures
SG
20
8.6
VAS
81
34.6 0.037 (−0.021; 0.095)
0.067
0.06 (−0.038; 0.158) 0.063 (−0.041; 0.168)
(−0.048; 0.182)
0.072 -0.038; 0.182)
0.066
(−0.059; 0.191)
0.073
0.535 (0.425; 0.645)
(−0.060; 0.207)
TTO
20
8.6
0.151 (0.098; 0.203)
0.209
0.180
(0.086; 0.331) (0.097;0.264)
0.191 (0.096; 0.285)
0.199
(0.091; 0.307)
0.207
(0.080; 0.334)
0.213
0.555 (0.377; 0.733)
(0.079; 0.348)
15D
2
0.9
0.017 (−0.059; 0.094)
0.069
0.040
(−0.072; 0.211) (−0.064; 0.144)
0.065 (−0.063; 0.193)
0.064
(−0.054; 0.182)
0.067
(−0.072; 0.205)
0.076
0.493 (0.335; 0.651)
(−0.076; 0.227)
SF6D
7
3
0.171 (0.11; 0.231)
0.214
0.189
(0.077; 0.350) (0.095; 0.283)
0.199 (0.093; 0.306)
0.201
(0.095; 0.307)
0.201
(0.078; 0.325)
0.217
0.613 (0.455; 0.771)
(0.074; 0.360)
HUI
31
13.3 −0.052 (−0.127; 0.022) −0.042
−0.055
(−0.178; 0.093) (−0.159; 0.049)
−0.044 (−0.159; 0.072) −0.041
(−0.153; 0.071)
−0.052
(−0.180; 0.076)
−0.04
0.319 (0.173; 0.465)
(−0.187; 0.106)
EQ5D
73
31.2 0.114 (0.048; 0.179)
0.124 (0.015; 0.234)
0.116
(−0.005; 0.237)
0.127
0.541 (0.407; 0.676)
(−0.015; 0.268)
0.124
0.113
(−0.006; 0.254) (0.016; 0.210)
0.125
(0.021; 0.229)
Tran et al. BMC Health Services Research (2015) 15:7
Table 5 Adjusted effect size by duration of follow-up
Length
of ART
Length
of ART _1
−0.148
(−0.274; −0.021)
Length
of ART _2
0.397 (0.034; 0.760)
Study design
Cross-sectional
123 52.6
Longitudinal
111 47.4
0.033 (−0.027; 0.092)
Disease stages
Asymptomatic
22
9.4
Symptomatic
41
17.5 −0.017 (−0.094; 0.059)
−0.025 (−0.084; 0.034)
AIDS
67
28.6 −0.173
(−0.261; −0.086)
−0.176 (−0.278; −0.075)
Mixed group
104 44.4 −0.061
(−0.120; −0.002)
−0.057 (−0.124; 0.009)
Non ART
63
ART
150 64.1 −0.076
(−0.150; −0.002)
26.9
−0.067
(−0.170; 0.036)
Page 11 of 16
Treatment
Combined
21
9
−0.015 (−0.074; 0.045)
0.025
(−0.016; 0.066)
Setting
Developed
182 77.8
Developing
52
22.2 −0.082
(−0.163; −0.001)
2000/4
38
16.2
2005/9
149 63.7 −0.023
(−0.074; 0.029)
−0.017
(−0.094; 0.059)
0.196
(0.067; 0.325)
2010/3
47
0.014
(−0.036; 0.064)
0.248
(0.064; 0.431)
−0.094
(−0.216; 0.029)
−0.087
(−0.187; 0.012)
Year
20.1 0.039
(−0.036; 0.115)
Figures in bold: p-values<0.05.
Tran et al. BMC Health Services Research (2015) 15:7
Table 5 Adjusted effect size by duration of follow-up (Continued)
Page 12 of 16
Tran et al. BMC Health Services Research (2015) 15:7
Page 13 of 16
Figure 2 Predicted utility score and 95% confidence interval by types of measures based on the best fitting fractional polynomial model.
may become acclimated to their health status, and thus
become more likely to report a high health status [3].
These results provide some evidence to inform the selection of preference-based HRQL instrument for measuring health utility of HIV/AIDS patients. First, given the
variation of health utility scores based on type of instrument used, and given the difference in direct versus indirect preference measures over time, researchers should
combine both direct and indirect preference-based instruments. This could be done by incorporating VAS into
other health status profiles. Our review also highlights the
limitations of using generic measures of HRQL in HIV/
AIDS patients. Our meta regression showed steady growth
of health utility scores over the stable period of ART, however many side-effects of ART, including lipodystrophy,
sleep disturbance, and sexual functioning, have negative
effects on patients’ quality of life and should be reflected
in HRQL measures [12,13,76,77]. Additionally, some
tools, such as EQ-5D-3L, showed a high ceiling effect,
for example, which may affect their responsiveness in
monitoring the outcomes of ART. These findings suggest that it may be beneficial to develop more HIV-
Figure 3 Predicted utility score and 95% confidence interval by study settings based on the best fitting fractional polynomial model.
Tran et al. BMC Health Services Research (2015) 15:7
specific questionnaires that are sensitive to ART. Finally, we found that these measures performed differently in developed and developing countries. Patients in
developed countries had higher health utility scores
than patients from the developing world. Additionally,
patients in developed countries demonstrated an initial
decrease in HRQL upon initiation of ART, followed by a
large and steady increase, whereas patients in developed
countries experienced a large initial increase, following
by little change in the first 6 months, and large steady
increase again after that. Since developing countries
have a greater burden of HIV/AIDS, it may be of great
interest for further studies to examine the determinants
of HRQL of patients with HIV/AIDS specifically in
this setting.
Finally, our use of pooled health utility estimates to
determine the changes in HRQL during treatment has
significant implication for economic and clinical evaluation of HIV/AIDS care and treatment interventions. In
particular, the rapid reduction in health utility during
the first 3 months of ART highlights the importance of
intensive support for patients after ART initiation to relieve both physical and psychological burden experienced by these patients.
The strengths of this meta-analysis include a systematic
approach in synthesizing evidence from the literature. In
addition, we applied multivariate fractional polynomial
models to select the best fitting model for changes in
health utility and length of ART. However, there are some
limitations to be acknowledged. First, aggregated data in
some studies limited the estimate ability of the model. Second, the length of ART was inconsistent between different
patient groups and health utility measures. Third, the frequency of application of some instruments, such as 15D
and HUI2, was very small, which resulted in imbalanced
models. Finally, since the selected measures are generic instruments, we were not able to identify a set of common
measures, including HIV-specific items, to be used for
comparing across studies.
The pooled estimates of health utilities and trends
throughout the course of ART provided in this study provide valuable information about the effect of ART on HIV/
AIDS patients health related quality of life, which in turn
can support developing economic models for evaluating
the cost-effectiveness of HIV/AIDS treatment strategies.
Researchers can use estimated utility scores by this study
for quantifying time-dependent health outcomes of interventions in their cost-effectiveness models. In addition, significant reductions in health utility during the first six
month on ART suggest that additional care and support
and intensive monitoring should be incorporated in clinical
practice. Finally this study provides a basis for the selection
of preference-based HRQL instruments for future research
in HIV population.
Page 14 of 16
Conclusion
The study provides an accumulation of evidence on
measurement properties of health utility estimates that
can help inform the selection of instruments for future
studies. The pooled estimates of health utilities and their
trends are useful in economic evaluation and policy
modelling of HIV/AIDS treatment strategies.
Additional files
Additional file 1: Syntax for data analysis.
Additional file 2: Pooled health utility data for STATA software.
Competing interests
The authors declare that they have no competing interests.
Authors’ contributions
BXT, AO designed the study. BXT, LHN, RMM and VMN did the systematic
review and extracted the data. BXT, LHN analyzed the data. BXT, RMM, AO, CL,
LHN wrote the manuscript. All authors read and approved the final manuscript.
Author details
1
Johns Hopkins Bloomberg School of Public Health, Baltimore, MD, USA.
2
Institute for Preventive Medicine and Public Health, Hanoi Medical
University, Hanoi, Vietnam. 3School of Medicine and Pharmacy, Vietnam
National University, Hanoi, Vietnam. 4School of Public Health, University of
Alberta, Edmonton, Alberta, Canada.
Received: 28 October 2014 Accepted: 8 December 2014
References
1. WHO. Antiretroviral Therapy for HIV Infection in Adults and Adolescents:
Recommendations for a Public Health Approach, 2006 Revision. Geneva:
World Health Organization; 2006.
2. WHO. Rapid Advice: Antiretroviral Therapy for HIV Infection in Adults and
Adolescents. Geneva: World Health Organization; 2009.
3. Lin MK, Wu AW, Revicki DA. Incorporating quality of life measures in HIV
clinical trials. HIV Clin Trials. 2002;3(3):202–18.
4. Schackman BR, Goldie SJ, Freedberg KA, Losina E, Brazier J, Weinstein MC.
Comparison of health state utilities using community and patient
preference weights derived from a survey of patients with HIV/AIDS.
Med Decis Making. 2002;22(1):27–38.
5. Aranda-Naranjo B. Quality of life in the HIV-positive patient: implications and
consequences. J Assoc Nurses AIDS Care. 2004;15(5 Suppl):20S–7S.
6. Kudel I, Farber SL, Mrus JM, Leonard AC, Sherman SN, Tsevat J. Patterns of
responses on health-related quality of life questionnaires among patients
with HIV/AIDS. J Gen Intern Med. 2006;21 Suppl 5:S48–55.
7. Feeny D. A utility approach to the assessment of health-related quality of
life. Med Care. 2000;38(9 Suppl):II151–4.
8. Drummond F, Sculpher J, Torrance W, O'Brien J, Stoddart L. Methods for the
Economic Evaluation of Health Care Programmes. Oxford: Oxford University
Press; 2005.
9. Garvie PA, Lawford J, Banet MS, West RL. Quality of life measurement in
paediatric and adolescent populations with HIV: a review of the literature.
Child Care Health Dev. 2009;35(4):440–53.
10. Robinson FP. Measurement of quality of life in HIV disease. J Assoc Nurses
AIDS Care. 2004;15(5 Suppl):14S–9S.
11. Clayson DJ, Wild DJ, Quarterman P, Duprat-Lomon I, Kubin M, Coons SJ. A
comparative review of health-related quality-of-life measures for use in
HIV/AIDS clinical trials. PharmacoEconomics. 2006;24(8):751–65.
12. Grossman HA, Sullivan PS, Wu AW. Quality of life and HIV: current
assessment tools and future directions for clinical practice. AIDS Read.
2003;13(12):583–90. 595–587.
13. Wu AW. Quality of life assessment comes of age in the era of highly active
antiretroviral therapy. AIDS. 2000;14(10):1449–51.
Tran et al. BMC Health Services Research (2015) 15:7
14. Joish VN, Oderda GM. Cost-utility analysis and quality adjusted life years.
J Pain Palliat Care Pharmacother. 2005;19(1):57–61.
15. Hornberger J, Holodniy M, Robertus K, Winnike M, Gibson E, Verhulst E. A
systematic review of cost-utility analyses in HIV/AIDS: implications for public
policy. Med Decis Making. 2007;27(6):789–821.
16. Tengs TO, Lin TH. A meta-analysis of utility estimates for HIV/AIDS.
Med Decis Making. 2002;22(6):475–81.
17. Lara AM, Wakholi BN, Kasirye A, Munderi P, Watera C, Lalloo DG, et al. Utility
assessment of HIV/AIDS-related health states in HIV-infected Ugandans.
AIDS. 2008;22 Suppl 1:S123–30.
18. Stavem K, Froland SS, Hellum KB. Comparison of preference-based utilities
of the 15D, EQ-5D and SF-6D in patients with HIV/AIDS. Qual Life Res.
2005;14(4):971–80.
19. Tsevat J, Sherman SN, McElwee JA, Mandell KL, Simbartl LA, Sonnenberg FA,
et al. The will to live among HIV-infected patients. Ann Intern Med.
1999;131(3):194–8.
20. de Boer JB, van Dam FS, Sprangers MA. Health-related quality-of-life evaluation
in HIV-infected patients. Rev Lit PharmacoEcon. 1995;8(4):291–304.
21. Vanhems P, Toma E, Pineault R. Quality of life assessment and HIV infection:
a review. Eur J Epidemiol. 1996;12(3):221–8.
22. Moher D, Liberati A, Tetzlaff J, Altman DG, Group P. Preferred reporting
items for systematic reviews and meta-analyses: the PRISMA statement. Int J
Surg. 2010;8(5):336–41.
23. Centers for Disease Control and Prevention. Revised Surveillance Case
Definitions for HIV Infection Among Adults, Adolescents, and Children Aged
<18 Months and for HIV Infection and AIDS Among Children Aged 18
Months to <13 Years—United States, 2008. In: Atlanta, USA. 2008.
24. Sophia Rabe-Hesketh, Anders Skrondal. Multilevel and longitudinal modeling
using Stata. Stata Press Publication StataCorp LP 2005
25. Kalaian HA, Raudenbush SW. A multivariate mixed linear model for meta-analysis.
Psychol Meth. 1996;1(2):227–35.
26. Nosyk B, Sun H, Bansback N, Guh DP, Li X, Barnett P, et al. The concurrent
validity and responsiveness of the health utilities index (HUI 3) among
patients with advanced HIV/AIDS. Qual Life Res. 2009;18(7):815–24.
27. Wu AW, Jacobson KL, Frick KD, Clark R, Revicki DA, Freedberg KA, et al.
Validity and responsiveness of the euroqol as a measure of health-related
quality of life in people enrolled in an AIDS clinical trial. Qual Life Res.
2002;11(3):273–82.
28. Delate T, Coons SJ. The use of 2 health-related quality-of-life measures in a
sample of persons infected with human immunodeficiency virus. Clin Infect
Dis. 2001;32(3):E47–52.
29. Miners AH, Sabin CA, Mocroft A, Youle M, Fisher M, Johnson M. Healthrelated quality of life in individuals infected with HIV in the era of HAART.
HIV Clin Trials. 2001;2(6):484–92.
30. Sitbon O, Gressin V, Speich R, Macdonald PS, Opravil M, Cooper DA, et al.
Bosentan for the treatment of human immunodeficiency virus-associated
pulmonary arterial hypertension. Am J Respir Crit Care Med. 2004;170
(11):1212–7.
31. Tillmann HL, Manns MP, Claes C, Heiken H, Schmidt RE, Stoll M. GB virus C
infection and quality of life in HIV-positive patients. AIDS Care. 2004;16
(6):736–43.
32. Huang IC, Willke RJ, Atkinson MJ, Lenderking WR, Frangakis C, Wu AW. US
and UK versions of the EQ-5D preference weights: does choice of preference weights make a difference? Qual Res Int. 2007;16(6):1065–72.
33. Louwagie GM, Bachmann MO, Meyer K, Booysen Fle R, Fairall LR, Heunis C.
Highly active antiretroviral treatment and health related quality of life in
South African adults with human immunodeficiency virus infection: A crosssectional analytical study. BMC Public Health. 2007;7:244.
34. Bansback N, Sun H, Guh DP, Li X, Nosyk B, Griffin S, et al. Impact of the
recall period on measuring health utilities for acute events. Health Econ.
2008;17(12):1413–9.
35. Anis AH, Nosyk B, Sun H, Guh DP, Bansback N, Li X, et al. Quality of life of
patients with advanced HIV/AIDS: measuring the impact of both AIDSdefining events and non-AIDS serious adverse events. J Acquir Immune
Defic Syndr. 2009;51(5):631–9.
36. Lopez-Bastida J, Oliva-Moreno J, Perestelo-Perez L, Serrano-Aguilar P. The
economic costs and health-related quality of life of people with HIV/AIDS in
the Canary Islands, Spain. BMC Health Serv Res. 2009;9:55.
37. Sakthong P, Schommer JC, Gross CR, Prasithsirikul W, Sakulbumrungsil R.
Health utilities in patients with HIV/AIDS in Thailand. Value Health. 2009;12
(2):377–84.
Page 15 of 16
38. Bhargava A, Booysen Fle R. Healthcare infrastructure and emotional support
are predictors of CD4 cell counts and quality of life indices of patients on
antiretroviral treatment in Free State Province, South Africa. AIDS Care.
2010;22(1):1–9.
39. Tran BX, Ohinmaa A, Nguyen LT, Nguyen TA, Nguyen TH. Determinants of
health-related quality of life in adults living with HIV in Vietnam. AIDS Care.
2011;23(10):1236–45.
40. Joyce VR, Barnett PG, Chow A, Bayoumi AM, Griffin SC, Sun H, et al. Effect of
treatment interruption and intensification of antiretroviral therapy on
health-related quality of life in patients with advanced HIV: a randomized,
controlled trial. Med Decis Making. 2012;32(1):70–82.
41. Gow J, George G, Govender K. A comparison of quality of life between HIV
positive and negative diamond miners in South Africa. SAHARA J. 2013;10
(2):89–95.
42. Kempen JH, Martin BK, Wu AW, Barron B, Thorne JE, Jabs DA. The effect of
cytomegalovirus retinitis on the quality of life of patients with AIDS in the
era of highly active antiretroviral therapy. Ophthalmology. 2003;110
(5):987–95.
43. Oliva J, Roa C, del Llano J. Indirect costs in ambulatory patients with HIV/AIDS
in Spain: a pilot study. PharmacoEconomics. 2003;21(15):1113–21.
44. Oliva-Moreno J, Lopez-Bastida J, Worbes-Cerezo M, Serrano-Aguilar P. Health
related quality of life of Canary Island citizens. BMC Public Health.
2010;10:675.
45. Puhan MA, Ahuja A, Van Natta ML, Ackatz LE, Meinert C. Interviewer versus
self-administered health-related quality of life questionnaires - does it
matter? Health Qual Life Outcomes. 2011;9:30.
46. Kittikraisak W, Kingkaew P, Teerawattananon Y, Yothasamut J, Natesuwan S,
Manosuthi W, et al. Health related quality of life among patients with
tuberculosis and HIV in Thailand. PLoS One. 2012;7(1):e29775.
47. Joyce VR, Barnett PG, Bayoumi AM, Griffin SC, Kyriakides TC, Yu W, et al.
Health-related quality of life in a randomized trial of antiretroviral therapy
for advanced HIV disease. J Acquir Immune Defic Syndr. 2009;50(1):27–36.
48. Tran BX, Ohinmaa A, Nguyen LT. Quality of life profile and psychometric
properties of the EQ-5D-5L in HIV/AIDS patients. Health Qual Life Outcomes.
2012;10:132.
49. Isogai PK, Rueda S, Rachlis AR, Rourke SB, Mittmann N, Team OCS.
Prediction of health preference values from CD4 counts in individuals with
HIV. Med Decis Making. 2013;33(4):558–66.
50. Weaver MR, Conover CJ, Proescholdbell RJ, Arno PS, Ang A, Uldall KK, et al.
Cost-effectiveness analysis of integrated care for people with HIV, chronic
mental illness and substance abuse disorders. J Mental Health Policy Econ.
2009;12(1):33–46.
51. Aden B, Nosyk B, Wittenberg E, Schackman BR. Health-related quality of life
in HIV-infected and at-risk women: the impact of illicit drug use and
hepatitis C on a community preference weighted measure.
Med Decis Making. 2013;34:800–8.
52. Surah S, Adams R, Townsend L, Reynolds I, Kinahan JC, Keating S, et al.
Health-related quality of life of HIV-infected intravenous drug users. Int J
STD AIDS. 2013;24(11):867–74.
53. Lenert LA, Feddersen M, Sturley A, Lee D. Adverse effects of medications and
trade-offs between length of life and quality of life in human immunodeficiency
virus infection. Am J Med. 2002;113(3):229–32.
54. Mrus JM, Sherman KE, Leonard AC, Sherman SN, Mandell KL, Tsevat J.
Health values of patients coinfected with HIV/hepatitis C: are two viruses
worse than one? Med Care. 2006;44(2):158–66.
55. Fang CT, Chang YY, Hsu HM, Twu SJ, Chen KT, Chen MY, et al. Costeffectiveness of highly active antiretroviral therapy for HIV infection in
Taiwan. J Formos Med Assoc. 2007;106(8):631–40.
56. Mrus JM, Leonard AC, Yi MS, Sherman SN, Fultz SL, Justice AC, et al. Healthrelated quality of life in veterans and nonveterans with HIV/AIDS. J Gen
Intern Med. 2006;21 Suppl 5:S39–47.
57. Honiden S, Sundaram V, Nease RF, Holodniy M, Lazzeroni LC, Zolopa A,
et al. The effect of diagnosis with HIV infection on health-related quality of
Life. Qual Life Res. 2006;15(1):69–82.
58. Jelsma J, Maclean E, Hughes J, Tinise X, Darder M. An investigation into the
health-related quality of life of individuals living with HIV who are receiving
HAART. AIDS Care. 2005;17(5):579–88.
59. Martin BK, Wu AW, Gelman R, Mitsuyasu RT, Adult ACTG. Quality of life in a
clinical trial of highly active antiretroviral therapy alone or with intravenous
or subcutaneous interleukin-2 administration. J Acquir Immune Defic Syndr.
2005;40(4):428–33.
Tran et al. BMC Health Services Research (2015) 15:7
60. Tillmann HL, Kaiser T, Claes C, Schmidt RE, Manns MP, Stoll M. Differential
influence of different hepatitis viruses on quality of life in HIV positive
patients. Eur J Med Res. 2006;11(9):381–5.
61. Mathews WC, May S. EuroQol (EQ-5D) measure of quality of life predicts
mortality, emergency department utilization, and hospital discharge rates in
HIV-infected adults under care. Health Qual Life Outcomes. 2007;5:5.
62. Burman WJ, Grund B, Roediger MP, Friedland G, Darbyshire J, Wu AW, et al.
The impact of episodic CD4 cell count-guided antiretroviral therapy on
quality of life. J Acquir Immune Defic Syndr. 2008;47(2):185–93.
63. Babikako HM, Neuhauser D, Katamba A, Mupere E. Feasibility, reliability and
validity of health-related quality of life questionnaire among adult pulmonary
tuberculosis patients in urban Uganda: cross-sectional study. Health Qual Life
Outcomes. 2010;8:93.
64. Gianotti N, Galli L, Bocchiola B, Cahua T, Panzini P, Zandona D, et al.
Number of daily pills, dosing schedule, self-reported adherence and health
status in 2010: a large cross-sectional study of HIV-infected patients on
antiretroviral therapy. HIV Med. 2013;14(3):153–60.
65. Carr A, Chuah J, Hudson J, French M, Hoy J, Law M, et al. A randomised,
open-label comparison of three highly active antiretroviral therapy regimens
including two nucleoside analogues and indinavir for previously untreated
HIV-1 infection: the OzCombo1 study. AIDS. 2000;14(9):1171–80.
66. Coplan PM, Cook JR, Carides GW, Heyse JF, Wu AW, Hammer SM, et al.
Impact of indinavir on the quality of life in patients with advanced HIV
infection treated with zidovudine and lamivudine. Clin Infect Dis. 2004;39
(3):426–33.
67. Hughes J, Jelsma J, Maclean E, Darder M, Tinise X. The health-related quality
of life of people living with HIV/AIDS. Disabil Rehabil. 2004;26(6):371–6.
68. Thein H, Maruff P, Krahn M, Kaldor J, Koorey D, Brew B, et al. Cognitive function,
mood and health-related quality of life in hepatitis C virus (HCV)-monoinfected
and HIV/HCV-coinfected individuals commencing HCV treatment. HIV Med.
2007;8(3):192–202.
69. Hubben GA, Bishai D, Pechlivanoglou P, Cattelan AM, Grisetti R, Facchin C,
et al. The societal burden of HIV/AIDS in Northern Italy: an analysis of costs
and quality of life. AIDS Care. 2008;20(4):449–55.
70. Harding R, Clucas C, Lampe FC, Date HL, Fisher M, Johnson M, et al. What
factors are associated with patient self-reported health status among HIV
outpatients? A multi-centre UK study of biomedical and psychosocial factors. AIDS Care. 2012;24(8):963–71.
71. Dowdy DW, Israel G, Vellozo V, Saraceni V, Cohn S, Cavalcante S, et al.
Quality of life among people treated for tuberculosis and human
immunodeficiency virus in Rio de Janeiro, Brazil. Int J Tubercul Dis. 2013;17
(3):345–7.
72. Morimoto T, Fukui T. Utilities measured by rating scale, time trade-off, and
standard gamble: review and reference for health care professionals.
J Epidemiol. 2002;12(2):160–78.
73. Doth AH, Hansson PT, Jensen MP, Taylor RS. The burden of neuropathic
pain: A systematic review and meta-analysis of health utilities. Pain.
2010;149(2):338–44.
74. Garza AG, Wyrwich KW. Health utility measures and the standard gamble.
Acad Emerg Med. 2003;10(4):360–3.
75. Tsevat J, Goldman L, Soukup JR, Lamas GA, Connors KF, Chapin CC, et al.
Stability of time-tradeoff utilities in survivors of myocardial infarction.
Med Decis Making. 1993;13(2):161–5.
76. Webb A, Norton M. Clinical assessment of symptom-focused healthrelated quality of life in HIV/AIDS. J Assoc Nurses AIDS Care.
2004;15(2):67–78. quiz 79–81.
77. WHOQOL HIV Group. WHOQOL-HIV for quality of life assessment among
people living with HIV and AIDS: results from the field test. AIDS Care.
2004;16(7):882–9.
Page 16 of 16
Submit your next manuscript to BioMed Central
and take full advantage of:
• Convenient online submission
• Thorough peer review
• No space constraints or color figure charges
• Immediate publication on acceptance
• Inclusion in PubMed, CAS, Scopus and Google Scholar
• Research which is freely available for redistribution
Submit your manuscript at
www.biomedcentral.com/submit