DSpace at VNU: Research Trends in Evidence-Based Medicine: A Joinpoint Regression Analysis of More than 50 Years of Publication Data
Bạn đang xem bản rút gọn của tài liệu. Xem và tải ngay bản đầy đủ của tài liệu tại đây (386.56 KB, 18 trang )
Research Trends in Evidence-Based
Medicine: A Joinpoint Regression Analysis
of More than 50 Years of Publication Data
Bui The Hung,
Nguyen Phuoc Long,
Le Phi Hung,
Nguyen Thien Luan,
Nguyen Hoang Anh,
Tran Diem Nghi,
Mai Van Hieu,
Nguyen Thi Huyen Trang,
Herizo Fabien Rafidinarivo,
Nguyen Ky Anh,
David Hawkes ,
Nguyen Tien Huy ,
Kenji Hirayama
Published: April 7, 2015
/>
Article
Authors
Metrics
Comments
Related Content
Reader Comments (0)
Media Coverage
Figures
Figures
Abstract
Background
Evidence-based medicine (EBM) has developed as the dominant paradigm of
assessment of evidence that is used in clinical practice. Since its development, EBM
has been applied to integrate the best available research into diagnosis and treatment
with the purpose of improving patient care. In the EBM era, a hierarchy of evidence
has been proposed, including various types of research methods, such as metaanalysis (MA), systematic review (SRV), randomized controlled trial (RCT), case
report (CR), practice guideline (PGL), and so on. Although there are numerous
studies examining the impact and importance of specific cases of EBM in clinical
practice, there is a lack of research quantitatively measuring publication trends in the
growth and development of EBM. Therefore, a bibliometric analysis was constructed
to determine the scientific productivity of EBM research over decades.
Methods
NCBI PubMed database was used to search, retrieve and classify publications
according to research method and year of publication. Joinpoint regression analysis
was undertaken to analyze trends in research productivity and the prevalence of
individual research methods.
Findings
Analysis indicates that MA and SRV, which are classified as the highest ranking of
evidence in the EBM, accounted for a relatively small but auspicious number of
publications. For most research methods, the annual percent change (APC) indicates a
consistent increase in publication frequency. MA, SRV and RCT show the highest
rate of publication growth in the past twenty years. Only controlled clinical trials
(CCT) shows a non-significant reduction in publications over the past ten years.
Conclusions
Higher quality research methods, such as MA, SRV and RCT, are showing
continuous publication growth, which suggests an acknowledgement of the value of
these methods. This study provides the first quantitative assessment of research
method publication trends in EBM.
Citation: Hung BT, Long NP, Hung LP, Luan NT, Anh NH, Nghi TD, et al. (2015)
Research Trends in Evidence-Based Medicine: A Joinpoint Regression Analysis of
More than 50 Years of Publication Data. PLoS ONE 10(4): e0121054.
doi:10.1371/journal.pone.0121054
Academic Editor: Jakob Pietschnig, Middlesex University Dubai, UNITED ARAB
EMIRATES
Received: September 10, 2014; Accepted: January 27, 2015; Published: April 7,
2015
Copyright: © 2015 Hung et al. This is an open access article distributed under the
terms of the Creative Commons Attribution License, which permits unrestricted use,
distribution, and reproduction in any medium, provided the original author and source
are credited
Data Availability: All relevant data are within the paper.
Funding: NPL, NTHT, TDN, MVH, and NHA have been awarded scholarships from
the Vietnam Student Development Fund (VNSDF; www.vnsdf.org). The funder had
no role in study design, data collection and analysis, preparation of the manuscript, or
decision to publish.
Competing interests: The authors have declared that no competing interests exist.
Introduction
From the 1900s until now, evidence-based medicine (EBM) has developed into the
dominant paradigm for clinical practice [1–3]. Although the term EBM officially
appeared for the first time in 1992 in an article by Guyatt et al in JAMA [4], traces of
the origins of EBM dated back to ancient Greece [5,6]. By 1996, EBM was formally
defined as ―the conscientious, explicit and judicious use of current best evidence in
making decisions about the care of individual patients‖ by Sacket et al [7] and this
definition has been recognized and strongly endorsed by most of the world's scholarly
articles on EBM [8–10]. It is important to note that while often used interchangeably,
EBM and science-based medicine (SBM) are related but different terms. SBM is a
subset of EBM which not only involves evidence for treatment efficacy but also a
mechanism by which the effect can occur. One (historical) example of a treatment that
is EBM but not SBM is a number of different forms of anaesthetic which have been
clearly shown to work but the mechanism remains unclear [11]. Internationally, EBM
now provides the framework for the diagnosis and treatment of most health conditions
[12–14]. The alternative to EBM is empirical diagnosis and treatment, which is a
system much more open to individual, cultural and training bias [15]. Overall this
approach has become less popular as health practitioners have greater access to
cutting edge medical knowledge in the current information era. The increasing rate of
research and knowledge acquisition often means that clinicians are asked questions
the answers to which have changed since their training [16]. Patients expect
physicians to be able to interpret and explain medical information from a wide range
of sources including the internet [11,17]. Insurers expect physicians to know which
diagnostic and treatment strategies strike the best balance between accuracy and cost
effectiveness [18]. While students need to rapidly assess medical information and its
quality, they must also learn to make decisions in the absence of good evidence [19].
EBM provides a framework for using medical and scientific evidence to effectively
guide clinical practice, and as such is thoroughly prepared to match all of these
challenges [4,12,19–21].
The basic principle of EBM is simply that we should treat when the evidence
indicates that perceived benefits outweigh the perceived risks and conversely not treat
when the risks are higher than the benefits. Assessments using EBM have to be
conducted in 5 key steps: defining the clinical question, finding the best evidence,
critically appraising the evidence, applying the evidence to the patient and evaluating
the performance of the decision [22,23]. Finally, the evidence should be presented and
assessed through a logical and systematic classification in which the value of evidence
can be ranked [24]. This system allows assessment of the quality of studies and often
informs recommendation for changes in best clinical practice [25].
There is no single, universally-accepted hierarchy of evidence [26]. Yet most people
agree that current, well-designed systematic reviews (SRV) and meta-analyses (MA)
are at the least risk of bias and hence represent the most robust, high quality evidence
while case reports or expert opinions are considered having the highest risk of bias
[27–31]. Other methods such as randomized controlled trials or cohort studies fit in
somewhere in the middle in terms of research bias [29–33].
Despite its critical role in medical teaching, research, and clinical practice, there is a
dearth of literature measuring the interest of researchers in EBM. The contribution of
published research focusing on EBM over time has not been examined. Moreover,
any changes in the proportions of the various study methods in the EBM hierarchy
remain unclarified. The current study involved a bibliometric investigation to evaluate
trends in research productivity and the contribution of different research methods to
EBM. This study used the US National Library of Medicine’s PubMed database to
find articles published over a period of 68 years (1945–2012) sorted by journal of
publication, taking advantage of the fact that PubMed facilitates filtering by article
type. This study allows quantitative assessment of the issues outlined above and
highlights significant trends in EBM research publication.
Method
Data collection
In this study, the filter tool available as part of PubMed
( was used to search and classify all
publications according to their article types with the following strategy: typing ―all
[sb]‖ in the search field, we initially searched All PubMed publication (APP).
Searches were then limited by selecting only one of these article types: Case Report
(CR), Clinical Trial (CT), Controlled Clinical Trial (CCT), Randomized Controlled
Trial (RCT), Guideline (GL), Practical Guideline (PGL), Systemic Review (SRV) or
Meta-Analysis (MA) in the filter tool. Hence, the annual number of publications of
APP, CR, CT, CCT, RCT, GL, PGL, SRV and MA were retrieved regardless of text
attainability, study design, publication date, language or species. Other types of
publications, which account for up to 86.94% of APP, are neither well categorized by
PubMed nor included in the hierarchical system of classifying evidence, and therefore
are not included in this research. The level of evidence is varied and depends on many
factors, e.g. the area that being researched, study quality, size of study population,
etc… [34] However, the article types which are chosen for this study are arranged,
from high to low weight of evidence according to general hierarchical order: MA,
SRV, RCT, CCT, CR [28]. The Oxford Centre for Evidence-based Medicine
(OCEBM) does not mention PGL and GL, but in other classification, they might place
as the highest rank of evidence [34–36]. Review articles were not included in this
strategy because the variability within this category would not allow non-clinical
publications to be excluded. In this study, only publications from completed years
were included, as a result, all publications after 2012, which are still being updated,
were excluded. In each category, articles which did not form part of a single
continuous series of annual data points and jump-shift count possibly due to
categorization changes, as happened in cases of CR (before 1977) and CT (before
1961), were excluded. Hence, the PubMed database search identified bibliographic
details in the following time periods: 1977–2012 for CR, 1961–2012 for CT, 1966–
2012 for CCT, 1966–2012 for RCT, 1973–2012 for GL, 1978–2012 for PGL, 1945–
2012 for SRV, 1990–2012 for MA, and 1945–2012 for APP (as that is the earliest and
latest date for the subgroup categories).
Data Analysis
All data extracted were analyzed using the Joinpoint Regression Program version
4.1.0 (Statistical Research and Applications Branch, National Cancer Institute, USA)
[37] to examine the trends, and assess the significance of changes in trends, in the
various study methodologies in the EBM hierarchy. Joinpoint regression was
performed to identify periods with statistically distinct log-linear trends in number of
publication of each article type over time [38–41]. The analyses determined the
joinpoints at which there is an essential change in the trends with Bonferroni
adjustment [42,43]. The detailed pattern of this model was first introduced and fully
established by Kim HJ and colleagues [40].
We assigned the year of publication as an independent variable and the annual
number of publications in every category and relative publication number as
dependent variables for each Joinpoint session. Within the Data File Import Wizard,
we established the Delimiter box as ―Comma‖, Missing Characters box as ―Space‖,
Dependent Variable Information as ―Provided‖. The number of publications (in
categories such as CR, CT…) was set as ―Count‖ whilst proportion in each article
type (such as the proportion of CT to APP) was set as ―Proportion‖. In the
Specifications tab, ―Shift data points‖ was set as ―0‖, ―Number of Joinpoints‖ ranged
from ―0‖ to ―3‖, ―Heteroscedastic Errors Option‖ was set at ―Constant Variance‖.
There has been no research on the effect of setting maximum joinpoints on the
analysis results and but a number of studies have utilized three as the maximum
Joinpoints [44–46]. Therefore, we chose the maximum number of joinpoints as 3 for
the convenience when analyzing and interpreting data. Log transformation was used
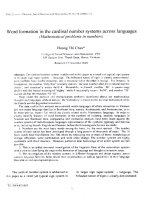
for all Joinpoint analyses. In the Advance tab, the ―Grid search‖ method was selected
and ―Permutation Test‖ used to determine the best number of change-points in
segmented line regression. The remaining parameters were set as default. (Fig 1)
Download:
PPT
PowerPoint slide
PNG
larger image
TIFF
original image
Fig 1. Flow chart of the data collection and analysis process.
/>
The analyses were also conducted using SPSS version 22.0 (SPSS Inc, Chicago, IL,
USA). The software was utilized to perform a descriptive statistics of productivity of
each method in the EBM hierarchy [47,48]. An assessment of the normality of these
data was retrieved by using the software feature. SPSS allows calculation of the
maximum and minimum publication number of every article type with the
corresponding years, the mean and standard deviation (SD), or the median and
interquartile range (IQR).
In this study, the main parameter Annual Percent Change (APC) was used to describe
trends. The APC was used to measure trends in medical research [40,49–52]. The
APC from year t to year (t+1) can be acquired using the following formula:
Where Rt is the rate in year t and α is the slope coefficient in the linear equation
below:
When describing trends over a fixed pre-specified interval, a p-value ≤ 0.05 was
considered statistically significant [53,54].
Results
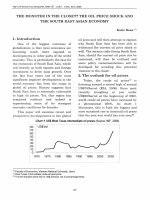
From the PubMed database, a total of 22,134,520 publications were extracted from
the years 1945–2012. PGL and CR accounted for 0.08% and 6.75%, respectively, of
APP, and comprised the smallest and largest categories of publication. The most
recent year examined (2012) had the highest annual number of publications in each
article type, except for CCT, which peaked in 1997. Among all publication types,
PGL accounted for the least number of total papers (17,673 papers). RCT, SRV and
MA accounted for a relatively small number of total publications (344,714 for RCT;
178,155 for SRV and 38,167 for MA). Non-RCTs accounted for 364,315 papers.
(Table 1) (Fig 2).
Download:
PPT
PowerPoint slide
PNG
larger image
TIFF
original image
Fig 2. (A) Stacked area chart displaying the order of appearance and the trends
of development of CR, CT, GL, SRV and MA regarding number of publications
in PubMed over some time periods.
(B) Stacked area chart displaying the order of appearance and the trends of
development of RCT, CCT and PGL regarding number of publications in PubMed
over some time periods
/>Download:
PPT
PowerPoint slide
PNG
TIFF
larger image
original image
Table 1. Evidence-based Medicine publications 1945–2012.
/>The timeline of APC for APP presented with an initial period of striking annual
increase (APC = 75.3%, p<0.05), followed by a more sustained long period of more
moderate increase (APC = 3.0–4.8%, p<0.05) (Table 2). The APC of CR-type
publications showed four periods, in which three had continuous upward trends (APC
= 4.3%, 0.8% and 4.8% in 1977–1984, 1984–2002 and 2002–2007, respectively,
p<0.05) when one remained steady (APC = 0.8% in 2007–2012 p>0.05). Other types
of article manifested increasing trends in number of papers during the recorded period.
The exception was CCT, which had no significant change in the most recent fourteen
years (APC = -2.56%, p>0.05). SRV and MA had continuous upward trends in the
number of publications (APC of SRV = 3.3%, 23.6% and 12.2% in 1945–1970,
1970–1999 and 1999–2012, respectively; and APC of MA = 8.2% in 1990–1996 and
16.9% in 1996–2012, p<0.05).
Download:
PPT
PowerPoint slide
PNG
larger image
TIFF
original image
Table 2. JoinPoint regression analysis of different APC trends.
/>The proportion of CT, SRV and MA publications to APP publications has been
increasing significantly during the most recent joinpoint period (APC of CT/APP,
SRV/APP and MA/APP is 4.0%, 7.1% and 11.7%, respectively, with p<0.05). The
CCT/APP and CR/APP proportion showed a downward trend in 1999–2012
(CCT/APP, APC = -7.1%, p<0.05) and 2007–2012 (CR/APP, APC = -4.4%, p<0.05)
while other proportions including RCT/APP, GL/APP, PGL/APP show no significant
change (p>0.05).
The proportion of CCT to CT had been exhibiting a gradually declining trend during
the observed period from 1966 to 2012 (APC = -5.1%, p<0.05). The proportion of
RCT to CT showed a different pattern: the number of publications rose continuously
in 1966–1992 as well as in 1996–2012 (period 1966–1981: APC = 9.8%; 1981–1992:
APC = 2.7% and 1996–2012: APC = 1.1%, p<0.05) while in 1992–1996 declined, but
fell short of statistical significance (APC = -7.07%, p>0.05). The proportion of
PGL/GL showed rising trends during two time periods (1978–1987: APC = 9.1%,
p<0.05; and 1991–1994: APC = 63.2%, p<0.05) with a downward trend during the
intervening period (1987–1991, APC = -34.4%, p<0.05). In recent years, the PGL/GL
proportion has remained unchanged (APC = 0.6%, p>0.05).
Discussion
This study demonstrates that article types with higher levels of evidence accounted for
fewer publications than those with lower levels of evidence. One possible reason for
this observation is that systematic review (SRV), randomized controlled trial (RCT),
and meta-analysis (MA) articles may take longer to publish because of the time
needed for establishing study design, data collection and analysis, as well as for peer
review [55–57]. These article types also need more financial, technical and human
resources to conduct. Data for SRV and MA are collected from available clinical trials,
cohort studies, case-control studies, observational studies, etc. [55,56]. Additionally
SRVs and MAs can only occur after a sufficient body of research has been undertaken
which may take years if not decades. As a result of their inherent design, SRV and
MA will mostly be produced at a much lower rate than other publication types which
are ranked as having a lower quality of evidence. Similar to the case of SRV, RCT
and MA, publishing practice guideline (PGL) is also time-consuming because of the
time it takes to manage conflicts of interest, to assess the quality of evidence and to
facilitate the consensus [58]. Case reports (CR) are ranked as being of the lowest
quality of evidence but are nonetheless important for generating hypotheses for
further studies to resolve new issues [37,59,60].
The overall slightly positive value of annual percent change (APC) for SRV and the
negative APC in the proportion of SRV to All PubMed publication (APP) suggested
that SRV has had a long period of slow growth and a decrease in popularity in the
scientific world. However, since 1970, the APCs for SRV and the APCs in the
proportion SRV/APP have increased dramatically. This increment might reflect a
regain of interest in SRV among scientists. This may have been due to the
reconsideration of the role of SRV as a critical contributor to Evidence-based
Medicine (EBM) [61,62].
The marked increase in the APCs for MA, as well as the APCs for the proportion of
MA to APP, suggests that MA is a popular methodology for publication in modern
EBM. As a subset of SRV, MA uses a method that aims at combining results from
several studies mathematically and hence create a larger sample size [55,56].
Combining data helps researchers assess more accurately the strength of relationship
of two variables, enhances the statistical power of analysis, and narrows down the
confidence interval. MA first appeared as recently as 1990, and have offered a
number of advantages, including establishing a new benchmark in the quality of
evidence.
For PGL, the growth was initially very strong (APC = 48.6%), but for the most recent
20 years, the growth rate has been slow (APC = 5.6%). As mentioned above, the
recorded period for PGL was relatively short, and PGL currently has the lowest total
number of publications. In the initial phase of growth, PGL appeared with a very
small number of publications. Many questions have been raised about the quality of
PGL. Initially some PGLs were assembled on consensus of expert committees rather
than based on research derived evidence [63–66]. Clinical application of PGL was
also an emerging problem for PGL makers [64,65,67]. The establishment of
standardized criteria for developing PGL, beginning with the criteria of the Institute
of Medicine (IOM) in 1990, opened a new era in which more focus was placed on
strengthening recommendations through strong evidence, and translating evidence
into concise instructions for clinical practice [68]. This fact may explain why the
growth rate of PGL has decreased over the past 20 years.
This study found a slight increase in growth in the number of published clinical trials
(CTs) ((APC = 7.4% for CT). As mentioned earlier, CT is still important for
generating hypothesis and creating data for further in-depth studies, namely SRV and
MA. We hypothesize that as APP continues to grow in number, the aforementioned
article types will continue to increase, as the scientific community will continue to
face new issues and open up to new perspectives.
RCTs are more prevalent than controlled clinical trial (CCTs), as shown by their
respective total absolute quantities (Table 1), the stable APCs in the proportion
RCT/CT and the reduction in the APCs in CCT/CT (Table 2). Methods used in RCT
offers advantages such as a reducing effect on biases and errors as well as the
establishment of a strong statistical power, and enable scientists to obtain high-quality
evidence and valuable data for SRVs and MAs [69]. Nowadays, RCT is used
extensively in most Phase III and some phase II clinical trials [69,70]. CT had very
large APCs in the 1960’s. This marked increase may be explained by significant
changes in the definition of CT during the 1950s [71]. After this period, plenty of
treatment methods were invented and proved effectiveness by using CT method.
Besides, the promotion for CT, which has been seen in that era as the gold standard
for clinical studies, the most eloquent proof for the treatment effectiveness, had
somewhat supported the rapid growth in the number of publications in this article type.
The aim of this study was to assess the tendency of changes in quantities of
publication types which are used in evidence-based medicine, and thus to partly show
researchers’ interest in various publication types. We considered some publication
types such as MA, SRV, RCT as providing high level of evidence; however,
according to OCEBM 2011 [34], the level of evidence may be downgraded because of
study quality, impreciseness, indirectness, too small absolute sample size or
inconsistency between studies. Further studies are required to analyze the effect of
publication types on EBM, especially with qualitative approaches. The current study
utilized data derived from the Medical Subject Headings (MeSH) system of PubMed;
therefore, available studies which are not included in MeSH are not included in our
analysis. Some of the year ranges were not significant maybe because of the short
examined regression segment.
Conclusion
In conclusion, quantitative growth was found across all publication types. The growth
of all, rather than only some publication types, is necessary for the development of
EBM, because evidence-based medicine develops in a step-by-step manner: evidence
from low-quality studies serve as data points for conducting larger/better designed
studies which provide stronger evidence. Current trends may predict that SRV and
MA will continue to grow in the future. RCT is getting priority over the other subset
of CT; and although the proportion of RCT to CT has recently shown a stable but
significantly increasing trend, RCT is still important in order to gain valuable robust
evidence needed for better health care outcomes. This current study provides the first
large scale quantitative analysis of EBM publication trends.
Author Contributions
Conceived and designed the experiments: BTH NPL LPH NTL NHA TDN MVH
NTHT HFR NKA DH NTH KH. Performed the experiments: BTH NPL LPH NTL
NHA TDN MVH NTHT HFR NKA DH NTH KH. Analyzed the data: BTH NPL
LPH NTL NHA TDN MVH NTHT HFR NKA DH NTH KH. Contributed
reagents/materials/analysis tools: BTH NPL LPH NTL NHA TDN MVH NTHT HFR
NKA NTH. Wrote the paper: BTH NPL LPH NTL NHA TDN MVH NTHT HFR
NKA DH NTH KH.
References
1. 1.Goldman JJ, Shih TL (2011) The limitations of evidence-based medicine—
applying population-based recommendations to individual patients. Virtual
Mentor 13: 26–30. doi: 10.1001/virtualmentor.2011.13.1.jdsc1-1101.
pmid:23121813
o View Article
PubMed/NCBI
Google Scholar
2. 2.Talaulikar V, Nagarsekar U (2012) Evidence-Based Medicine: An
Obstetrician and Gynaecologist's Perspective. J Obstet Gynaecol India 62:
146–153. doi: 10.1007/s13224-012-0173-5. pmid:23543706
View Article
PubMed/NCBI
Google Scholar
3. 3.Gerber A, Lungen M, Lauterbach KW (2005) Evidence-based medicine is
rooted in Protestant exegesis. Med Hypotheses 64: 1034–1038.
pmid:15780507
View Article
PubMed/NCBI
Google Scholar
4. 4.Evidence-based medicine. A new approach to teaching the practice of
medicine. JAMA 268: 2420–2425. pmid:1404801
View Article
PubMed/NCBI
Google Scholar
5. 5.Woolf SH, George JN (2000) Evidence-based medicine. Interpreting studies
and setting policy. Hematol Oncol Clin North Am 14: 761–784.
pmid:10949772
View Article
PubMed/NCBI
Google Scholar
6. 6.Claridge JA, Fabian TC (2005) History and development of evidence-based
medicine. World J Surg 29: 547–553. pmid:15827845
View Article
PubMed/NCBI
Google Scholar
7. 7.Sackett DL, Rosenberg WM, Gray JA, Haynes RB, Richardson WS (1996)
Evidence based medicine: what it is and what it isn't. BMJ 312: 71–72.
pmid:8555924
View Article
PubMed/NCBI
Google Scholar
8. 8.Young T, Rohwer A, Volmink J, Clarke M (2014) What are the effects of
teaching evidence-based health care (EBHC)? Overview of systematic reviews.
PLoS One 9: e86706. doi: 10.1371/journal.pone.0086706. pmid:24489771
View Article
PubMed/NCBI
Google Scholar
9. 9.Chambers LW (1997) Evidence-Based Healthcare: How to Make Health
Policy and Management Decisions. CMAJ 157(110): 1598–1599.
View Article
PubMed/NCBI
Google Scholar
10. 10.Manchikanti L (2008) Evidence-based medicine, systematic reviews, and
guidelines in interventional pain management, part I: introduction and general
considerations. Pain Physician 11: 161–186. pmid:18354710
View Article
PubMed/NCBI
Google Scholar
11. 11.David H, Gorski SPN (2014) Clinical trials of integrative medicine: testing
whether magic works? Trends in Molecular Medicine.
12. 12.Lewis SJ, Orland BI (2004) The importance and impact of evidence-based
medicine. J Manag Care Pharm 10: S3–5. pmid:23570175
View Article
PubMed/NCBI
Google Scholar
13. 13.Rizzo JD (2005) Evidence-based medicine: can it be applied to stimulation
of erythropoiesis for patients with malignancy? Best Pract Res Clin Haematol
18: 439–448. pmid:15792918
View Article
PubMed/NCBI
Google Scholar
14. 14.Manchikanti L, Boswell MV, Giordano J (2007) Evidence-based
interventional pain management: principles, problems, potential and
applications. Pain Physician 10: 329–356. pmid:17387356
View Article
PubMed/NCBI
Google Scholar
15. 15.El Dib RP, Atallah AN, Andriolo RB (2007) Mapping the Cochrane
evidence for decision making in health care. J Eval Clin Pract 13: 689–692.
pmid:17683315
View Article
PubMed/NCBI
Google Scholar
16. 16.Osheroff JA, Forsythe DE, Buchanan BG, Bankowitz RA, Blumenfeld BH,
Miller RA (1991) Physicians' information needs: analysis of questions posed
during clinical teaching. Ann Intern Med 114: 576–581. pmid:2001091
View Article
PubMed/NCBI
Google Scholar
17. 17.Covell DG, Uman GC, Manning PR (1985) Information needs in office
practice: are they being met? Ann Intern Med 103: 596–599. pmid:4037559
View Article
PubMed/NCBI
Google Scholar
18. 18.Julie A (2004) What do you believe when drug messages conflict? USA
Today.
19. 19.Sastre EA, Denny JC, McCoy JA, McCoy AB, Spickard A 3rd (2011)
Teaching evidence-based medicine: Impact on students' literature use and
inpatient clinical documentation. Med Teach 33: e306–312. doi:
10.3109/0142159X.2011.565827. pmid:21609166
View Article
PubMed/NCBI
Google Scholar
20. 20.Eddy DM (2005) Evidence-based medicine: a unified approach. Health Aff
(Millwood) 24: 9–17. pmid:15647211
View Article
PubMed/NCBI
Google Scholar
21. 21.Sackett DL (1997) Evidence-based medicine and treatment choices. Lancet
349: 570; author reply 572–573. pmid:9048808
View Article
PubMed/NCBI
Google Scholar
22. 22.Epling J, Smucny J, Patil A, Tudiver F (2002) Teaching evidence-based
medicine skills through a residency-developed guideline. Fam Med 34: 646–
648. pmid:12455246
View Article
PubMed/NCBI
Google Scholar
23. 23.Dawes M, Summerskill W, Glasziou P, Cartabellotta A, Martin J,
Hopayian K, et al. (2005) Sicily statement on evidence-based practice. BMC
Med Educ 5: 1. pmid:15634359
View Article
PubMed/NCBI
Google Scholar
24. 24.Atkins D, Eccles M, Flottorp S, Guyatt GH, Henry D, Hill S, et al. (2004)
Systems for grading the quality of evidence and the strength of
recommendations I: critical appraisal of existing approaches The GRADE
Working Group. BMC Health Serv Res 4: 38. pmid:15615589
View Article
PubMed/NCBI
Google Scholar
25. 25.Tanjong-Ghogomu E, Tugwell P, Welch V (2009) Evidence-based
medicine and the Cochrane Collaboration. Bull NYU Hosp Jt Dis 67: 198–205.
pmid:19583554
View Article
PubMed/NCBI
Google Scholar
26. 26.Guyatt GH, Oxman AD, Vist GE, Kunz R, Falck-Ytter Y, Alonso-Coello P,
et al. (2008) GRADE: an emerging consensus on rating quality of evidence
and strength of recommendations. BMJ 336: 924–926. doi:
10.1136/bmj.39489.470347.AD. pmid:18436948
View Article
PubMed/NCBI
Google Scholar
27. 27.Heneghan C (2009) EBM resources on the new CEBM website. Evid
Based Med 14: 67. doi: 10.1136/ebm.14.3.67. pmid:19483016
View Article
PubMed/NCBI
Google Scholar
28. 28.Burns PB, Rohrich RJ, Chung KC (2011) The levels of evidence and their
role in evidence-based medicine. Plast Reconstr Surg 128: 305–310. doi:
10.1097/PRS.0b013e318219c171. pmid:21701348
View Article
PubMed/NCBI
Google Scholar
29. 29.Balshem H, Helfand M, Schunemann HJ, Oxman AD, Kunz R, Brozek J, et
al. (2011) GRADE guidelines: 3. Rating the quality of evidence. J Clin
Epidemiol 64: 401–406. doi: 10.1016/j.jclinepi.2010.07.015. pmid:21208779
View Article
PubMed/NCBI
Google Scholar
30. 30.Guyatt G, Oxman AD, Akl EA, Kunz R, Vist G, Brozek J, et al. (2011)
GRADE guidelines: 1. Introduction-GRADE evidence profiles and summary
of findings tables. J Clin Epidemiol 64: 383–394. doi:
10.1016/j.jclinepi.2010.04.026. pmid:21195583
View Article
PubMed/NCBI
Google Scholar
31. 31.Harbour R, Miller J (2001) A new system for grading recommendations in
evidence based guidelines. BMJ 323: 334–336. pmid:11498496
View Article
PubMed/NCBI
Google Scholar
32. 32.Sackett DL (1989) Rules of evidence and clinical recommendations on the
use of antithrombotic agents. Chest 95: 2S–4S. pmid:2914516
View Article
PubMed/NCBI
Google Scholar
33. 33.Graham AJ, Gelfand G, McFadden SD, Grondin SC (2004) Levels of
evidence and grades of recommendations in general thoracic surgery. Can J
Surg 47: 461–465. pmid:15646449
View Article
PubMed/NCBI
Google Scholar
34. 34.Medicine OCfE-B (2011). />
35. 35.Melnyk BM, Fineout-Overholt E (2005) Evidence-based practice in
nursing & healthcare: a guide to best practice.
36. 36.Hockenberry M, Wilson D, Barrera P (2006) Implementing evidence-based
nursing practice in a pediatric hospital. Pediatr Nurs 32: 371–377.
pmid:16927731
View Article
PubMed/NCBI
Google Scholar
37. 37.Aronson JK, Hauben M (2006) Anecdotes that provide definitive evidence.
Bmj 333: 1267–1269. pmid:17170419
View Article
PubMed/NCBI
Google Scholar
38. 38.Nichols M, Townsend N, Scarborough P, Rayner M (2013) Trends in agespecific coronary heart disease mortality in the European Union over three
decades: 1980–2009. Eur Heart J 34: 3017–3027. doi:
10.1093/eurheartj/eht159. pmid:23801825
View Article
PubMed/NCBI
Google Scholar
39. 39.Park HJ, Park EH, Jung KW, Kong HJ, Won YJ, Lee JY, et al. (2012)
Statistics of hematologic malignancies in Korea: incidence, prevalence and
survival rates from 1999 to 2008. Korean J Hematol 47: 28–38. doi:
10.5045/kjh.2012.47.1.28. pmid:22479275
View Article
PubMed/NCBI
Google Scholar
40. 40.Kim HJ, Fay MP, Feuer EJ, Midthune DN (2000) Permutation tests for
joinpoint regression with applications to cancer rates. Stat Med 19: 335–351.
pmid:10649300
View Article
PubMed/NCBI
Google Scholar
41. 41.Long NP, Huy NT, Trang NTH, Luan NT, Anh NH, Nghi TD, et al. (2014)
Scientific productivity on research in ethical issues over the past half century:
A JoinPoint regression analysis. Tropical Medicine and Health.
42. 42.Goovaerts P (2013) Analysis of geographical disparities in temporal trends
of health outcomes using space-time joinpoint regression. Int J Appl Earth Obs
Geoinf 22: 75–85. pmid:23710162
View Article
PubMed/NCBI
Google Scholar
43. 43.Goovaerts P, Xiao H (2011) Geographical, temporal and racial disparities
in late-stage prostate cancer incidence across Florida: a multiscale joinpoint
regression analysis. Int J Health Geogr 10: 63. doi: 10.1186/1476-072X-10-63.
pmid:22142274
View Article
PubMed/NCBI
Google Scholar
44. 44.Woodruff RSYelk, Winston CA, Miramontes R (2013) Predicting U.S.
Tuberculosis Case Counts through 2020. PLoS ONE 8: e65276. doi:
10.1371/journal.pone.0065276. pmid:23785416
View Article
PubMed/NCBI
Google Scholar
45. 45.Martins-Melo FR, Lima MdS, Ramos AN Jr., Alencar CH, Heukelbach J
(2014) Mortality and Case Fatality Due to Visceral Leishmaniasis in Brazil: A
Nationwide Analysis of Epidemiology, Trends and Spatial Patterns. PLoS
ONE 9: e93770. doi: 10.1371/journal.pone.0093770. pmid:24699517
View Article
PubMed/NCBI
Google Scholar
46. 46.Ilić M, Vlajinac H, Marinković J, Kocev N (2013) Pancreatic cancer
mortality in Serbia from 1991–2010—a joinpoint analysis. Croatian Medical
Journal 54: 369–375. pmid:23986278
View Article
PubMed/NCBI
Google Scholar
47. 47.Rodriguez-Ortiz PG, Munoz-Mendoza D, Arias-Cruz A, Gonzalez-Diaz
SN, Herrera-Castro D, Vidaurri-Ojeda AC (2009) [Epidemiological
characteristics of patients with food allergy assisted at Regional Center of
Allergies and Clinical Immunology of Monterrey]. Rev Alerg Mex 56: 185–
191. pmid:20088450
View Article
PubMed/NCBI
Google Scholar
48. 48.Namazi M, Amir Ali Akbari S, Mojab F, Talebi A, Alavi Majd H,
Jannesari S (2014) Aromatherapy with citrus aurantium oil and anxiety during
the first stage of labor. Iran Red Crescent Med J 16: e18371. doi:
10.5812/ircmj.18371. pmid:25068058
View Article
PubMed/NCBI
Google Scholar
49. 49.Holmes L Jr., Hossain J, Opara F (2012) Pediatric thyroid carcinoma
incidence and temporal trends in the USA (1973–2007): race or shifting
diagnostic paradigm? ISRN Oncol 2012: 906197. doi: 10.5402/2012/906197.
pmid:22530151
View Article
PubMed/NCBI
Google Scholar
50. 50.Holmes L Jr., Escalante C, Garrison O, Foldi BX, Ogungbade GO, Essien
EJ, et al. (2008) Testicular cancer incidence trends in the USA (1975–2004):
plateau or shifting racial paradigm? Public Health 122: 862–872. doi:
10.1016/j.puhe.2007.10.010. pmid:18555499
View Article
PubMed/NCBI
Google Scholar
51. 51.Helvie MA, Chang JT, Hendrick RE, Banerjee M (2014) Reduction in latestage breast cancer incidence in the mammography era: Implications for
overdiagnosis of invasive cancer. Cancer.
52. 52.Gomez SL, Noone AM, Lichtensztajn DY, Scoppa S, Gibson JT, Liu L, et
al. (2013) Cancer incidence trends among Asian American populations in the
United States, 1990–2008. J Natl Cancer Inst 105: 1096–1110. doi:
10.1093/jnci/djt157. pmid:23878350
View Article
PubMed/NCBI
Google Scholar
53. 53.Bryhn AC, Dimberg PH (2011) An operational definition of a statistically
meaningful trend. PLoS One 6: e19241. doi: 10.1371/journal.pone.0019241.
pmid:21552532
View Article
PubMed/NCBI
Google Scholar
54. 54.Wood J, Freemantle N, King M, Nazareth I (2014) Trap of trends to
statistical significance: likelihood of near significant P value becoming more
significant with extra data. BMJ 348: g2215. doi: 10.1136/bmj.g2215.
pmid:24687314
View Article
PubMed/NCBI
Google Scholar
55. 55.Walker E, Hernandez AV, Kattan MW (2008) Meta-analysis: Its strengths
and limitations. Cleve Clin J Med 75: 431–439. pmid:18595551
View Article
PubMed/NCBI
Google Scholar
56. 56.Crowther M, Lim W, Crowther MA (2010) Systematic review and metaanalysis methodology. Blood 116: 3140–3146. doi: 10.1182/blood-2010-05280883. pmid:20656933
View Article
PubMed/NCBI
Google Scholar
57. 57.Sibbald B, Roland M (1998) Understanding controlled trials. Why are
randomised controlled trials important? Bmj 316: 201. pmid:9468688
View Article
PubMed/NCBI
Google Scholar
58. 58.Io Medicine (2011) Clinical Practice Guidelines We Can Trust. The
national academic press. pmid:24983061
59. 59.Gallin JI, Ognibene FP (2012) Principles and Practice of Clinical Research
3rd edition: Academic Press. 796 p.
60. 60.Aronson JK (2003) Anecdotes as evidence. Bmj 326: 1346.
pmid:12816800
View Article
PubMed/NCBI
Google Scholar
61. 61.Lau J, Antman EM, Jimenez-Silva J, Kupelnick B, Mosteller F, Chalmers
TC (1992) Cumulative meta-analysis of therapeutic trials for myocardial
infarction. N Engl J Med 327: 248–254. pmid:1614465
View Article
PubMed/NCBI
Google Scholar
62. 62.Mulrow CD (1994) Rationale for systematic reviews. Bmj 309: 597–599.
pmid:8086953
View Article
PubMed/NCBI
Google Scholar
63. 63.Leape LL (1990) Practice guidelines and standards: an overview. QRB
Qual Rev Bull 16: 42–49. pmid:2110350
View Article
PubMed/NCBI
Google Scholar
64. 64.Woolf SH (1993) Practice guidelines: a new reality in medicine. III. Impact
on patient care. Arch Intern Med 153: 2646–2655. pmid:8250661
View Article
PubMed/NCBI
Google Scholar
65. 65.Kassirer JP (1993) The quality of care and the quality of measuring it. N
Engl J Med 329: 1263–1265. pmid:8413394
View Article
PubMed/NCBI
Google Scholar
66. 66.Lomas J, Anderson GM, Domnick-Pierre K, Vayda E, Enkin MW, Hannah
WJ (1989) Do practice guidelines guide practice? The effect of a consensus
statement on the practice of physicians. N Engl J Med 321: 1306–1311.
pmid:2677732
View Article
PubMed/NCBI
Google Scholar
67. 67.Nash DB (1990) Practice guidelines and outcomes. Where are we headed?
Arch Pathol Lab Med 114: 1122–1125. pmid:2241521
View Article
PubMed/NCBI
Google Scholar
68. 68.Lohr KN (1994) Guidelines for clinical practice: applications for primary
care. Int J Qual Health Care 6: 17–25. pmid:7953199
View Article
PubMed/NCBI
Google Scholar
69. 69.Stanley K (2007) Design of randomized controlled trials. Circulation 115:
1164–1169. pmid:17339574
View Article
PubMed/NCBI
Google Scholar
70. 70.Berthold DR, Gulamhusein A, Jackson JI, Tannock IF (2009) The
transition from phase II to phase III studies. J Clin Oncol 27: 1150–1151. doi:
10.1200/JCO.2008.21.1938. pmid:19171698
View Article
PubMed/NCBI
Google Scholar
71. 71.Valier H, Timmermann C (2008) Clinical trials and the reorganization of
medical research in post-Second World War Britain. Med Hist 52: 493–510.
pmid:18958251
View Article
PubMed/NCBI
Google Scholar