DSpace at VNU: Transpiration in a small tropical forest patch
Bạn đang xem bản rút gọn của tài liệu. Xem và tải ngay bản đầy đủ của tài liệu tại đây (716.41 KB, 22 trang )
Agricultural and Forest Meteorology 117 (2003) 1–22
Transpiration in a small tropical forest patch
Thomas W. Giambelluca a,∗ , Alan D. Ziegler a , Michael A. Nullet a ,
Dao Minh Truong b , Liem T. Tran c
a
b
Department of Geography, University of Hawaii at Manoa, 2424 Maile Way, Honolulu, HI 96822, USA
Center for Natural Resources and Environmental Studies, Vietnam National University, Hanoi, Viet Nam
c Earth System Science, Pennsylvania State University, University Park, PA 16802, USA
Received 12 July 2002; received in revised form 3 February 2003; accepted 6 February 2003
Abstract
A field study was conducted of microclimate and transpiration within a 12 ha patch of advanced secondary forest surrounded
by active or recently abandoned swidden fields. Differences in microclimate among stations located within and near the patch,
give evidence of the effects of the adjacent clearing on the environment in the patch.
Volumetric soil moisture content at the end of the dry season was lowest at the two edge sites, suggesting greater cumulative
dry season evapotranspiration (ET) there than at swidden and forest interior sites. Total evaporation, based on energy balance
methods, was also higher at the two edge sites than at the swidden or forest interior sites. Spatial differences in evaporation
decreased as conditions became wetter.
Measurements of sap flow in nine trees near the southwestern edge of the patch and nine trees in the patch interior indicate
considerable variability in transpiration among the three monitored tree species, Vernicia montana, Alphonsea tonkinensis,
and Garcinia planchonii. Dry-period transpiration averaged about 39 and 43% of total evaporation for edge and interior
trees, respectively, increasing to 60 and 68% after the start of rains. Transpiration in both zones was well-correlated with
micrometeorological conditions in the adjacent clearing, implying that transpiration edge effect is greatest when conditions are
favorable for high positive heat advection from the clearing to the forest edge. Transpiration rates of well-exposed trees were
higher than poorly-exposed trees, and decreased with distance from the edge at a statistically significant rate of −0.0135 mm
per day m−1 . Although the results on the strength of transpiration edge effect are somewhat equivocal due to variability
within the small sample, there is clear evidence that ET within the patch is influenced by the surrounding clearings. If edges
experience higher ET, greater fragmentation would result in higher regional evaporative flux, which would partly compensate
for the reduction in regional ET due to deforestation.
© 2003 Elsevier Science B.V. All rights reserved.
Keywords: Forest fragmentation; Forest hydrology; Tropical deforestation; Sap flow; Edge effect; Microclimate; Evapotranspiration
1. Introduction
The global rate of tropical deforestation exceeds
150,000 km2 per year (Whitmore, 1997). This alarm∗ Corresponding author. Tel.: +1-808-956-7683;
fax: +1-808-956-3512.
E-mail address: (T.W. Giambelluca).
ingly rapid land cover conversion raises concerns
regarding reduction of plant and animal biodiversity, impacts on the cultures of indigenous peoples,
modification of atmospheric chemistry and consequent global climate impacts, and regional to global
climatic and hydrologic effects of changing land
surface–atmosphere interaction. The remaining forest
in much of the tropics is confined to increasingly
0168-1923/03/$ – see front matter © 2003 Elsevier Science B.V. All rights reserved.
doi:10.1016/S0168-1923(03)00041-8
2
T.W. Giambelluca et al. / Agricultural and Forest Meteorology 117 (2003) 1–22
small patches of remnant primary and secondary forest. As Laurance and Bierregaard (1997) observe,
“fragmented landscape is becoming one of the most
ubiquitous features of the tropical world—and indeed,
of the entire planet.” Especially in the tropics, small
forest fragments are decreasing in size as forest edges
recede due to the effects of human disturbance in the
surrounding matrix (Gascon et al., 2000) Increasing
fragmentation of tropical land cover is generally perceived to have negative ecological impacts, including
alteration of the near-edge microclimate (Laurance
et al., 1998). Effects of fragmentation on regional
climate and hydrology are less well known.
Forest clearing is known to disrupt land surface–
atmosphere exchange of energy and mass by altering
the physical characteristics of the land surface. In
general, deforestation increases surface albedo and
reduces net radiation (e.g. Giambelluca et al., 1997,
1999). Forest removal affects evaporation1 by changing surface albedo, leaf area, aerodynamic roughness,
root depth, and stomatal behavior. Field studies have
confirmed that evaporation is significantly reduced
when tropical forest is replaced by pasture (e.g. Jipp
et al., 1998; Wright et al., 1992). As a result of
decreased evaporation, stream discharge increases
following deforestation (Bruijnzeel, 1990, 2001). The
effects of land cover change may also lead to regional
changes in atmospheric circulation and rainfall. For
example, general circulation model (GCM) simulations of the complete conversion of the Amazon rainforest to grassland, predict large reductions in basin
precipitation (Henderson-Sellers and Gornitz, 1984;
Lean and Warrilow, 1989; Shukla et al., 1990; Nobre
et al., 1991; Henderson-Sellers et al., 1993; Polcher
and Laval, 1994; McGuffie et al., 1995; Xue et al.,
1996; Hahmann and Dickinson, 1997). The rainfall
decrease is attributed, in part, to lower evaporation
in the basin, and consequent reduction in ‘recycling’
of evaporated water into additional basin rainfall
(Henderson-Sellers et al., 1993).
Estimating evaporation for regions with heterogeneous land cover is an important part of the problem of scaling energy, water, and momentum fluxes
(Veen et al., 1991), which has been undergoing intensive research (Kienitz et al., 1991; Stewart et al.,
1 In this paper, except when otherwise specified, “evaporation”
and “evapotranspiration” are equivalent.
1996; Famiglietti and Wood, 1994, 1995). A simple
mosaic approach can be used to take account of the
relative proportions of the dominant land cover types
by computing area-weighted averages of the fluxes
over each land cover type (e.g. Liang et al., 1994).
However, patch-scale fluxes are not independent of
the surroundings. Horizontal transfer of energy and
water vapor in the atmosphere may significantly alter the fluxes within a patch and hence invalidate a
strictly one-dimensional approach to estimating regional average fluxes. Such effects are greatest at the
boundaries of dissimilar land covers (Veen et al., 1991,
1996; Kruijt et al., 1991; Klaassen, 1992; Klaassen
et al., 1996). Near the upwind margin of a forest patch,
processes are influenced by the advection of sensible energy generated in the clearing and by turbulence generated at land cover boundaries. Air entering
a forest edge is relatively warm, dry, and turbulent,
thus increasing evaporation potential. This edge effect diminishes with distance toward the patch interior,
but remains significant for several tens of meters. As
Veen et al. (1991) noted, “regional evaporation may
be higher in a landscape with many patches of forest (many edges) as compared with a landscape with
the same total forest concentrated in large blocks.”
This dependency of regional latent energy flux on the
scale of landscape fragmentation was also shown by
Klaassen (1992) using a surface layer model.
Measurements of transpiration near forest edges are
sparse, due in part to the difficulties posed in field
measurements near surface discontinuities (cf. Gash,
1986). The few field observations which have been
made generally give evidence supporting the depiction
of the forest edge as a “special high-flux environment”
(Veen et al., 1996). For example, at a site 200 m downwind of a forest edge, Hutjes (1996) (cited in Veen
et al., 1996) observed turbulent energy fluxes to the
atmosphere (sum of latent and sensible energy fluxes)
up to 25% greater than net radiation. Theory suggests
that evaporation of intercepted rainfall would be especially influenced by edge effect. In fact, simulations by Veen et al. (1991) suggested that edge effects
would be maximal for a wet canopy, while dry canopy
transpiration would be affected very little. Contrary
to those expectations, throughfall measurements (e.g.
Neal et al., 1993) show almost no relationship with
distance from the forest edge. Klaassen et al. (1996)
concludes that proximity to the edge affects both the
T.W. Giambelluca et al. / Agricultural and Forest Meteorology 117 (2003) 1–22
interception storage capacity and the rate of evaporation of intercepted water, which cancel one another.
However, he speculates that the forest edge dries more
quickly, allowing transpiration to begin sooner after a
storm.
Other researchers have found indirect evidence of
greater evaporative flux near the forest edge. Working
in isolated forest reserves in central Amazonia, Kapos
(1989) found lower soil moisture within 10–20 m of
the forest margins. Studies of forest patch microclimate generally show significant gradients in temperature, humidity, solar radiation, and wind speed at levels
within and beneath the canopy (Matlack, 1993; Chen
et al., 1993; Murcia, 1995; Kapos et al., 1997; Turton
and Freiburger, 1997), which may suggest trends in
evaporation. Detectable effects generally were found
to extend as far as 20–50 m into the forest, with the
extent sometimes dependent on edge aspect, edge age,
or patch size.
Most studies of edge microclimate and turbulent
fluxes have been conducted over flat terrain. This
is done to minimize the effects arising from heterogeneities other than those associated with land cover.
Steep terrain further hampers the use of micrometeorological approaches to flux measurement and complicates the interpretation of results. However, in parts
of the tropics where landscape fragmentation is most
pronounced, such as montane Southeast Asia, studies
on flat terrain are impossible and perhaps irrelevant.
Theory strongly suggests that forest edges downwind of land with lower vegetation or bare soil will
experience higher rates of evaporation due to positive energy advection and enhanced turbulence. So
far, empirical evidence of this process is limited and
sometimes contradictory. Efforts are intensifying to
understand the effects of spatial heterogeneity and incorporate them into land surface–atmosphere schemes
3
and regional hydrologic models. The need to understand and quantify edge effects on transpiration increases as the tropical landscape continues to become
more fragmented. With this in mind, we conducted a
field study of the spatial variations in microclimate and
transpiration in a 12 ha forest patch in Ban Tat hamlet,
Hoa Binh, Vietnam. The objectives of this study were
to determine: (1) the effects of adjacent clearings on
the microclimate of a small forest patch, (2) the extent to which transpiration by trees is dependent on
distance from the edge of the patch, (3) whether transpiration edge effects vary by season (dry–wet); and
(4) the effects of variations in atmospheric conditions
on the spatial pattern of transpiration.
2. Field methodology
Our research strategy called for a measurement transect through a small forest patch oriented along the
prevailing wind direction (Fig. 1). We selected a 12 ha
patch of advanced secondary forest surrounded by
active or recently abandoned swidden fields. A narrow strip of younger secondary vegetation bordered
the northeastern side of the forest patch. We focused
our observations on the southwest-facing forest edge
(Fig. 2) because of its distinct boundary, the high contrast provided by its neighboring patch, and the expectation of frequent southwest winds (regional wind
direction during most of our observations were dominantly southwest, however, terrain and local thermal
influences produced mostly northwesterly or northeasterly surface winds at the site). Other forest edge
sites considered during an extensive ground survey
were rejected due to excessively steep slope.
To monitor microclimate variation within and near
the patch, we installed stations at four sites along a
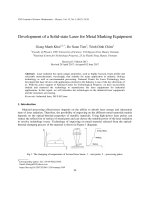
Fig. 1. Diagram showing idealized experimental design for investigation of forest patch microclimate and transpiration edge effect at Ban
Tat Hamlet, northern Vietnam.
4
T.W. Giambelluca et al. / Agricultural and Forest Meteorology 117 (2003) 1–22
Fig. 2. Map of the study site showing the location of Tat Hamlet in northern Vietnam, the locations of the four meteorological stations
(squares) and 18 trees (triangles) monitored for sap flow in relation to the forest patch boundary (forest is shaded) and elevation (m a.s.l.).
In the upper left panel, UTM coordinates (m) are given for scale.
T.W. Giambelluca et al. / Agricultural and Forest Meteorology 117 (2003) 1–22
5
Table 1
Meteorological observations
Station site
Height (m)
Sensora
Typeb
Rnet
Kd
Ku
Tir
Ta /RH
U/WD
RF
G
Tsoil
SM1
SM2
SM3
REBS*7
Eppley 8-48
Eppley 8-48
Everest 4000
Met-One 083C
Met-One 034A
Met-One
REBS HFT-3
CSI TCAV
CSI CS615
CSI CS615
CSI CS615
Observation periods
1997
29 June to 12 July
1998
24 March to 20 June
301
Swidden field
302
Forest edge
303
Forest interior
2.7
2.85
2.85
2.7
3.0
3.25
0.75
−0.08
−0.02, −0.06
0.0 to −0.3
−0.5 to −0.8
−1.2 to −1.5
–
–
–
12.1
12.3
12.55
–
–
–
0.0 to −0.3
−0.5 to −0.8
−1.2 to −1.5
13.57
–
13.5
13.5
14.05
14.25
–
−0.08
−0.02, −0.06
0.0 to −0.3
−0.5 to −0.8
−1.2 to −1.5
3 July to 12 July
25 March to 20 June
30 June to 12 July
27 March to 20 June
2 July to 12 July
28 March to 20 June
304
Secondary
vegetation edge
–
–
–
4.57
5.07
5.42
–
–
–
0.0 to −0.3
−0.5 to −0.8
−1.2 to −1.5
a
Rnet : net radiation, Kd : downward shortwave radiation, Ku : reflected shortwave radiation, Tir : infrared (surface) temperature, Ta : air
temperature, RH: relative humidity, U: wind speed, WD: wind direction, RF: rainfall, G: soil heat conduction, Tsoil : soil temperature, SM1 :
volumetric soil moisture at level 1, SM2 : volumetric soil moisture at level 2, and SM3 : volumetric soil moisture at level 3.
b REBS: Radiation Energy Balance Systems, Seattle, WA, USA; Eppley Laboratories, Newport, RI, USA; Everest Interscience, Fullerton,
CA, USA; Met-One, Grants Pass, OR, USA; CSI: Campbell Scientific, Logan, UT, USA.
SW–NE transect through the patch (Fig. 2). Observations at each site are described in Table 1. Sensors were
sampled at a 10 s interval and statistics were recorded
every 10 min with the exception of rainfall, which was
recorded minutely.
Meteorological methods for estimating evaporation
generally require a fetch of 100 m or more. In the case
of edge effect studies, the heterogeneity which violates
the assumptions of meteorological methods, is precisely the subject of the research. For this reason, we
sought an alternative method which could be applied
with equal reliability anywhere in a forest patch. We
chose to estimate transpiration in sample trees by monitoring sap flow using the heat dissipation technique
(Granier, 1985, 1987). Two Granier-type thermal dissipation probes (model TDP-30, Dynamax, Houston,
TX, USA) were installed in each of 18 trees, 9 each in
near-edge and interior zones of the patch. Three of the
most abundant tree species were selected, V. montana
Lour. (Euphorbiaceae), A. tonkinensis A. DC. (Annonaceae), and G. planchonii Pierre (Guttiferae), with
three individuals of each species monitored within
each of the two sap flow observation zones. Because
of the very high species diversity in the patch, we
were unable to limit our selections to individuals with
similar stem and crown diameter and crown exposure.
Sapwood depth in each tree was estimated using dyeing and heat dissipation techniques. Crown dimensions and exposure were assessed visually in the field.
Characteristics of sap flow trees are given in Table 2.
We surveyed the locations, species, and diameter
at breast height (DBH) of 328 trees (all trees with
DBH >5 cm) within and around the sap flow monitoring zones, and measured light extinction using a ceptometer (Model CEP, Decagon, Pullman, WA, USA),
in order to estimate the spatial pattern of leaf area index (LAI) within and between the sap flow monitoring
zones (Table 3).
Observations were conducted during two intensive field experiments during June–July 1997 and
March–June 1998. Results presented in this report
will focus on the 1998 observation period. For the
1998 experiment, meteorological measurements were
made continuously between 26 March and 20 June
1998; sap flow measurements were made during 1
April to 18 June 1998. Only 6 of 18 sap flow probes
6
T.W. Giambelluca et al. / Agricultural and Forest Meteorology 117 (2003) 1–22
Table 2
Characteristics of sap flow trees during 1998 experiment
Species
Edge zone
E1
V. montana
E2
V. montana
E3
V. montana
Crown area (m2 )
Stem radius (m)
Height (m)
17.49
17.74
18.39
0.0698
0.1237
0.0762
14
22
17
11.0
5.9
10.4
Good
Good
Poora
Distance from edge (m)
Exposure
E4
E5
E6
A. tonkinensis
A. tonkinensis
A. tonkinensis
18.33
15.49
16.37
0.0634
0.0587
0.0675
13
13
12
7.1
26.7
3.8
Poorb
Good
Poorb
E7
E8
E9
G. planchonii
G. planchonii
G. planchonii
12.83
27.07
32.12
0.0925
0.1175
0.1799
16
18
25
14.6
20.1
5.5
Poorb
Good
Poorb
57.52
25.15
60.13
0.1475
0.0748
0.1543
18
14
18
75.5
52.6
59.6
Good
Good
Good
Interior zone
F1
V. montana
F2
V. montana
F3
V. montana
F4
F5
F6
A. tonkinensis
A. tonkinensis
A. tonkinensis
13.40
11.26
35.89
0.0800
0.0735
0.0822
12
15
15
79.4
99.8
105.8
Good
Poorb
Good
F7
F8
F9
G. planchonii
G. planchonii
G. planchonii
41.96
28.65
41.71
0.1575
0.1373
0.1269
23
20
19
62.5
71.8
77.0
Good
Good
Good
a
b
Heavy vine infestation in crown.
Interference with sunlight and air flow due to overhanging and/or intertwining branches of other trees.
Table 3
Summary of tree survey
Number of trees surveyed
Number of tree species
Total basal area (m2 )
Estimated total active xylem areaa ,
Surveyed area, As (m2 )
Ax /As
Leaf area indexb
Ax (m2 )
Abundant tree species (count)
G. planchonii Pierre (Guttiferae)
Archidendron clypearia (Jack) Niels. (Leguminosae, Mimosoideae)
V. montana Lour. (Euphorbiaceae)
Heteropanax fragrans (Roxb.) Seem. (Araliaceae)
Ostodes paniculata Bl. (Euphorbiaceae)
Schefflera heptaphylla (L.) Frod. (Araliaceae)
A. tonkinensis A. DC. (Annonaceae)
Macaranga auriculata (Merr.) A.S. (Euphorbiaceae)
Edge zone
Interior zone
Total
161
68
4.211
2.078
1965
0.001058
2.67
147
66
5.408
2.682
2550
0.001050
2.19
308
105
9.619
4.760
4515
0.001054
2.40
9
17
7
9
0
5
7
8
15
4
7
5
12
8
3
0
24
21
14
14
12
13
10
8
Ax is the sum of active xylem area values estimated for each surveyed tree using Eq. (6).
LAI estimated using under canopy photosynthetically-active radiation (PAR) measurements in each 10 m × 10 m within each zone.
Although we do not have sufficient measurements to quantify the trend, leave area in the canopy increased during the study period in
response to the onset of rainy conditions.
a
b
T.W. Giambelluca et al. / Agricultural and Forest Meteorology 117 (2003) 1–22
were maintained during 24 April to 5 June 1998, while
investigators were away at another field site. During
that period, one tree of each species was selected for
monitoring (with one probe each) in the forest edge
and forest interior zones. The data derived from this
subset of three sensors in each zone are referred to
herein as “select”, and comprise a complete record
from 2 April to 17 June 1998.
3.1. Sap flow analysis
The Granier (1985, 1987) sap flow method is analogous to the hot-wire anemometer technique for measuring wind. Each probe consists of a pair of 1.2 mm
(o.d.) stainless steel needles installed into the tree stem
about 4 cm apart in a vertical line. A constant voltage
is applied to a resistor in the upper (heated) needle.
A copper-constantan thermocouple measures the temperature difference between the heated upper needle
and unheated lower reference needle. The flow of sap
cools the heated needle. Laboratory experiments have
shown that a reliable relationship exists between the
observed temperature difference and the sap flux per
unit sapwood area, i.e. the velocity of sap flow:
V = 0.0119
Tmax −
T
T
1.231
(1)
where V is average sap flow velocity along the length
of the probe (cm s−1 ), T the temperature difference
observed between the heated and reference needles,
and Tmax the value of T when sap flow is zero
(generally taken as the peak nighttime value of T).
Clearwater et al. (1999) confirmed the original
Granier (1985) calibration in the stems of tropical tree
species. However, they showed that this calibration
applied only when the entire length of the probe was
in contact with conducting xylem (sapwood). When
the length of the heated probe exceeds the thickness
of conducting xylem, the original calibration underestimates sap velocity. They proposed a correction
for Eq. (1) in which the T of the sapwood ( Tsw )
is computed as:
Tsw =
where a and b are the proportions of the probe in
sapwood and inactive xylem (b = 1 − a), respectively
(Clearwater et al., 1999). It can be readily seen that this
correction becomes very important as sapwood depth
decreases below probe length. For many of the sample
trees in our field study, this was the case. Hence, we
replaced T in Eq. (1) with Tsw calculated with
Eq. (2).
Sap flux (volume per unit time) can be computed as:
SF = V × Ax
3. Analysis
T − (b ×
a
Tmax )
(2)
7
(3)
where Ax is the cross-sectional area of active xylem
(sap-conducting wood). Transpiration of an individual
tree can be estimated as:
SF
Tr =
(4)
Ac
where Ac is the projected ground area of the tree
crown. Sap flow measurements can be used to scale
up to the stand level as:
Tr =
V¯ × Ax
As
(5)
whereTr is the mean stand level transpiration, V¯ the
average sap velocity of monitored trees, Ax the total cross-sectional area of active xylem for all trees in
the stand, and As the stand ground area. By measuring
Ax in a representative sample, a statistical relationship
can be developed between Ax and tree stem radius (see
below). The ratio
Ax /As can be estimated by applying that relationship to the list of stem radius values
obtained from a field survey of the stand (Table 3).
3.2. Sapwood depth
In light of Eq. (2), determination of the sapwood
depth in monitored trees is an essential prerequisite
for accurate interpretation of sap flow data. In many
studies, sapwood is identified by visual inspection the
wood coloration pattern of a severed stem or a core
extracted with an increment borer. Some researchers
inject dye into the transpiring stem before coring or
severing the stem above the injection site. We found
natural wood coloration of cores to give very little evidence of the active xylem region in our studied trees.
During 1997 and 1998 field experiments, we injected
dye into monitored trees. Subsequent cores gave unambiguous results in only a few trees. Dye was very
8
T.W. Giambelluca et al. / Agricultural and Forest Meteorology 117 (2003) 1–22
sparse or absent in the cores of 7 out of 18 trees, including all 6 Garcinia individuals. Uncertainty in sapwood depth estimates is an important issue in the use
of Granier-type probes (James et al., 2002). In an effort
to address this problem, a thermal dissipation probe
was developed, in which a 1 cm-long heater and thermocouple were thermally isolated at the tips of plastic
tubing (James et al., 2002). With this design, the sensor response is limited to sap flow in a narrow zone
at the depth of the probe tips. By sequentially moving
the probe to various depths, the resulting T profile
can be used to differentiate active and inactive xylem
regions, and hence determine sapwood depth. Botany
Department, University of Hawaii (Honolulu, USA)
and Hawaii Agricultural Research Center (Honolulu,
USA) staff built six 10 cm probes for our use at the
Ban Tat study site. During November 1999, 16 of the
original 18 sap flow trees (one tree had been felled,
apparently to obtain fruits, the other had died) were
resurveyed using these adjustable-depth probes. Combining the dye injection-coring results from June 1998
with the thermal dissipation probe results obtained in
November 1999, a good relationship (r 2 = 0.82) was
developed between sapwood depth and stem radius
(Fig. 3). Data from all three species were combined
to obtain the linear equation:
XD = 0.01325 + 0.29856 × SR
(6)
where XD is xylem depth (cm) and SR is stem radius (cm). In tropical forest in Panama, Meinzer et al.
Fig. 3. Relationship between xylem depth and stem radius for 1998
sap flow trees. Points are based on dye injection-coring results
from June 1998 and T profile observations made in November
1999 using Burns–Holbrook-type probes.
(2001) similarly found the sapwood depth–stem size
relationship to be consistent throughout a stand, independent of species. Applying this relationship to each
of the surveyed trees gives estimates of
Ax /As for
edge and interior zones (Table 3).
3.3. Evaporation methods
Over homogeneous vegetated surfaces, a onedimensional energy balance approach can be used
to estimate total evaporation. The method can be
expressed as (Monteith, 1973):
λE = Rnet − G − H
(7)
where λ is the volumetric latent heat of vaporization (J m−3 ), E the evaporation (m s−1 ), Rnet the net
radiation (W m−2 ), G (W m−2 ) the soil heat conduction, and H (W m−2 ), sensible energy flux to the
atmosphere, is estimated according to the resistance
method:
Hresistance =
ρCp (T0 − Ta )
ra
(8)
where ρ is air density (kg m−3 ), Cp the specific heat
of air at constant pressure (J Kg−1 K−1 ), T0 the temperature at the virtual source/sink height for sensible
heat exchange (K), Ta the air temperature (K), and
ra the aerodynamic resistance (s m−1 ). Measured infrared surface temperature may be substituted for T0
(Hatfield et al., 1984; Choudhury et al., 1986). Aerodynamic resistance can be estimated as a function
of wind speed, atmospheric stability, and the aerodynamic characteristics of the canopy parameterized in
terms of the zero plane displacement height (d), the
roughness length for momentum (z0 ), and the roughness length for sensible heat transfer (z0h ). Stability
corrections for estimating aerodynamic resistance appropriate for use with infrared surface temperature
measurements were recommended by Choudhury
et al. (1986).
Eq. (8) describes sensible heat transport to a level
well above the canopy. At the two measurement sites
within the forest patch (302 and 303), sensors were
above the canopy of the trees in the immediate area,
but below the level of some of the taller trees. Hence,
an alternative method of estimating H may be more appropriate at these two sites. Brenner and Jarvis (1995)
T.W. Giambelluca et al. / Agricultural and Forest Meteorology 117 (2003) 1–22
describe a sensible heat flux method based on estimated leaf boundary-layer conductance (gah ):
Hboundary-layer = ρCp (T0 − Ta )gah
(9)
where gah can be derived as a function of wind speed
and characteristic leaf dimension. For a given leaf geometry, gah can be approximated using:
gah = aub
(10)
where a and b are empirical coefficients (Brenner
and Jarvis, 1995). The value of a ranges from 0.023
for a laminar boundary-layer to 0.034 for a turbulent boundary-layer. The exponent b, ranges from
0.5 (laminar) to 0.8 (turbulent). For low wind speeds
(<2.7 ms−1 ), flow is approximately laminar.
Net radiation and soil heat flux were measured at
only two of four stations (301 and 303). Net radiation
was estimated at stations 302 and 303 as:
Rn = Kd − Ku + εA − εσT04
(11)
where Kd is the downward shortwave radiation, Ku
the reflected shortwave radiation (measured at station
303), ε the emissivity of the surface, A the downward
longwave radiation from the atmosphere, and σ =
5.67E−8 (Stefan–Botlzmann constant). We assumed
that solar radiation did not vary spatially over the study
area; therefore, Kd measured at 301 was used to estimate Rnet at 302 and 304. The vegetated surfaces at
302 and 304 were assumed to have albedos similar to
that of station 303, therefore, Ku measured at 303 was
substituted for Rnet estimates at 302 and 304. Infrared
measurements of surface temperature at 302 and 304
were used for T0 at the respective sites. We assumed
that downward longwave radiation did not vary over
the study area, allowing us to estimate εA for both 302
and 304 as:
εA = Rnet − Kd + Ku + εσT04
(12)
where Rnet , Kd , Ku , and T0 were all measured at station
301.
Soil heat conduction (G) was estimated at each of
two sites (301 and 303) on the basis of measurements
of two flux plates inserted at a depth of 8 cm and
a four-sensor averaging soil temperature probe with
probes inserted at depths of 2 and 6 cm. G was estimated as the average of the two flux plate measurements plus the change in sensible heat in the 0–8 cm
9
soil layer; soil specific heat was estimated as a function of the measured soil moisture in the upper 30 cm.
At stations 302 and 304, where G was not measured,
estimates from station 303 were substituted.
Land cover heterogeneity at the study site may
reduce the reliability of the energy balance approach
(Eq. (7)). For our clearing (station 301) and forest interior (station 302) sites, fetch over the respective surface is adequate under typical daytime conditions. The
forest edge (302) and secondary vegetation edge (304)
sites are often affected by the nearby land cover discontinuity, violating the assumptions of this method.
However, the approach has been shown to be more reliable than other methods for locations affected by upwind heteorogeniety. Blad and Rosenberg (1976), for
example, using the resistance formulation for H, found
the method to perform well under both non-advective
and strongly advective conditions. Brenner and Jarvis
(1995) were able to apply the boundary-layer conductance approach to estimate H for locations at
different distances downwind of a windbreak. However, they found that the values of the coefficients in
Eq. (10) varied significantly with distance from the
windbreak.
4. Observations and discussion
4.1. Meteorological conditions
With few exceptions, the conditions at the study
site during the 1998 measurement period were characterized by high humidity and light winds (Fig. 4).
Dew usually occurred during the early morning hours
and forest vegetation often remained wet until 0930
local time. Solar and net radiation were frequently reduced by overcast. For these reasons, we would expect
transpiration rates to be relatively low. The observation period straddles the onset of the summer monsoon and therefore includes the transition in moisture
conditions associated with the increase in rainfall during mid-May 1998. Soil moisture content (Fig. 4f)
clearly reflects the abrupt monsoonal transition. Although regional winds were dominantly southwesterly during most of the observation period, surface
wind direction was strongly influenced by the mechanical and thermal effects of local topography and land
cover. As a result, daytime winds were generally either
10
T.W. Giambelluca et al. / Agricultural and Forest Meteorology 117 (2003) 1–22
Fig. 4. Meteorological conditions during the 1998 observation period: (a) daily mean solar and net radiation, (b) daily mean air and surface
temperature, (c) daily mean relative humidity, (d) daily mean wind velocity, (e) daily total rainfall, and (f) daily mean volumetric soil
moisture content.
T.W. Giambelluca et al. / Agricultural and Forest Meteorology 117 (2003) 1–22
Fig. 5. Wind roses for the four meteorological stations within and
near the forest patch study area, based on daytime periods during
the 1998 observation period only. Lines show the approximate
orientation of the forest boundary at the southwestern edge of the
patch.
11
northwesterly or northeasterly and differed somewhat
from site to site (Fig. 5).
The effects of proximity to the forest edge can
be seen in the gradients in mid-day air temperature,
surface temperature, humidity, wind speed, and soil
moisture content (Fig. 6). Here we focus on the three
stations located from the swidden field (301) to the
forest interior (303). Data indicate a weak trend in
daytime air temperature, with temperature declining
toward the interior of the patch. The mid-day surface
temperature of the swidden field site was dramatically higher than those of the forest edge or interior,
as expected. Note that for the forest edge site, surface
temperature was less than air temperature, indicating
downward sensible heat flux (positive heat advection),
and was markedly lower than the surface temperatures
of the swidden field or the canopy temperature of the
forest interior. The depressed mid-day surface temperature indicates high latent heat flux at the forest
edge. Mean relative humidity (RH) increased toward
the forest interior. The low RH over the swidden
field results from higher temperatures and reduced
Fig. 6. Horizontal gradients of (a) mid-day (12:00–14:00) air temperature (Ta ) and infrared canopy (surface) temperature (Tir ), (b) relative
humidity, (c) wind speed, and (d) soil moisture in three depth layers near the forest edge. Shown are means for the 1998 study period,
except where dates are given, in which case 1 day mean values are given. Error bars for the study period means show the standard
deviation of daily values.
12
T.W. Giambelluca et al. / Agricultural and Forest Meteorology 117 (2003) 1–22
evapotranspiration over the sparsely vegetated surface.
For comparison, mean wind speed at each site is adjusted to a common reference height 3 m above the
respective zero plane displacement height. The higher
wind speed seen over the smoother surface of the swidden field is reduced dramatically over the forest edge
and interior sites.
The soil moisture profiles for 1 May (Fig. 6d) suggests that dry season soil extraction by roots, especially in the 30–60 cm layer (and hence transpiration
of plants with roots in that layer), had been greater
at the forest edge site than at the swidden field or
forest interior sites (assuming similar soil water retention properties and similar soil moisture content at
the start of the dry season). This pattern can also be
seen in the daily time series of 0–90 cm soil moisture (Fig. 4f). This finding is similar to that of Kapos
(1989) at an Amazonian site. In the 60–90 cm layer,
however, dry season soil water extraction was apparently greatest at the interior site. By the time of the 8
June profile, despite the persistent rains that had been
recharging soil moisture for several weeks, the lowest
30–60 cm soil moisture was again found at the forest edge site. 1 May soil moisture at all three levels
was highest at the swidden field site. This reflects depressed dry season evaporation of bare soil sites. These
observations are generally consistent with the Veen
et al. (1996) depiction of the forest edge as a high-flux
environment, i.e. a zone which actively absorbs thermal energy advected from surrounding cleared areas,
damps wind speed, and transpires at a relatively high
rate.
4.2. Sap flow
Analysis of the 1997 sap flow observations was limited to five of the six V. montana individuals used in
1998 (E1, E2, F1, F2, and F3). Transpiration in the
sample trees was estimated using Eq. (4). Mean transpiration during 4–11 July 1997 is shown in Fig. 7 as a
function of distance from the edge of the patch. These
results suggested that transpiration was enhanced by
proximity to the swidden field. However, the significance level of the slope was not sufficient to draw firm
conclusions regarding edge effect. The value of the
1997 measurements was limited by the small number
of sample trees, the use of only one species, and the
short duration of the measurements.
The 1998 observations were more comprehensive in
the number of individuals, number of species, and the
period of observation. For the 1998 period, statistics of
sap velocity, computed with Eq. (1), and transpiration,
based on Eq. (4), are summarized for each sample
tree in Table 4. Statistics are shown for the dry period
(through 19 May), wet period (beginning 20 May),
and the whole period (1 April to 17 June).
Significant differences in sap velocity were found
among species and among individual trees. In general,
velocities were greatest for V. montana, and least for
G. planchonii. There were no clear differences in sap
velocity between edge and forest interior trees. In general, mean sap velocity decreases with increasing stem
size. Meinzer et al. (2001) found a strong negative exponential relationship (r2 = 0.88) between sap velocity and stem size within a diverse stand of tropical trees
Fig. 7. Sap flow-derived transipiration in five V. montana individuals as a function of distance from the edge of the patch; based on
observations taken during 4–11 July 1997 within the forest patch study area.
T.W. Giambelluca et al. / Agricultural and Forest Meteorology 117 (2003) 1–22
13
Table 4
Summary of sap flux density and transpiration estimates for individual trees
Zone
Edge
Forest
Tree
Species
Sap velocity (cm per day) mean ± S.D.
Transpiration (mm per day) mean ± S.D.
Drya
Whole period
Drya
Weta
Wetb
Whole period
E2
E3
E4
E5
E6c
E7
E8c
E9
V. montana
V. montana
V. montana
A. tonkinensis
A. tonkinensis
A. tonkinensis
G. planchonii
G. planchonii
G. planchonii
14.8
6.0
4.8
4.9
10.0
6.6
3.2
4.1
1.5
±
±
±
±
±
±
±
±
±
4.7
2.1
1.9
1.9
3.3
2.6
1.3
1.6
0.6
19.7
14.2
13.4
10.7
21.6
12.3
5.7
4.6
2.9
±
±
±
±
±
±
±
±
±
7.3
4.1
4.8
3.2
5.9
5.3
2.3
2.8
1.5
16.7
8.9
7.8
7.0
14.1
8.7
4.0
4.3
2.0
±
±
±
±
±
±
±
±
±
6.3
4.9
5.3
3.7
7.1
4.8
2.1
2.1
1.2
1.49
1.93
0.56
0.40
0.82
0.68
0.77
0.76
0.56
±
±
±
±
±
±
±
±
±
0.48
0.68
0.23
0.16
0.27
0.27
0.31
0.29
0.21
1.99
4.55
1.54
0.87
1.77
1.28
1.37
0.86
1.08
±
±
±
±
±
±
±
±
±
0.74
1.32
0.57
0.26
0.48
0.55
0.56
0.53
0.57
1.68
2.86
0.91
0.57
1.15
0.90
0.98
0.80
0.74
±
±
±
±
±
±
±
±
±
0.63
1.58
0.61
0.30
0.58
0.49
0.50
0.40
0.45
F1
F2c
F3
F4
F5
F6c
F7
F8c
F9
V. montana
V. montana
V. montana
A. tonkinensis
A. tonkinensis
A. tonkinensis
G. planchonii
G. planchonii
G. planchonii
6.2
15.1
8.3
6.5
2.7
3.9
4.1
2.6
2.0
±
±
±
±
±
±
±
±
±
2.4
5.2
2.7
2.2
0.8
1.1
1.6
0.8
0.8
15.2
25.2
13.9
11.6
5.0
7.6
8.2
3.8
3.4
±
±
±
±
±
±
±
±
±
3.7
9.4
3.7
3.2
1.4
3.1
2.7
1.5
1.3
9.5
18.9
10.3
8.3
3.5
5.3
5.6
3.0
2.5
±
±
±
±
±
±
±
±
±
5.2
8.6
4.1
3.6
1.5
2.7
2.9
1.3
1.2
0.88
1.25
1.22
1.15
0.49
0.27
0.89
0.62
0.29
±
±
±
±
±
±
±
±
±
0.34
0.43
0.40
0.39
0.15
0.08
0.35
0.20
0.11
2.15
1.92
2.05
2.07
0.90
0.52
1.78
0.93
0.48
±
±
±
±
±
±
±
±
±
0.52
0.80
0.55
0.58
0.25
0.22
0.59
0.35
0.18
1.34
1.50
1.52
1.48
0.64
0.36
1.21
0.74
0.36
±
±
±
±
±
±
±
±
±
0.74
0.67
0.61
0.64
0.27
0.19
0.62
0.31
0.17
E1c
a
1 April to 19 May.
20 May to 17 June.
c Only the trees indicated with asterisks were monitored during the period 24 April to 5 June. Summary statistics are given for the
three “select” trees over the full observation.
b
in Panama. We also found a significant (P = 0.05)
negative exponential relationship for our sample trees,
but it was rather weak (r2 = 0.23). Sap velocity versus stem size for A. tonkinensis and G. planchonii fell
reasonably close to the relationship found by Meinzer
et al. (2001). Differences among species are even more
apparent in terms of transpiration. V. montana transpired at about twice the rate of A. tonkinensis, and G.
planchonii. Other sap flow-based studies have found
contrasts in sap velocity and transpiration among different species (e.g. Granier et al., 1996; Schaeffer
et al., 2000). Even for the same species, transpiration
rates were quite variable among individual trees.
4.3. Total evaporation
We estimated total evaporation (λE) at each of the
four meteorological stations using Eq. (7) with the resistance formulation for H (Eq. (8)). Aerodynamic parameters were estimated based on vegetation height
and density, and, in the case of the swidden field site
(301), the soil surface roughness. For the swidden field
site (301), a crop was planted at about the same time
as our observations began. Roughness of the soil surface, tree stumps, and cut vegetation was judged to be
equivalent to 1.15 m-tall vegetation. At the end of the
study, the crop had reached 2 m in height. The parameters z0 and d for that site were assumed to increase
linearly with time during the observation period; z0
started at 0.13 m and increased at 0.0011 m per day;
d started at 0.65 and increased at 0.0058 m per day.
Mean vegetation height was estimated to be 16 m for
the whole forest patch (though lower in the vicinity
of the two stations 302 and 303, and 3.1 m at station
304. Constant values of z0 and d were used for these
three sites; z0 = 1.8, 1.8, and 0.35 m, and d = 8, 7,
and 2.45 m at 302, 303, and 304, respectively. At all
sites, z0 was set to 0.113h, where h is the vegetation
height. Here we used a higher value of z0 /h, conventionally set at 0.1, to account for effects of rough terrain and variable canopy height. The ratio z0 /z0h was
assumed to be 0.1. The value of d was shifted from
a typical setting of 0.65h in an attempt to account for
differences in vegetation density.
14
T.W. Giambelluca et al. / Agricultural and Forest Meteorology 117 (2003) 1–22
For sites 302 and 303, Eqs. (9) and (10) were used
as an alternative method of estimating H. The coefficients in Eq. (10) were set at mid-range values,
a = 0.30 and b = 0.65. To check the sensitivity of
these estimates to changes in a and b, we made estimates of λE with parameters set for the extremes of
laminar and turbulent boundary-layer conditions. We
found the λE estimate at 302 to be insensitive to the
method (using Hresistance or Hboundary-layer ) and to the
selection of parameter values for Eq. (10). The mean
λE/Rnet ratio for station 302 was 0.970 using the resistance method, and 1.002, 0.998, and 0.993, for the
boundary-layer method using coefficients set for laminar, mid-range, and turbulent conditions, respectively.
At station 303, the estimate was more sensitive to the
method used, with a mean λE/Rnet ratio of 0.663 for
the resistance method, and 0.825, 0.867, and 0.869
for the boundary-layer method using the three differ-
ent sets of coefficient values. The higher λE values
derived using Hboundary-layer for the forest interior site
are more conservative with respect to showing λE enhancement at the forest edge. The differences due to
selection of Eq. (10) coefficients are not large. Therefore, we will present λE for stations 302 and 303 based
on the boundary-layer approach with coefficients set at
mid-range values. For the other two sites, we present
λE derived using the resistance method. If we had
elected to use the resistance method for all four sites,
qualitative results (e.g. relative ordering of λE among
the four sites) would not have been affected.
The time series of daily daytime (0:800–18:00 local time) λE and the fraction of net radiation used for
evaporation (λE/Rnet ) at the four stations are shown
in Fig. 8. Means are derived from measurements and
calculations at a 10 min interval, then averaged for the
daytime period. Periods with rainfall are included. λE
Fig. 8. Time series of total evaporation estimated using an energy balance approach for four stations in the forest patch study area: (a)
daily evaporation (given in latent energy units (W m−2 )) and (b) the ratio of latent heat flux to net radiation.
T.W. Giambelluca et al. / Agricultural and Forest Meteorology 117 (2003) 1–22
at all four stations increased during the study period,
as would be expected in response to improving soil
moisture availability and increasing LAI. Comparing
the first and last 5-day periods in the study, λE increased 18, 17, 20, and 10% at the four sites 301–304,
respectively. At 301, λE was highly responsive to
day-to-day variations in soil moisture. The maximum
daily λE rate during wet conditions at the end of the
study was nearly four times as great as that of the
minimum daily rate during the driest period in late
April. Throughout the study period, the magnitude of
λE varied by site, with λE302 > λE304 > λE303
λE301 . This ordering can be seen more clearly in
terms of λE/Rnet (Fig. 8b).
4.4. Sap flow versus total evaporation
The energy equivalent of daily sap flow-based transpiration (24 h means) for edge and interior zones
(Eq. (5)) are compared with estimated daily λE (24 h
means) in Fig. 9. Only transpiration measurements
based on the full array of sensors are used here; hence,
the period 25 April to 5 June is excluded. It is apparent from the scattergrams (Fig. 9), that relationship
between transpiration and λE differed for the early
(dry) and late (wet) periods. The proportion of λE accounted for by transpiration in sampled canopy trees
increased from 0.39 to 0.60 at the edge and from 0.43
15
to 0.68 in the interior. The relative contribution of the
canopy transpiration is lower than generally found
in other studies (e.g. Willschleger et al., 2001). The
increases in transpiration as a proportion of λE correspond to increases in transpiration in both zones from
<40% to about 60% of net radiation over the course
of the observation period. In general, the difference
between transpiration and total evaporation may be
explained by (1) evaporation of intercepted rainfall,
fog, and dew, (2) understory evapotranspiration, (3)
soil evaporation, (4) errors in sap flow estimates due
to uncertainties in sap flow probe measurements,
xylem depth, and basal area, (5) errors in total evaporation estimates due to uncertainties in meteorological
observations and parameter values, and violation of
model fetch requirements. During wet conditions, we
would expect interception evaporation and soil evaporation to become more important components of λE,
and transpiration, therefore to decrease as a fraction
of λE. For example, in a high-latitude forest, Kelliher
et al. (1998) found that the relative contribution of
the understory to total evaporation reached 54%, the
highest level observed during their study, on the day
immediately following a significant rainfall event. Our
findings here are contrary to those expectations. We
believe this result is due to the obvious increase in LAI
of the sampled canopy trees observed (but not measured) during the study period. Under this scenario,
Fig. 9. Scattergrams of daily evaporation estimated using an energy balance approach and transpiration derived from sap flow measurements
for forest edge and forest interior. Regressions are shown for dry (1–23 April) and wet (6–17 June) periods. Data omitted for period with
reduced number of sensors (24 April to 5 June).
16
T.W. Giambelluca et al. / Agricultural and Forest Meteorology 117 (2003) 1–22
the understory, whose LAI did not increase as noticeably, would contribute proportionately less to λE as
the canopy LAI increased. Because our LAI measurements were not taken systematically through time, we
cannot give quantitative estimates of this effect.
slope of soil moisture content versus time during rainless periods (Fig. 4f), an indication of the λE rate, is
greatest at the two edge sites.
4.5.2. Transpiration versus meteorological conditions
Daily edge and forest interior stand transpiration
are well-correlated with daytime (0:800–18:00) atmospheric forcing variables measured in the clearing; solar radiation: r = 0.739 (edge) and 0.682 (interior);
net radiation: r = 0.743 and 0.691; air temperature:
r = 0.721 and 0.734; and relative humidity: r =
−0.523 and −0.477. Transpiration in both stands is
more highly correlated with Rnet , Ta , and RH measured in the clearing than with corresponding measurements within the stands. These results suggest that
transpiration in the forest patch is enhanced during relatively clear, sunny periods when the clearing is dry
and hot, i.e. periods when conditions are conducive to
high positive heat advection.
4.5. Edge effect
4.5.1. Total evaporation
Comparing total evaporation among the four meteorological stations (Fig. 8) strongly suggests that surrounding cleared lands influence the spatial pattern
of evaporation within the patch. This is most clearly
seen in Fig. 8b, where site differences in Rnet are controlled. Daily λE/Rnet at the four sites are all statistically different from each other (P < 0.0001, paired
comparison, t-test). Note that the two edge sites, stations 302 (over forest just inside the SW edge of the
patch) and 304 (over secondary vegetation just outside
the NE edge) consistently had the highest λE/Rnet values. Evaporation at the forest interior station was intermediate between the rates of the swidden and edge
sites. Toward the end (wetter) part of the observation
period, λE of the forest interior site approached that
of the two edge stations, suggesting that edge effect is
greater under dry canopy conditions. In fact, the apparent enhancement of λE at the edge (relative to the
interior) is greatest when λE in the adjacent clearing
is depressed by dry soil conditions.
These findings are consistent with differences in
soil moisture at the four sites (Fig. 4f). As mentioned,
lower soil moisture at the two edge stations suggests
greater cumulative dry season λE. Also, note that the
4.5.3. Comparison of zones
Transpiration estimates were scaled up from the individual tree level to stand level for the edge and forest
interior zones using Eq. (5). A comparison of the two
transpiration time series (not shown) reveals that the
mean transpiration of the edge zone was consistently
higher than that of the interior zone. The difference
between the zones was greatest on days with relatively
high rates of transpiration. To test the significance of
the difference, we compare mean transpiration rates
estimated from individual trees (Eq. (4)) in each zone
(Table 5). Comparisons are made of zonal means based
on all trees and for well-exposed trees (Table 2) only,
and for the whole study period, dry period only, and
Table 5
Mean of individual tree transpiration means for edge and interior zones
Sample
Mean transpiration (mm per day)
± CVa edge (%)
n
Interior (%)
n
Difference (%)
P-valueb
Whole
Whole: well-exposed
1.18 ± 59.9
1.64 ± 51.3
9
4
1.02 ± 48.2
1.06 ± 46.4
9
8
15.7
55.5
0.585
0.267
Dry
Dry: well-exposed
0.89 ± 56.3
1.21 ± 43.9
9
4
0.78 ± 49.1
0.78 ± 47.6
9
8
12.9
52.4
0.637
0.204
Wet
Wet: well-exposed
1.71 ± 66.7
2.46 ± 59.3
9
4
1.42 ± 49.2
1.56 ± 47.1
9
8
19.5
54.0
0.543
0.310
Values are given for the whole study period, the dry period (prior to 20 May), and the wet period (after 20 May).
a CV: coefficient of variation of individual tree means in each sample.
b Results of two sample t-test, assuming unequal variances.
T.W. Giambelluca et al. / Agricultural and Forest Meteorology 117 (2003) 1–22
wet period only. In all cases, mean values for the edge
zone are higher than for the interior. However, due
to the small sample size (number of trees) and the
high variability among individual trees, none of the
differences are statistically significant.
Lumping the transpiration measurements into two
groups gives only a coarse picture of the spatial variability of transpiration within the patch. Below we
evaluate one- and two-dimensional spatial patterns,
looking for evidence of transpiration edge effect.
4.5.4. Spatial trend in transpiration
Variation in transpiration among individuals may be
attributed to differences in (1) species, (2) location relative to the forest edge, (3) exposure due to vertical and
horizontal position of crown relative to neighboring
tree crowns (influenced in some cases by topography),
(4) the amount of vine infestation, and (5) leaf area
index. Evidence that differences in transpiration are
related to proximity to the forest edge (item 2 above)
may be obscured by the other factors listed above. Examining mean transpiration rates of individual trees as
a function of location, indicates a statistically insignificant negative trend in transpiration with distance
from the edge (Fig. 10, middle trend line). However,
by selecting only well-exposed trees (Table 2) we
obtain a better result. Well-exposed trees have higher
mean transpiration rates than poorly-exposed trees,
17
and a statistically significant trend with distance from
the edge of −0.0135 mm per day m−1 (Fig. 10). The
trend for poorly-exposed trees is not significant. It
should be noted that the trend for well-exposed trees
is strongly dependent on the high mean transpiration
rate found for a single tree, E2. If we remove E2 from
the sample of well-exposed trees, the trend is reduced
in half, and the P-value increases from 0.02 to 0.13,
i.e. it no longer meets our criterion for significance.
4.5.5. Mean 2D spatial patterns of transpiration
To examine the spatial patterns of transpiration
within the patch, we analyzed the two-dimensional
pattern using spatial mapping software (Surfer,
Golden Software, Golden, CO, USA). Here we use
all trees regardless of crown exposure, but attempt to
remove differences among the three species by normalizing the data, dividing the transpiration rate of
each tree by its respective species mean. Values were
interpolated/extrapolated to a 1 m × 1 m grid using the
Kriging option in Surfer. Default settings are used for
all Kriging options except error nugget, which is set at
0.05. Fig. 11 shows the mean pattern of transpiration
for the whole study period. The spatial pattern shown
in Fig. 11 suggests transpiration enhancement near
the edge. The spatial trend in transpiration extends
through both the edge and interior zones, suggesting
that transpiration edge effect extends at least 100 m
Fig. 10. Mean whole period transpiration of individual trees as a function of distance from the forest edge. Rates of well-exposed trees
(those rated as having good or fair exposure to sunlight and wind) and poorly-exposed trees are shown as open circles and closed squares,
respectively. Lines shown for well-exposed, poorly-exposed, and all trees, are based on regressions of mean transpiration versus distance
from the forest edge.
18
T.W. Giambelluca et al. / Agricultural and Forest Meteorology 117 (2003) 1–22
pattern was influenced by the adjacent clearing, we
examined variations in the pattern as it responded
to different weather conditions, including wind
direction.
Fig. 11. Spatial patterns of normalized transpiration, based on
means for the whole study period. Axis labels give UTM coordinates (m).
from the southwestern edge of the patch. The decreasing trends to the northwest and southeast of this peak
are partly artifacts of extrapolation outside the observation areas.
The mean transpiration pattern (Fig. 11) suggests
enhancement of transpiration along the southwestern
edge of the patch despite the fact that wind in the adjacent clearing often was not oriented toward the patch.
We expected to find edge effect chiefly when warmer
drier air from the adjacent clearing moved into the
patch. At the swidden station (located 45 m from the
forest edge), daytime wind direction indicated flow
crossing the patch boundary moving into the patch
during only 32% of the daytime observations. Wind
direction at that station is strongly influenced by the
local topography, tending to flow parallel to the axis
of the small valley there. Villagers who assisted us in
the field maintained a small hut just outside the forest
edge. We often observed smoke from their cooking
fire to move parallel to the patch boundary, with eddies
diffusing the smoke into the patch. We suspect that the
movement of air across the southwest patch boundary
from the clearing into the patch was more frequent
than was indicated by measured wind direction at the
clearing site. To verify that the observed transpiration
Fig. 12. Spatial patterns of normalized transpiration for hourly
periods on 8 April 1998. Also shown is wind speed and direction
in the clearing (size and orientation of arrow).
T.W. Giambelluca et al. / Agricultural and Forest Meteorology 117 (2003) 1–22
4.5.6. Changing spatial patterns of transpiration
during 8 April
We analyzed the patterns of normalized transpiration for each hour during 8 April (Fig. 12) to determine whether response to short-term variation in wind
direction could be observed in the spatial pattern of
transpiration. Values were normalized using the mean
dry-period transpiration for each tree. Arrows represent wind speed and direction in the clearing. Conditions on 8 April were partly cloudy with moderate
humidity. Changes in transpiration during the day follow the diurnal cycles of radiation and relative humidity, with the highest values at mid-day. During the
morning, winds were SSW to S in the clearing and E to
ENE at the interior zone (not shown). As the day progressed, winds in the clearing shifted to SE, and at the
interior were E to ESE. The spatial pattern during the
morning was bimodal with peaks near the edge and at
the NE corner of the interior zone. Enhancement at the
edge peaked at mid-day. During the afternoon, the pattern changed as wind direction at the edge shifted, until by mid-afternoon, with wind then roughly parallel
to the SW patch boundary, no edge enhancement was
evident. The diurnal variation in the pattern near the
edge confirms that edge effect is sensitive to edge orientation and wind direction. The morning and mid-day
interior peak may be related to the easterly wind there.
Although the patch extends several hundred meters
east of this area, there is a gap in the canopy along
the NE portion of the interior zone, and a steep downward slope in that direction. Trees at the extreme NE
corner are exposed to easterly winds and transpiration
appears to have been enhanced as a result. This is evidence that transpiration enhancement can occur not
only at exposed forest edges, but also within the patch
where topography or canopy structure exposes trees to
energy advected from cleared land outside the patch.
2.
3.
4.
5.
6.
7.
8.
5. Conclusions
9.
Our field observations within and near a small forest
patch in Ban Tat provide the following information
regarding patch microclimate and transpiration:
1. The effects of proximity to the forest edge can
be seen in the microclimatic gradients. Mid-day
air temperature declined from the swidden field
10.
19
to the patch interior. Mid-day surface temperature
was highest over the swidden field and lowest at
the forest edge. Relative humidity increased into
the patch. Reference height wind speed decreased
sharply across the forest patch boundary.
Soil moisture content at the end of the dry season
was lowest at the forest edge and secondary vegetation edge sites, suggesting greater cumulative
dry season evapotranspiration there than at swidden and forest interior sites.
Considerable variability in transpiration was observed among trees, especially among different
species.
As conditions became wetter, canopy transpiration as a fraction of total evaporation increased
from 0.39 to 0.60 at the edge and from 0.43 to
0.68 in the interior. This unexpected finding may
have been the result of increasing overstory LAI
during the study period.
Daytime total evaporation was highest at the forest edge and secondary vegetation edge sites. The
lowest daytime total evaporation was observed at
the swidden site. The difference between evaporation at edge and the interior decreased as conditions became wetter.
Transpiration of both forest edge and interior
zones is highly correlated with conditions in the
adjacent swidden field. This implies that edge effect on transpiration is greatest when conditions
are favorable for high positive heat advection
from the clearing to the forest edge.
Mean transpiration rates of the edge and interior
zones, based on averages of sap flow rates in all
trees in each zone, were not significantly different.
Analyzing transpiration of each tree on the basis
of distance from the edge, resulted in a statistically
significant linear trend in average transpiration of
−0.0135 mm per day m−1 for well-exposed trees.
However, this trend is strongly dependent on the
high transpiration rate of one individual tree.
The mean two-dimensional transpiration pattern
suggests enhancement near the edge.
Hour-to-hour changes in the transpiration pattern
were responsive to shifts in wind direction. However, it appears that, even in the patch interior,
tree crowns exposed to advected energy because
of topographic position or canopy structure, also
experience enhanced transpiration.
20
T.W. Giambelluca et al. / Agricultural and Forest Meteorology 117 (2003) 1–22
The results obtained in this study show that the
magnitude and spatial pattern of transpiration in small
forest patches is strongly influenced by the conditions
in surrounding clearings. However, transpiration enhancement can occur not only at forest edges, but also
well within the patch for trees whose canopies are exposed to advection. The distance-to-edge dependency
of transpiration for well-exposed trees, while suggesting that regional evapotranspiration (ET) is influenced
by the degree of fragmentation, is not conclusively established by our observations. Although the magnitude
and spatial extent of edge effects on transpiration remain uncertain, spatial differences in total evaporation
and dry season soil moisture draw-down add to the
evidence that ET of exposed forest edges is enhanced.
If edges experience higher rates of ET, greater fragmentation would result in higher regional evaporative
flux, i.e. other factors being equal, small patches would
have higher ET rates than large patches. Hence, fragmentation of remaining forested areas would partly
offset the reduction in regional evaporation due to deforestation.
The conclusions drawn from this study are limited
by the relatively small number of trees (and species)
sampled for transpiration, and the high variability of
transpiration among sampled trees. Further, highly
variable exposure due to the rough terrain and diverse
canopy structure obscures the distance-to-edge dependency which may exist. It is likely that the type
of replacement land cover, cultivation practices, fire
frequency, and moisture status of the clearings, i.e.
the degree of contrast of the surroundings or “matrix
harshness” (Gascon et al., 2000), affect this process.
We should also note that although we found greater
differences in evaporative flux during the dry period,
it is possible that under more prolonged or severe dry
conditions, soil moisture storage at the forest edge
would become depleted and leaf area would decline
significantly leading to lower transpiration rates near
the edge than in the interior.
Acknowledgements
This research was facilitated by numerous individuals associated with the East-West Center (EWC),
Honolulu, the Center for Natural Resources and
Environmental Studies (CRES), Vietnam National
University, Hanoi, and Hanoi Agricultural University
(HAU). We especially thank Jeff Fox and Steve Leisz
(EWC), Le Trong Cuc (CRES), and Tran Duc Vien
(HAU). We are greatly indebted to the kindness and
skill of the Tat Hamlet residents, especially Lan, Lian,
and Mai, who assisted our field work. This paper is
based on work supported by the US National Science
Foundation under Grant No. DEB-9613613.
References
Blad, B.L., Rosenberg, N.J., 1976. Evaluation of resistance and
mass transport evapotranspiration models requiring canopy
temperature data. Agron. J. 68, 764–769.
Brenner, A.J., Jarvis, P.G., 1995. A heated leaf replica technique
for determination of leaf boundary layer conductance in the
field. Agric. For. Meteorol. 72, 261–275.
Bruijnzeel, L.A., 1990. Hydrology of moist tropical forests and
effects of conversion: a state of knowledge review. UNESCO,
Paris and Vrije Universiteit, Amsterdam.
Bruijnzeel, L.A., 2001. Forest hydrology. In: J.C. Evans (Ed.), The
Forests Handbook. Blackwell Scientific Publications, Oxford,
UK (Chapter 12).
Chen, J., Franklin, J.F., Spies, T.A., 1993. Contrasting microclimates among clearcut, edge, and interior of old-growth
Douglas-fir forest. Agric. For. Meteorol. 63, 219–237.
Choudhury, B.J., Reginato, R.J., Idso, S.B., 1986. An analysis of
infrared temperature observations over wheat and calculation
of latent heat flux. Agric. For. Meteorol. 37, 75–88.
Clearwater, M.J., Meinzer, F.C., Andrade, J.L., Goldstein, G.,
Holbrook, N.M., 1999. Potential errors in measurement of
nonuniform sap flow using heat dissipation probes. Tree Physiol.
19, 681–687.
Famiglietti, J.S., Wood, E.F., 1994. Multiscale modeling of
spatially variable water and energy balance processes. Water
Resour. Res. 30, 3061–3078.
Famiglietti, J.S., Wood, E.F., 1995. Effects of spatial variability
and scale on areally averaged evapotranspiration. Water Resour.
Res. 31, 699–712.
Gascon, C., Williamson, G.B., da Fonseca, G.A.B., 2000. Receding
forest edges and vanishing reserves. Science 288, 1356–1358.
Gash, J.H.C., 1986. A note on estimating the effect of a limited
fetch on micrometeorological evaporation measurements.
Boundary-Layer Meteorol. 35, 409–413.
Giambelluca, T.W., Hölscher, D., Bastos, T.X., Frazão, R.R.,
Nullet, M.A., Ziegler, A.D., 1997. Observations of albedo
and radiation balance over post-forest land surfaces in eastern
Amazon Basin. J. Climate 10, 919–928.
Giambelluca, T.W., Fox, J., Yarnasarn, S., Onibutr, P., Nullet, M.A.,
1999. Dry-season radiation balance of land covers replacing
forest in northern Thailand. Agric. For. Meteorol. 95, 53–65.
Granier, A., 1985. Une novuvelle méthode pour la mesure du flux
de sève brute dans le tronc des arbres. Ann. Sci. For. 42, 193–
200.
T.W. Giambelluca et al. / Agricultural and Forest Meteorology 117 (2003) 1–22
Granier, A., 1987. Evaluation of transpiration in a Douglas fir stand
by means of sap flow measurements. Tree Physiol. 3, 309–320.
Granier, A., Huc, R., Barigah, S.T., 1996. Transpiration of natural
rain forest and its dependence on climatic factors. Agric. For.
Meteorol. 78, 19–29.
Hahmann, A.N., Dickinson, R.E., 1997. RCCM2 BATS model over
tropical South America: applications to tropical deforestation.
J. Climate 10, 1944–1964.
Hatfield, J.L., Reginato, R.J., Idso, S.B., 1984. Evaluation of
canopy temperature–evapotranspiration models over various
crops. Agric. For. Meteorol. 32, 41–53.
Henderson-Sellers, A., Gornitz, V., 1984. Possible climatic impacts
of land cover transformations, with particular emphasis on
tropical deforestation. Climatic Change 6, 231–257.
Henderson-Sellers, A., Dickinson, R.E., Durbridge, T.B., Kennedy,
P.J., McGuffie, K., Pitman, A.J., 1993. Tropical deforestation:
modeling local- to regional-scale climate change. J. Geophys.
Res. 98, 7289–7315.
Hutjes, R.W.A., 1996. Transformation of near surface meteorology
in a landscape with small scale forests and arable land. Ph.D.
Dissertation, University of Groningen, The Netherlands.
James, S.A., Clearwater, M.J., Meinzer, F.C., Goldstein, G., 2002.
Heat dissipation sensors of variable length for the measurement
of sap flow in trees with deep sapwood. Tree Physiol. 22, 277–
283.
Jipp, P.H., Nepstad, D.C., Cassel, D.K., Reis de Carvalho, C.,
1998. Deep soil moisture storage and transpiration in forests
and pastures of seasonally-dry Amazonia. Climatic Change 39,
395–412.
Kapos, V., 1989. Effects of isolation on the water status of forest
patches in the Brazilian Amazon. J. Tropical Ecol. 5, 173–185.
Kapos, V., Wandelli, E., Camargo, J.L., Ganade, G., 1997. Edgerelated changes in environment and plant responses due to
forest fragmentation in central Amazonia. In: Laurance, W.F.,
Bierregaard, R.O. Jr. (Eds.), Tropical Forest Remnants: Ecology,
Management, and Conservation of Fragmented Communities.
University of Chicago Press, Chicago, USA, pp. 33–44.
Kelliher, F.M., Lloyd, J., Arneth, A., Byers, J.N., McSeveny,
T.M., Milukova, I., Grigoriev, S., Panfyorov, M., Sogatchev,
A., Varlargin, A., Ziegler, W., Bauer, G., Schulze, E.-D., 1998.
Evaporation from a central Siberian pine forest. J. Hydrol. 205,
279–296.
Kienitz, G., Milly, P.C.D., Van Genuchten, M. Th., Rosbjerg,
D., Shuttleworth, W.J. (Eds.), 1991. Hydrological Interactions
Between Atmosphere, Soil and Vegetation. International
Association of Hydrological Sciences Publication No. 204.
IAHS Press, Wallingford, UK.
Klaassen, W., 1992. Average fluxes from heterogeneous vegetated
regions. Boundary-Layer Meteorol. 58, 329–354.
Klaassen, W., Lankreijer, H.J.M., Veen, A.W.L., 1996. Rainfall
interception near a forest edge. J. Hydrol. 185, 349–361.
Kruijt, B., Klaassen, W., Hutjes, R.W.A., Veen, A.W.L., 1991.
Heat and momentum fluxes near a forest edge. In: Kienitz, G.,
et al. (Eds.), Hydrological Interactions Between Atmosphere,
Soil and Vegetation. International Association of Hydrological
Sciences Publication No. 204. IAHS Press, Wallingford, UK,
pp. 107–116.
21
Laurance, W.F., Bierregaard, R.O. Jr., 1997. A crisis in the making.
Preface to Laurance, W.F., Bierregaard, R.O. Jr. (Eds.), Tropical
Forest Remnants: Ecology, Management, and Conservation
of Fragmented Communities. University of Chicago Press,
Chicago, USA.
Laurance, W.F., Ferreira, L.V., Rankin-de Merona, J.M., Laurance,
S.G., 1998. Rain forest fragmentation and the dynamics of
Amazonian tree communities. Ecology 79, 2032–2040.
Lean, J., Warrilow, D.A., 1989. Simulation of the regional climatic
impact of Amazon deforestation. Nature 342, 411–413.
Liang, X., Lettenmaier, D.P., Wood, E.F., Burges, S.J., 1994. A
simple hydrologically based model of land surface water and
energy fluxes for general circulation models. J. Geophys. Res.
99, 14,415–14,428.
Matlack, G.R., 1993. Microenvironment variation within and
among forest edge sites in the eastern United States. Biol.
Conserv. 66, 185–194.
McGuffie, K., Henderson-Sellers, A., Zhang, H., Durbridge, T.B.,
Pitman, A.J., 1995. Global sensitivity to tropical deforestation.
Global Planet. Change 10, 97–128.
Meinzer, F.C., Goldstein, G., Andrade, J.L., 2001. Regulation of
water flux through tropical forest camopy trees: do universal
rules apply? Tree Physiol. 21, 19–26.
Monteith, J.L., 1973. Principles of Environmental Physics. Elsevier,
New York.
Murcia, C., 1995. Edge effects in fragmented forests: implications
for conservation. TREE 10, 58–62.
Neal, C., Robson, A.J., Bhardwaj, C.L., Conway, T., Jeffery,
H.A., Neal, M., Ryland, G.P., Smith, C.J., Walls, J., 1993.
Relationships between precipitation, stemflow and throughfall
for a lowland beech plantation, Black Wood, Hampshire,
southern England: findings on interception at a forest edge and
the effects of storm damage. J. Hydrol. 146, 221–233.
Nobre, C.A., Sellers, P.J., Shukla, J., 1991. Amazonian deforestation and regional climate change. J. Climate 4, 957–988.
Polcher, J., Laval, K., 1994. The impact of African and Amazonian
deforestation on tropical climate. J. Hydrol. 155, 389–405.
Schaeffer, S.M., Williams, D.G., Goodrich, D.C., 2000.
Transpiration of cottonwood/willow forest estimated from sap
flux. Agric. For. Meteorol. 105, 257–270.
Shukla, J., Nobre, C., Sellers, P.J., 1990. Amazon deforestation
and climatic change. Science 247, 1322–1325.
Stewart, J.B., Engman, E.T., Feddes, R.A., Kerr, Y. (Eds.),
1996. Scaling up in Hydrology Using Remote Sensing. Wiley,
Chichester, UK.
Turton, S.M., Freiburger, H.J., 1997. Edge and aspect effects
on the microclimate of a small tropical forest remnant on
the Atherton Tableland, northeastern Australia. In: Laurance,
W.F., Bierregaard, R.O. Jr. (Eds.), Tropical Forest Remnants:
Ecology, Management, and Conservation of Fragmented
Communities. University of Chicago Press, Chicago, USA,
pp. 45–54.
Veen, A.W.L., Hutjes, R.W.A., Klaassen, W., Kruijt, B., Lankreijer,
H.J.M., 1991. Evaporative conditions across a grass-forest
boundary: a comment on the strategy for regionalizing
evaporation. In Kienitz, G., et al. (Eds.), Hydrological
Interactions Between Atmosphere, Soil and Vegetation.
22
T.W. Giambelluca et al. / Agricultural and Forest Meteorology 117 (2003) 1–22
International Association of Hydrological Sciences Publication
No. 204. IAHS Press, Wallingford, UK.
Veen, A.W.L., Klaassen, W., Kruijt, B., Hutjes, R.W.A., 1996.
Forest edges and the soil-vegetation-atmosphere interaction at
the landscape scale: the state of affairs. Prog. Phys. Geogr. 20,
292–310.
Whitmore, T.C., 1997. Tropical forest disturbance, disappearance,
and species loss. In: Laurance, W.F., Bierregaard, R.O. Jr.
(Eds.), Tropical Forest Remnants: Ecology, Management,
and Conservation of Fragmented Communities. University of
Chicago Press, Chicago, USA.
Willschleger, S.D., Hanson, P.J., Todd, D.E., 2001. Transpiration
from a multi-species deciduous forest as estimated by xylem
sap flow techniques. For. Ecol. Manage. 143, 205–213.
Wright, I.R., Gash, J.H.C., Da Rocha, H.R., Shuttleworth,
W.J., Nobre, C.A., Maitelli, G.T., Zamparoni, C.A.G.P.,
Carvalho, P.R.A., 1992. Dry season micrometeorology of central
Amazonian ranchland. Q. J. R. Meteorol. Soc. 188, 1083–1099.
Xue, Y., Bastable, H.G., Dirmeyer, P.A., Seller, P.J., 1996.
Sensitivity of simulated surface fluxes to changes in land surface
parameterizations—a study using ABRACOS data. J. Appl.
Meteorol. 35, 386–400.