DSpace at VNU: Impacts of Rising Food Prices on Poverty and Welfare in Vietnam
Bạn đang xem bản rút gọn của tài liệu. Xem và tải ngay bản đầy đủ của tài liệu tại đây (1.29 MB, 15 trang )
Western Agricultural Economics Association
Impacts of Rising Food Prices on Poverty and Welfare in Vietnam
Author(s): Linh Vu and Paul Glewwe
Source: Journal of Agricultural and Resource Economics, Vol. 36, No. 1 (April 2011), pp. 14-27
Published by: Western Agricultural Economics Association
Stable URL: />Accessed: 19-08-2015 20:28 UTC
Your use of the JSTOR archive indicates your acceptance of the Terms & Conditions of Use, available at />info/about/policies/terms.jsp
JSTOR is a not-for-profit service that helps scholars, researchers, and students discover, use, and build upon a wide range of content
in a trusted digital archive. We use information technology and tools to increase productivity and facilitate new forms of scholarship.
For more information about JSTOR, please contact
Western Agricultural Economics Association is collaborating with JSTOR to digitize, preserve and extend access to Journal of
Agricultural and Resource Economics.
This content downloaded from 130.237.165.40 on Wed, 19 Aug 2015 20:28:41 UTC
All use subject to JSTOR Terms and Conditions
Journal
and Resource
of Agricultural
2011 Western Agricultural
Copyright
Economics
of Rising Food Prices on
and Welfare in Vietnam
Impacts
Poverty
Linh
In 2007
and 2008,
36(1): 14-27
Association
Economics
international
Vu and Paul
prices
fears that poor households
in developing
often
of these
that many
ignored
examines
overall,
higher
the impact
higher
food
increase
purchasers)
food prices
prices
because
was
of rising
made
most
the average
smaller
of rice and other grains
countries
poor
households
than the average
were
Vietnamese
worse
loss
food
Our
of those
This
results
welfare.
welfare
whose
welfare
whose
raising
Yet, these fears
producers.
off. Average
gain
increased,
poorer.
household's
of households
welfare
sharply
become
in Vietnam.
on welfare
the average
welfare
would
households
food prices
raised
Glewwe
was
show
that,
However,
found
declined
welfare
study
to
(net
increased
(net sellers).
Key
Words:
food prices,
poverty,
rice prices,
Vietnam,
welfare
Introduction
In 2008, world food prices rose sharply; the Food and Agriculture Organization (FAO) food
price index increased by 24% and the cereal price index increased by 43%. At their peak in
the middle of 2008, international prices of wheat and maize were three times higher than in
early 2003, and the price of rice was five times higher (von Braun, 2008). This raised fears
that the poor in the developing world could fall deeper into poverty and experience increased
malnutrition. These fears often overlooked the fact that most poor households in developing
countries are in rural areas and are producers, not just consumers, of food. Thus, the impact of
rising food prices on poor households in developing countries depends on those households'
characteristics and will vary both across countries and across households within each country.
Although food prices fell somewhat since their peak in 2008, food prices in early 2011 are
rising and are close to the peak levels of 2008, so there is still an urgent need to assess the
impacts of rising food prices on poor, and nonpoor, households in developing countries.
This paper focuses on Vietnam, a poor developing country with a per capita GDP of only
$1,051 in 2008. Food prices in Vietnam increased by 18.9% in 2007, and by 32.7% from
January to September of 2008 (Vietnam General Statistics Office, 2008b, 2009). Higher food
prices may have very large effects on household welfare in Vietnam, since the average
Vietnamese household spends about half its income on food. Higher food prices almost
always reduce the welfare of urban households because they are net purchasers of food. In
contrast, most rural households produce some food items, so the effect of changing food
prices on their welfare will depend on whether they are net purchasers or net sellers of food.
Linh Vu is assistant professor, University of Economics and Business, Vietnam National University, and Vice Director, Indochina
Research and Consulting (IRC), Hanoi, Vietnam. Paul Glewwe is professor, Department of Applied Economics, University of
Minnesota. The authors thank Carrie Turk for helpful input on earlier drafts of this paper. We also thank the editor, Vincent Smith,
and two anonymous referees for advice and comments.
Review coordinated by Vincent H. Smith.
This content downloaded from 130.237.165.40 on Wed, 19 Aug 2015 20:28:41 UTC
All use subject to JSTOR Terms and Conditions
Vu and
Glewwe
Impacts
of Rising
Food
Prices
in Vietnam
15
Of particular interest is the impact of food prices on poverty, which is determined by the
location of net buyers and net sellers of food in the distribution of income.
Several researchers have studied the impact of higher food prices on poverty and house
countries. Deaton (1989) used nonparametric methods to examine
the impact of a hypothetical change in rice prices on Thailand's income distribution and
hold welfare in low-income
found that higher rice prices benefit all rural households, but especially middle-income house
holds. Ravallion and van der Walle (1991) report that a 10% increase in food prices raised the
rate of poverty in Indonesia. Also using nonparametric techniques, Barrett and Dorosh (1996),
observed negative impacts of higher rice prices on the welfare of the rural poor in Madagascar
because the gains to net rice sellers were concentrated among higher income rice farmers.
Ivanic and Martin (2008) examined nine low-income countries and concluded that increased
staple food prices would increase poverty in most, but not all, of those countries.
Two recent studies have assessed the effect of food prices on household welfare and poverty
in Vietnam. Using data from the 1992-93 Vietnamese Living Standards Survey, Minot and
Goletti (2000) estimated that a 10% rise in rice prices would increase the average household's
real income, since most Vietnamese households cultivate rice. However, they also note that
these higher rice prices would slightly increase the rate of poverty. Ivanic and Martin (2008)
examined household surveys conducted in 1998 and 2004, and found that increased commodity
prices in Vietnam, particularly rice prices, would have reduced poverty in both 1998 and
2004.
This paper extends these two earlier studies in several ways. First, Minot and Goletti studied
only rice and used out-of-date food consumption patterns from the early 1990s, while we
study the impacts of both rice prices and overall food prices, using data from 2006. Second,
Ivanic and Martin used international food prices to simulate welfare changes in Vietnam, but
the impacts of global food price changes may vary across countries due to variation in trans
port costs, domestic policies,
and market structures. Here, we employ domestic, rather than
international, prices. Moreover, our approach allows consumer and producer prices to rise at
different rates, while Ivanic and Martin assumed that these prices rise at the same rate.
Methods
and Data
It is useful to distinguish between food consumption and food purchases, as well as between
food production and food sales. In developing countries, many farm households consume
only a portion of the food they produce and sell the rest, and they often purchase food items
to supplement consumption from their own production. Consequently, there are sizeable
differences between their food production and food sales, and between their food consumption
and food purchases. This is especially true for rice, which is both produced and consumed by
most rural households
in Vietnam. To understand the impact of higher food prices on poverty
and welfare, one must focus on households' food sales and food purchases, rather than their
food production and consumption. More specifically, the most important variable for assessing
changes in household welfare is a household's net food sales, defined as (gross) food sales
minus food purchases.
To assess the impact of changes in food prices on household welfare, this paper uses a
methodology introduced by Deaton (1989). The impact of price changes on household welfare
is measured by the compensating variation—the amount of money required to keep a house
utility at the utility level it enjoyed before the change in prices. A household profit
function can be used to represent the household's production activities, and an indirect utility
hold's
This content downloaded from 130.237.165.40 on Wed, 19 Aug 2015 20:28:41 UTC
All use subject to JSTOR Terms and Conditions
April 2011
16
Journal
of Agricultural
and Resource
Economics
function can be used to measure its level of welfare. When food prices increase, the (implicit)
profits increase for all households that produce food. However, each household must also
increase its food expenditure to maintain its previous utility. The change in any household's
welfare due to an increase in food prices is calculated as the increase in the household's
profits minus the increase in food expenditure needed to maintain its previous utility. We
consider three distinct impacts of food price changes on household welfare. The first is the
immediate impact, before any changes in consumption or production patterns. The second is
the short-run impact, which allows for changes in consumption, such as switching away from
food items for which prices have increased. The third is the long-run impact, which allows for
changes in both consumption and production in response to changing prices.
Following
consider the following indirect household utility function:
Deaton (1989),
Uf,~ <K°>r + b + n; pc),
(1)
where Uh is the utility of household h, which is a function of (full) income and the consumer
prices of all goods pc (a vector). In this expression, co is the wage rate, T is total time (including
leisure time) available to all household members, b is nonlabor income, and ti is the house
hold's profit from its agricultural or nonagricultural household businesses.
Profits (ji) in equation (1) are, by standard microeconomic theory, a function of the prices
of both the inputs used and the outputs produced by the household's production activities. A
standard property of the profit function (Hotelling's lemma) is that small changes in the prices
of the goods produced change profits in proportion to the amount sold:
=
which implies An/
An = y,
yt,
Appi
Appi,
(2)
where ppi is the producer price of good i, and yt is the amount sold by the household. Equation
(2) shows the immediate change in profit for a one-unit change in the price of good i. The
intuition is clear: if the household currently produces y kilograms of rice, then a 1,000
increase in the price of rice raises its profits by y thousand Dong (1,000
Dong equal about 7 U.S. cents).
Next, consider the impact on profits from a change in the consumer price of good i:
Vietnamese
Dong
Vietnamese
(3)
= An
At: / Apc(
/
APpi
x
APpi
/ Apci
=
y,Appi
/ Apci.
The term Appi/Apci denotes the change in the producer price relative to the change in the
consumer price. Many authors (e.g., Deaton, 1989) assume that Appi /Apci equals one, but it
can differ from one (for example, if the government imposes controls on consumer and/or
producer prices).
Let qi be the household's
(gross) purchase of commodity i. Roy's identity implies:
qi = -(A
(4)
The assumption that the household maximizes its utility yields the following first-order
condition, which shows the impact of an increase in the consumer price of good i on household
utility:
AU:
=
A<|> x
—21
An
+
A(j)
—L_
=
A<|>
—
f An
q
^
=
A(|)
——
(yi^PPi~9i^PCi)
i
where the second equality uses (4) and the third uses (3). As implied by equation (5), ifpci
rises, utility is unchanged only if the household has a change in income, denoted by ABj,
This content downloaded from 130.237.165.40 on Wed, 19 Aug 2015 20:28:41 UTC
All use subject to JSTOR Terms and Conditions
Vu and Glewwe
Impacts
of Rising
Food
Prices
in Vietnam
17
sufficient to offset the change in welfare shown to the right of the last equality in (5). Thus,
when the price of good i changes, (5) implies that AB, can be expressed as q,Apci - y,Appi.
Intuitively, the money required to maintain utility is the difference between the change in the
cost of maintaining current consumption and the change in income from current production.
Summing this expression for ABt over all goods yields the change in income needed to
maintain previous utility after a change in the prices of n goods:
(6)
~
=
AS = AC - AY = £
Z [Pci1iAln(pa) Ppiy,Aln(/^)],
(q.APd ~yAPPi)
i=1
/=1
where AC is the change in expenditure and AY is the change in production value due to price
changes for all n food items if no changes are made in consumption and production patterns.
in income (AB)
Finally, the change
as a fraction of household
expenditure
(X) can be
as:
expressed
=
A BIX
(7)
£ [w. A\n(pci)
i—i
-
{ppiyi /X)A\n(Ppi)j,
where w, is the budget share of good i and {ppiyi/X) represents the sale of i as a fraction of
household consumption expenditures. For estimation, wt is the household's budget share of
good i, excluding self-supplied consumption. Equation (7) is similar to a result in Deaton
(1989),
but it is more flexible because
it allows the changes
in the consumer and producer
prices to differ.
Equation (7) measures only the immediate effect of price changes. The income needed to
maintain the household's level of utility after food prices increase is lower if it can substitute
away from goods whose prices have risen the most. A second-order Taylor's expansion of the
expenditure function allows for substitution behavior, yielding the following expression
the change in expenditure needed to maintain utility after a change in prices:
AC = Z
(8)
;=i
q> APa + T Z
z
Z
j=i j=l
for
sij APa APcj ,
where s,j is the Slutsky derivative.1 One can also express (8) using budget shares and log
prices:2
Aln(C)
(9)
=
£
i=1
vv,Aln<>„) + |Z
1
Z
i=l j=1
w,sijA]n(Pci)A[n(Pcj)^
the compensated price elasticity of good i with respect to the price of good j.
from
Thus,
equations (6) and (9), the effect of an increase in prices becomes:
where 8is
(10)
Aln(iT) = X [^A^(Pa)
i=l
|
nZZ1
n
~
(pplyi/X)A\n(Ppi)\
n
1=1 y=l
wi Eij A In (pci) A \n(pcj),
where sr indicates that equation (10) measures the short-run impact. Finally, to assess
impact of a change in the price of a single good i, such as rice, (7) and (10) simplify to:
1
2
The Slutsky derivative is Sy = dq{pc,
b)/dpCi + q(pc,
b) x dq(pc,
b)/db, where q(pc,
the
b) is the Walrasian demand function.
For more detailed derivation of this expression, see Friedman and Levinsohn (2002).
This content downloaded from 130.237.165.40 on Wed, 19 Aug 2015 20:28:41 UTC
All use subject to JSTOR Terms and Conditions
18
Journal
April 2011
(11)
=
Aln(5,)
w) A In(pci)
-
of Agricultural
and Resource
Economics
(ppiyl IX)A\n(ppi)
and
(12)
Aln(5/r)
=
wl A\x\{pci)
-
(ppiy, IX)Mn(ppi)
+ i £
2
M
Aln(pci)Aln(Jp^).
To summarize, equations (7) and (11) show the immediate (direct) impact, while equations
(10) and (12) show short-run (second-order) impacts. Similar procedures have been used by
Friedman and Levinsohn (2002) and Minot and Goletti (2000).
A final issue is that food producers may change their production in response to higher food
prices, e.g., by producing more of food items whose prices rise. Incorporating production
responses yields long-run impacts. Recent studies of rice production in Vietnam have yielded
supply elasticities ranging from 0.10 to 0.34. Khiem and Pingali (1995) found a supply
elasticity of 0.22. The International Food Policy Research Institute (IFPRI, 1996) estimated
elasticities of rice production of 0.29 in the South and 0.37 in the North. Minot and Goletti
(2000) estimated elasticities of 0.31 in the South, 0.38 in the North, and a national average of
0.34. Danh (2007) reported supply elasticities between 0.10 and 0.34.
Our study uses data from the 2006 Vietnam Household Living Standards Survey (VHLSS)
to assess the impact of changing food prices on poverty and household welfare. The VHLSS
is a nationally representative household survey with detailed data on household activities and
characteristics. It includes 9,189 households, of which 75% live in rural areas and 25% reside
in urban areas.3 Seventy-five percent of these households are engaged in farming, and 53%
collects data on household consumption of 55 different food
grow rice. The 2006 VHLSS
items, including two kinds of rice (ordinary and glutinous)4
Food Production
and Consumption
in Vietnam
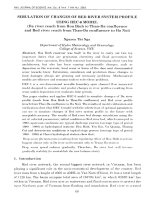
1 shows the extent of farming and rice-farming in Vietnam. About 86% of rural Viet
namese are farmers, and two-thirds grow rice.5 Poorer households are more likely to be
farmers, and to be rice farmers, than better-off households. In the poorest quintile (the poorest
20% of the population), 90% of households are farmers and 76% are rice farmers, while in the
Table
richest quintile (wealthiest 20%), only 40% are farmers and just 18% are rice farmers. Ethnic
minorities, who constitute 15% of Vietnam's population and tend to live in remote rural areas,
are very likely to be engaged in farming; 94% are farmers and 81% are rice farmers.
study of the economics of food consumption and production in Vietnam, Vu
reports that food constitutes 50% of households' real expenditure—about 47% for the non
poor population and 67% for the poor.6 The percentage of household expenditures devoted to
In a 2008
food is largest for the poorest quintile, at 65%, and smallest for the richest quintile, at only
37%. For the population as a whole, food purchases represent 72% of total food consumption,
and self-produced food constitutes the remaining 28%. The poorest households depend least
on purchased food (52%),
while the richest rely on it the most (88%).
3
The full sample for the 2006 VHLSS was about 45,000 households, but only 9,189 of these were asked detailed questions on
consumption expenditures, which are used in this paper to measure household welfare.
4
For furtherinformation on the survey, interested readers are referred to Vietnam General Statistics Office (2008a).
5
Vietnam is divided into eight regions. To conserve space, we do not present results that compare different regions. See Vu
(2008) for detailed comparisons across Vietnam's eight regions.
6
The poverty line is defined as the level of expenditure that supplies a person 2,100 kcal/day plus an allowance for essential
nonfood goods. In 2006, about 15.9% of the Vietnamese population was poor according to this definition.
This content downloaded from 130.237.165.40 on Wed, 19 Aug 2015 20:28:41 UTC
All use subject to JSTOR Terms and Conditions
Vu and
Glewwe
Table
Impacts
1. Distribution
of Farming
and Rice Farming
Percentage
Description
Engaged
All Vietnam
of Rising
of Households
in Farming
Food
Households
52.5
Rural
86.2
66.0
Urban
29.3
12.3
Quintile
1
89.8
75.6
Quintile
2
84.8
69.4
Quintile
3
79.5
59.0
Quintile
4
66.2
41.5
Quintile
5
39.9
17.9
Ethnic Majority
68.0
47.4
Ethnic Minority
94.3
81.1
Nonpoor
68.5
48.1
Poor
90.4
76.7
2006 Vietnam Household
The Impact
19
in Vietnam
in Rice Farming
71.9
Source:
in Vietnam
of Households
Percentage
Engaged
Prices
Living Standards Survey.
of Food Prices on Household
Welfare
and Poverty in Vietnam
Food Prices and Household
Welfare
We consider three hypothetical scenarios to examine the impacts of changing food prices on
household welfare, as measured by real household expenditure, and poverty. Scenario [1]
examines the direct impacts on household welfare and poverty of a hypothetical 20% increase
in the prices of all food products, assuming consumer and producer prices increase at the
same rate. However, the' assumption that consumer and producer prices change uniformly
may be unrealistic, ignoring the complexity of Vietnam's rice market. Indeed, the increase in
producer food prices may be lower than the increase in consumer prices, especially for small
farmers. One reason for this divergence is that Vietnam's rice export market is dominated by
two large state-owned enterprises. While over 200 rice-exporting companies operate in Viet
nam, Vinafood 1 and Vinafood 2 held over 55% of the market share in 2008. Many small
trading companies complain that the Vietnam Food Association (VFA), the semi-government
organization that sets rice-exporting policies (including establishing minimum export prices),
gives preferential treatment to these two corporations. Another explanation is that small
farmers are less able to store their harvest and may need to sell it at lower prices immediately
after harvest.
The average welfare benefit could be much lower if producer prices increase more slowly
than consumer prices. Accordingly, we consider two additional scenarios. Scenario [2] assumes
that producer prices increase faster: consumer prices increase by 20% while producer prices
rise by 24%. Finally, scenario [3] assumes that consumer prices increase by 20% while
producer prices increase by only 16%.7 We also examine the effects of the price increases that
actually occurred in 2007 and 2008, which are of a similar magnitude.
7
See Vu (2008) for analogous hypothetical scenarios with much larger increases (i.e., consumer prices rise by 50% while
producer prices rise by 40%, 50%, or 60%).
This content downloaded from 130.237.165.40 on Wed, 19 Aug 2015 20:28:41 UTC
All use subject to JSTOR Terms and Conditions
20
April 2011
Journal
of Agricultural
and Resource
Economics
Because consumer prices of all food items are assumed to rise at the same rate, there is no
substitution effect in consumer demand. The impacts of all scenarios on household welfare
are reported in table 2. A uniform food price increase of 20% would raise the real annual
expenditure (money metric welfare) of an average household by 3.4%. If producer prices rise
faster than consumer prices, the rise in welfare would be larger. For example, if producer prices
increase by 24% (and consumer prices by 20%), average welfare would increase by 5.6%.
However, if producer prices increase by only 16%, welfare would increase by only 1.3%.
These scenarios have different impacts on urban and rural areas. On average, rural house
holds'
welfare increases while the welfare of urban households
decreases.
For example, in
increase in
scenario [1] (uniform 20% increase), an average rural household enjoys a 6.0%
welfare, while an average urban household suffers a 4.4% reduction in welfare.
On average, middle-income groups gain the most (in percentage terms) from increased
food prices. The average welfare of households in quintiles 2, 3, and 4 rises from 4.1% to
4.6% in scenario [1], In contrast, the richest quintile has almost no gain, and even loses in
scenario [3]. The poorest quintile gains from food price increases, but this gain is smaller (in
percentage terms) than those of the middle-income groups. Similarly, the welfare of both poor
and nonpoor households increases when food prices rise, but the relative increase is slightly
higher for the latter. For example, in scenario [1], the poor's welfare increase (3.4%) is
slightly less than that of the nonpoor (3.6%). The rural nonpoor gain more than the rural poor,
while the urban nonpoor lose more than the urban poor. These results differ from past findings,
which reported that higher food prices in developing countries hurt the rural poor because
most of them are net food buyers (Deaton, 1989; Ravallion, 1990; Ivanic and Martin, 2008).
The results reported by previous studies hold if staples are grown mostly by well-off farmers
and not by poor farmers. However, because rice is grown by many poor farmers in Vietnam,
increased prices benefit both poor and nonpoor households.
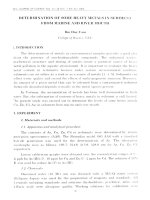
The impacts reported thus far are group averages, but it is also useful to examine within
group variation in welfare changes. These impacts are reported in the second set of columns
in table 2, which show the percentages of households whose welfare declines. These percent
ages are the same for any proportional price change. For example, the results for a 50%
increase in both producer and consumer prices would be the same as the results for scenario
[1], and an increase of 40% in consumer prices and 48% in producer prices would give the
same results as scenario [2], Overall, between 53% and 61% of Vietnamese households would
suffer welfare declines if food prices increase. Nearly 90% of urban households
lower welfare, as would 42% to 51% of rural households.
would have
Grouping households by welfare quintiles, the poorest quintile has the lowest percentage of
households whose welfare falls (37% to 48%), while the wealthiest has the highest (over 80%).
by poverty status, 36% to 47% of poor households would experience lower
welfare, compared to 56% to 64% of nonpoor households.
Almost all nonfarmers (95%) experience lower welfare under all scenarios. The 5% who do
Categorized
not are those engaged in fishing who also sell more food than they purchase. Among farmers,
37% to 48% have lower welfare than before. These are small-scale producers who produce
less food than they consume. For them, the welfare improvement from higher producer prices
does not offset the negative effect of higher consumer prices.
Finally, the impact of rising food prices on poverty is also presented in table 2. A 20%
increase in both consumer and producer food prices would reduce Vietnam's poverty rate by
0.8 percentage points. Rural poverty falls and urban poverty rises in all three scenarios. A uni
form 20% food price increase reduces rural poverty by 1.4 percentage points, but raises urban
poverty by 0.8 percentage points.
This content downloaded from 130.237.165.40 on Wed, 19 Aug 2015 20:28:41 UTC
All use subject to JSTOR Terms and Conditions
Vu and
Glewwe
Impacts
(75 0s
0
O
03 CN
a.
e
c
Q
D
ox <0_
SO
OO OO ON
«/"> ON
ox
CN
CN
vq
O l-H
CN
O
O
Increases
Price
m
irj
©s
Food "o
43
to
3 0
O
V
oN
<+-t O
Due
0
60 U>
03
<
C
a> O
0 43
co
00
in
on
IT) 00
vq
Tf
ON CO 00
CO*
in O
CN
of Rising
Food
in Vietnam
Prices
VO vq On On
vd ON 06 —
1
1
1
1
1
1
in
vd
q
00
|
|
|
vo
vd
in
00
I
1
I
1
I
1
q
in
00
r-4 vd
in
O
vd
vo
q
co'
00
1
1
|
1
1
I
1
1
1
in
CO
q
r-H ON
VO co
1—1 vo I/O OO
t3
,—1 00
oN f ,
co
rt cn
(N L—1 in
ON
vd
00
r
ON
vd
CO
r , CN in
O t—1 vd <0
in
CN
<—# "^t 00
00
O
«n
00
^f ^r
On
00 0
»n 00
0
CN
CN vo
in
ON
vq q
00* 0
CN
00
in
vq
00
O
O
CN
co
CN
vq
ON
CO
1
1
|
1
|
|
|
I
1
I
1
I
1
vo
vd
vq
co
vo
1
1
q
in
1
1
1
1
1
1
1
I
1
1
1
On r~; CN
CN*
0
m r
ON
vq On CN r
vd
r-*
On CO 00 CN
ON CO 00 r~; CN
in* vd CO co CN*
00
CO in CO "tf r
-3; CO CO ON *—J vq CO
,-M ,—3 r-H* •^f r—" CN CN
in vo 00
ON ^t 00 CO
CN
vq
tJ;
r-* CO 00
ON ON*
00
CO in CO
r
Poverty
CO
16%
and
Welfare
Co
0s
0)
00
c
c3 N®
0s
oN 1—'
43
CN
0
U
(N
(N
M-l
13
£
Household
in
CO
*-< ci
CN
in
|
in
r
in
vq
in
vq
00
vq
CO
1
0s 1—1
O
co
CN
q
vd
■^f vq
■"Sf co
1
CN 00
CN* CN*
CO
ON —H in
vd r-" vd
vq
—H
10
vq
T
—, CN
O
q
vd
1
q
cn
1
in
CN in ON 00 vo
—:
CO
f
in
in —
On 0
1
vq
0
in
in
ON
r
vq q
CO* CO
f
CN 00 in
in VO
1
T
in
—
vd
CN
in
I
CN 1-H vq
ON CN* CO
1
1
in
vd
CO
CO
1
1
Change
00
Percentage
Table
•£>
—«
— fa
*
3
fli D
<
_c
*3
a
ts
'B
a
C
'3
a
•§
m
CN CO
_a> ^a>
2.
c
'3
a
_c
'3
a
^J G
1
C H
£
r*
fa
Z
o
Z
o
o
Ph
c
O
2
o
o
a
c
o
Z
This content downloaded from 130.237.165.40 on Wed, 19 Aug 2015 20:28:41 UTC
All use subject to JSTOR Terms and Conditions
o
o
D
c
o
z
§
•e
D
21
22
April 2011
Journal
Table 3. Changes
PANEL
a. Changes
and Resource
in Food Prices and Their Impacts on Food Expenditure,
in Consumer
and Producer
Food
Economics
2007 and 2008
Prices
2007
Consumer
of Agricultural
2008
(Jan.-Sept.)
Prices:
18.9
57.8
Staples
15.4
78.1
Nonstaples
21.2
50.1
6.8
18.1
18.1
56.7
15.9
78.9
Food
of which:
Drinks
Producer
Prices:
Food
of which:
Staples
PANEL
B. Percentage
Increase
in Food/Rice
Due
Expenditure
to Food/Rice
Price
2007
Increases
2007-08
Immediate
Short-Term
Immediate
Short-Term
Price
18.9%
18.9%
57.8%
57.8%
Rice Price
15.4%
15.6%
78.1%
77.5%
Food
Impacts of Food Price and Rice Price Changes
in 2007-2008
has focused on hypothetical increases in food prices. Here, we present
estimates of the impact of food and rice price changes that occurred from January 2007 to
September 2008, using price data from Vietnam's General Statistics Office (2008b, 2009).
This time period is chosen because food prices peaked in Vietnam in the summer of 2008,
The above discussion
until September 2008. The 2008 producer price index is not
so
available,
producer prices are assumed to increase at the same rate as consumer prices in
2008. The price changes are shown in Table 3. The unusually sharp increase in the prices of
and did not start to decline
staples in (the first nine months of) 2008 reflects the fact that rice is by far the most important
staple crop in Vietnam, and that rice prices rose sharply in international commodity markets
starting in late 2007. The export price of Vietnam 5% broken rice almost tripled in one year,
from $303/ton in April 2007 to $875/ton in April 2008. The increase in domestic rice prices
was less dramatic, but still considerable.
The following analysis considers 11 food categories: rice, other staples, pork, poultry, other
meats, fish and seafood, vegetables, fruit, other foods, drinks, and food away from home
(FAFH). Because monthly price indices exist only for staples (mainly rice), nonstaple food
stuffs, and drinks and tobacco, the 11 food items are matched to the available price data as
follows. First, the staples price index is applied to rice and other staples. Second, the non
staples index is used for pork, poultry, other meats, fruit, vegetables, and other foods. Third,
the drink and tobacco index is used for drinks. Finally, the general food price index is used
for FAFH. These price indices are used to calculate the first- and second-order (with and with
out demand adjustment, respectively) effects on household welfare [equations (7) and (10),
respectively].
This content downloaded from 130.237.165.40 on Wed, 19 Aug 2015 20:28:41 UTC
All use subject to JSTOR Terms and Conditions
Vu and
Glewwe
Table
4. Estimated
Impacts
of Rising
Food
Prices
in Vietnam
23
Price Elasticities
Compensated
With Respect to the Price of:
Other
Rice
Staples
-0.72*
0.01*
Pork
Poultry
0.11*
0.02*
Fish
0.03*
0.05*
Drinks
FAFH
0.07*
0.02*
0.06*
0.02*
0.32*
0.13*
0.05*
0.11*
0.01
0.32*
-0.01
0.22*
0.00
-0.68*
0.02
0.03*
0.14*
0.01
0.19*
0.06*
0.04
0.11*
0.01
0.05
-1.01*
0.09*
0.07*
0.16*
0.04*
0.18*
0.05*
0.25*
0.28*
0.15*
0.10*
0.26*
0.10*
0.01
0.04*
0.12*
0.04*
0.21*
-0.94*
0.03*
0.12*
0.06*
0.23*
0.20*
0.08*
0.08
0.07*
0.20*
0.14*
0.19*
0.17*
-0.01
Foods
-0.72*
-0.03
-0.03
Fruits
Vegs.
0.12*
0.26*
0.02
Other
Meats
-0.90*
-0.88*
-0.03*
0.14*
0.00
0.04*
0.08*
0.29*
0.06*
-0.06*
0.13*
0.07*
0.02*
0.14*
0.04*
0.05
0.06*
0.09*
0.11*
0.05*
0.11*
0.02*
0.17*
0.07*
0.05*
0.08*
0.06*
0.05*
0.10*
0.01
0.15*
0.06*
0.06*
0.08*
0.08*
0.06*
0.20*
0.89*
0.10*
0.05
0.15*
0.22*
0.16*
0.03
0.30*
-0.16*
-0.90*
-0.87*
-0.93*
0.07*
-0.52*
0.14*
-1.81*
Source: Vu (2008).
Note: An asterisk (*) denotes statistical significance at the 5% level.
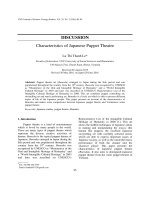
The compensated price elasticities used to calculate the second-order welfare effects are
reported in table 4. Estimation is based on equations (11) and (12), using the compensated
own- and cross-price elasticities estimated by Vu (2008). The demand system was estimated
for the 11 food
using Deaton and Muellbauer's (1980) almost ideal demand system (AIDS)
Nonfood
was
excluded
due
to
lack
of
data
on
nonfood
categories.
expenditure
prices, which
can be justified by assuming that utility is weakly separable in food and nonfood items.
Results
The estimated second-order effects are very small. In all cases, their impact on welfare is less
than 1% of the welfare change induced by the first-order effect. More specifically, table 5
reports the immediate (first-order) and short-term (combined first-order and second-order
effect) impacts of higher food/rice prices on welfare, measured as the money needed (in
percentage terms) to maintain household welfare after food/rice price increases. Our finding
that the second-order effect is negligible differs from results reported by Friedman and
Levinsohn (2002). They found large differences between the immediate and short-term
impacts in Indonesia during the 1997-98 financial crisis. One possible explanation for this
difference is that the food price data used here lack detailed information about how the prices
of different food items changed. In contrast, Friedman and Levinsohn had detailed price data
variation; the substitution effect may be more important if the price
increases of different foods differ substantially. Moreover, this study, unlike that of Friedman
and Levinsohn, does not include nonfood in the demand system; inclusion of nonfood items
with considerable
could also lead to larger second-order effects.
Since differences between the immediate (first-order) and short-term (second-order) effects
are small, we report results only for the former. Table 5 presents changes in welfare over the
2007-2008
period. Average household welfare rose by 2.8% from January 2007 to December
2007, and by 9.2% from January 2007 to September 2008, due to increases in food prices.
This content downloaded from 130.237.165.40 on Wed, 19 Aug 2015 20:28:41 UTC
All use subject to JSTOR Terms and Conditions
24
April 2011
Table
Journal
5. Household
Welfare Changes
Due to Increases
and Resource
of Agricultural
Economics
in Food and Rice Prices, 2007-08
(percent)
Rice Price Change
Food
Description
All
Rural
Price Change
Response
Supply
2007-08
2007
2007-08
2007
2007-08
2.8
9.2
1.0
5.0
1.1
5.8
1.2
7.6
16.7
-12.9
1.6
7.6
-0.6
1.6
-2.8
-0.5
1
3.0
9.9
0.4
1.8
Quintile
2
3.8
12.3
1.5
7.3
1.6
Quintile
3
3.9
12.7
1.9
9.2
2.0
Quintile
4
3.4
11.2
1.1
5.3
1.2
Quintile
4
-0.1
0.1
0.3
1.3
0.3
Nonfarmer
-5.1
-15.3
5.9
Rice
Elast. = 0.34
2007
Quintile
Not Growing
Supply
2007-08
-4.3
Farmer
Elast. = 0.10
2007
5.2
Urban
No Supply
-1.7
18.8
-4.8
-1.3
0.5
-6.5
1.9
-1.2
9.4
-1.5
2.0
-7.7
-1.4
8.6
-2.6
1.7
-0.5
2.5
10.9
-2.2
0.5
4.1
8.3
1.7
10.6
10.3
2.1
12.9
6.0
1.2
7.8
1.7
0.4
2.5
-6.4
-1.2
10.5
-7.7
2.1
-1.4
-6.4
13.0
-7.7
6.9
21.9
3.3
16.5
3.4
17.9
3.5
21.4
Nonpoor
2.7
9.1
1.2
5.7
1.3
6.6
1.3
8.5
Growing
Rice
Poor
3.0
9.9
0.2
0.8
0.3
1.4
0.3
2.8
Rural Nonpoor
5.6
18.0
1.9
9.1
1.9
10.2
2.0
12.7
Rural Poor
3.4
11.0
0.3
1.3
0.4
2.0
0.4
3.4
Urban Nonpoor
-4.4
-13.0
-0.5
-2.7
-0.5
-2.4
-0.4
-2.0
Urban Poor
-3.4
-10.0
-1.5
-7.8
-1.4
-7.5
-1.4
-6.8
Rice prices alone raised average household welfare by 1% in 2007, and by 5% from January
2007 to September 2008. While rural households benefited from these food price increases,
urban households were worse off. Middle-income
groups gained more from food price increases
In rural areas, nonpoor households gained more
than lower and higher income households.
than the poor, while in urban areas, the nonpoor lost more than the poor.
Table 5 also shows how higher rice prices affect welfare when one allows for production
responses from the 53% of Vietnamese households who grow rice. Of course, removing the
implicit constraint of no production response will lead to higher levels of welfare; the goal is
to see how large these impacts are. To study the effect of rice prices alone, assume that other
food prices are unchanged. This permits an investigation that accounts for both the immediate
and short-run effects of changes in rice prices, where the latter allows consumers to substitute
to other foods.
Assuming a lower supply response (elasticity of 0.10), production responses lead to slightly
higher
welfare
increases
for the
country
as
a whole:
a
1.1%
increase
versus
a
1.0%
increase
for the price changes that occurred in 2007, and a 5.8% increase versus a 5.0% increase for
the price increases from January 2007 to September 2008. Assuming a higher price elasticity
response (0.34) results in a slightly larger impact (1.2% compared to 1.0%) for price changes
in 2007, and a modestly higher impact (7.6% compared to 5.0%) for price increases from
January 2007 to September 2008. Overall, allowing for a supply response leads to a some
what more positive impact, but does not change the main results.
This content downloaded from 130.237.165.40 on Wed, 19 Aug 2015 20:28:41 UTC
All use subject to JSTOR Terms and Conditions
Vu and
Glewwe
Table
6. Changes
Impacts
in Poverty Due to Increases
Food
Description
2007
All
-0.6
Rural
-1.2
Urban
Prices
in Vietnam
25
in Food and Rice Prices, 2007-08
Price Change
1.1
Rice
6.8
-4.0
6.4
-12.3
0.6
-25.7
1.1
Urban Poor
0.5
-25.0
1.7
Urban Nonpoor
0.7
-1.1
6.0
-11.9
Rural Poor
0.5
-0.5
-4.0
1.5
Poor
0.3
7.9
1.2
Rural Nonpoor
-0.4
-1.7
-2.3
Nonpoor
-0.2
4.4
-1.5
Rice
2007
-0.1
1.5
Farmer
Rice Price Change
2007-08
0.8
Nonfarmer
Growing
Food
points)
(percentage
Not Growing
of Rising
-4.2
5.2
0.3
-14.8
-5.9
-0.5
2007-08
0.3
-0.1
1.3
2.9
-0.8
4.2
-3.1
3.0
-13.7
3.6
-14.4
1.6
-4.5
Table 6 presents the impacts on poverty from higher food and rice prices. In 2007, food
price increases reduced the poverty rate by 0.6 percentage points, but the sharp price increases
in 2008 led to higher poverty. Hence, the total impact of the food price increases from
January 2007 to September 2008 was to raise the poverty rate by 1.1 percentage points. The
increase in rice prices alone during 2007-08 raised the poverty rate by 0.3 percentage points.
The intuition for higher poverty when food prices increase more sharply is straightforward.
When food prices increase moderately, rural poverty falls significantly and urban poverty
rises moderately; thus, the net effect is to lower the national poverty rate. When food prices
increase
dramatically,
urban
poverty
rises
Summary
sharply,
raising
the national
rate.
and Conclusion
This study demonstrates that the impacts of recent food price increases, especially rice price
increases, on Vietnamese households are complex. About 44% of Vietnamese households are
net food sellers and 30% are net rice sellers. In rural areas, 54% of households are net food
sellers and 38% are net rice sellers. These households will benefit from higher food prices. If
consumer and producer prices increase at the same rate, higher food prices will increase
average household welfare. When food prices increase by 20%, average household welfare
rises by 3.4% and poverty falls by 0.8 percentage points. When only rice prices increase by
20%, average welfare increases by 1.3% and the poverty rate falls by 0.2 percentage points.
However, all of these impacts are sensitive to differences between the changes in producer and
consumer prices. If consumer prices increase less than producer prices, welfare benefits are
higher and the reduction in poverty is greater, but if consumer prices rise faster than producer
prices, the positive impacts of higher prices on welfare and poverty reduction are smaller.
average household welfare
Examining the actual price changes that occurred in 2007-2008,
increased by 9.2% from January 2007 to September 2008, but poverty increased by 1.1
This content downloaded from 130.237.165.40 on Wed, 19 Aug 2015 20:28:41 UTC
All use subject to JSTOR Terms and Conditions
26
April 2011
Journal
of Agricultural
and Resource
Economics
percentage points during the same period. Similarly, increases in rice prices alone raised
but also raised poverty by 0.3 percentage
average household welfare by 5% in 2007-2008,
points.
Finally, it is important to note that benefits and costs are not spread evenly across the popu
lation. A uniform increase in both consumer and producer food prices would make 56% of
households worse off, and a uniform increase in the price of rice would make 64% of house
holds worse off. In particular, increases in rice prices alone lead to welfare reductions for
most households; a uniform increase in the price of rice would reduce the welfare of about
54% of rural households and 92% of urban households.
Examining Vietnam's eight regions, Vu (2008) shows that the South East and Central High
lands would be impacted the hardest, with 80%-90% of those regions' populations experiencing
lower welfare. Overall, in rural areas, middle-income households gain the most while the
poorest households gain the least from higher rice prices. In urban areas, the poorest house
holds lose the most (in percentage terms) from an increase in rice prices. This finding suggests
that support programs should target the poorest quintile, especially the poor in the regions hit
hardest by higher prices, such as the South East and the Central Highlands. Although the
Mekong River Delta (which produces about 90% of Vietnam's marketable rice) gains much
from higher rice prices, Vu concludes that only about one-third of the households in this region
are made better off. This indicates some kind of assistance to the poor is needed even in those
regions that, on average, gain much due to higher food prices.
While this paper has provided substantial insights into the impact of increased food prices
on household welfare and poverty in Vietnam, there are two directions in which future research
on this topic could extend the analysis presented here. First, data limitations do not allow us
to fully explore the relationship between consumer and producer prices in different regions.
Based on our analysis, the welfare and poverty effects are sensitive to differences in increases
across consumer and producer prices, and the effects are more beneficial if producer prices
rise faster than consumer prices. Yet, producer prices of food are often unavailable or updated
less often than food consumer prices.8 Future research should use more sophisticated analysis,
based on reliable and up-to-date regional consumer and producer price data. Second, more
detailed price data would allow more scope for substitution effects between various food
commodities, and between food and nonfood commodities, which could lead to short-run
welfare effects that are substantially higher than the immediate effects.
[Received December
2009; final revision received January 2011.]
8
The Vietnam General Statistics Office publishes an annual producer price index (PPI), while the consumer price index (CPI) is
published monthly. The available PPI and CPI data do not have indices for specific food items, such as rice, maize, and pork. On
the other hand, the Ministry of Agriculture and Rural Development publishes the local market price for several food items, but does
not publish the producer (farm-gate) prices of those items.
This content downloaded from 130.237.165.40 on Wed, 19 Aug 2015 20:28:41 UTC
All use subject to JSTOR Terms and Conditions
Vu and
Glewwe
Food
of Rising
Impacts
Prices
in Vietnam
27
References
C., and
Barrett,
Danh,
P. Dorosh.
in Madagascar."
Rice
V. T. "The
for ASEAN
[Conference
International
Final
Food
and
M.,
Countries."
W.
"An Almost
"The
Martin.
M.
Ravallion,
Evidence
Policy
Discus.
Economy."
A Non-Parametric
of Indonesia's
Impacts
Econ.
Rev.
Rice
(IFPRI).
Rev.
Research,
Market
Research
and
Monitoring
Food
Prices
for Poverty
of Agriculture
of Food
Price
"The
Impact
and Food
and Poverty
Food
and
Industry,
Xuan.
Manila:
Res.
No.
Rep.
114, Inter
2000.
DC,
Under
Changes
Induced
Wage
Responses:
Theory
and
42(1990):574-585.
on Poverty
of Food
Pricing
Reforms:
A Welfare
Analysis
Result
of the Survey
on Household
Living
Standards
2006.
Hanoi,
Vietnam:
Policy
Rep.
2008a.
Hanoi,
Vietnam:
Statistical
Publishing
House,
2008b.
Hanoi,
Vietnam:
Statistical
Publishing
House,
2009.
Crises:
Implications
and Financial
Policy
In Vietnam
International
1995.
in Viet Nam."
2008.
Research
on the Economics
Econ.,
Study.
in Low-Income
in Vietnam."
Crops
V.-T.
2007.
of Appl.
Options
13,2(1991):281—299.
Modeling
Office.
Papers
and Three
G. L. Denning
Liberalization
Oxford Econ.
House,
of Rice
eds.,
Yearbook
Vu, L. H. "Essays
J. 99
on Households:
Policy
Yearbook
Food
Economic
Crisis
. Statistical
20, International
52, Centre
16(2002):397^123.
Market
Global
Institute, Washington,
Changes
Statistics
J. "Food
from
70(1980):312—326.
Financial
. Statistical
von Braun,
No.
Paper
Analysis."
Econ.
System."^4mer
of Higher
and the Ministry
J. Policy
Publishing
Demand
Response
"Supply
"Rice
"Welfare
General
Statistical
Evidence
Nonparametric
1996.
"Implications
for Bangladesh."
for Indonesia."
Ideal
Institute
DC,
M., and D. van der Walle.
Ravallion,
in Thailand:
World Bank
in Rice
Institute
Food
Prices:
39(2008):405-^H6.
N., and F. Goletti.
national
Rice
2007.
Distributional
Research
Washington,
A Partnership
Research
Vietnamese
Netherlands,
Distribution
Methodology."
Policy
Food
Changing
1—37.
(1989):
Agr. Econ.
IRR1:
Rice
Dept.
and Income
N. T., and P. L. Pingali.
Khiem,
Vietnam
of Antwerp,
Prices
report, IFPRI,
Ivanic,
Minot,
in Stimulating
Volume]
Response'
and
78,3(1996):656-669.
of Prices
J., and J. Levinsohn.
A 'Rapid
Welfare
University
A., and J. Muellbauer.
Deaton,
Friedman,
and
Role
Studies,
A. "Rice
Deaton,
"Farmers'
Amer. J. Agr. Econ.
University
Institute,
of Food
for Agriculture
Washington,
Consumption
of Minnesota,
DC,
and the Poor."
Food
No.
2008.
and Production
in Vietnam."
Unpub.
2008.
This content downloaded from 130.237.165.40 on Wed, 19 Aug 2015 20:28:41 UTC
All use subject to JSTOR Terms and Conditions
Ph.D.
diss.,