DSpace at VNU: GA-SVM: A genetic algorithm for improving gene regulatory activity prediction
Bạn đang xem bản rút gọn của tài liệu. Xem và tải ngay bản đầy đủ của tài liệu tại đây (312.83 KB, 4 trang )
GA SVM: A genetic algorithm for improving
gene regulatory activity prediction
‡
§
¶
Dong Do Duc∗ , Tri-Thanh Le† , Trung-Nghia
, Vu , Huy Q. Dinh , Hoang Xuan Huan
∗ Institute
of Information Technology, Vietnam National University, Hanoi, 144 Xuan Thuy, Hanoi, Vietnam
of Information Technology, Vietnam Maritime University, Hai Phong, Vietnam
‡ Department of Mathematics and Computer Science, University of Antwerp, Antwerp, Belgium
§ Center for Integrative Bioinformatics, Max F. Perutz Laboratories, Vienna, Dr Bohrgasse 9, 1030 Vienna, Austria
and Gregor Mendel of Molecular Plant Biology, Vienna, Austrian Academy of Sciences, Dr Bohrgasse 3, 1030 Vienna, Austria
¶ University of Technology (UET), Vietnam National University, Hanoi, 144 Xuan Thuy, Hanoi
Email: {dongdoduc, huanhx}@vnu.edu.vn, , ,
† Department
Abstract—Gene regulatory activity prediction problem is one of
the important steps to understand the significant factors for gene
regulation in biology. The advents of recent sequencing technologies allow us to deal with this task efficiently. Amongst these,
Support Vector Machine (SVM) has been applied successfully
up to more than 80% accuracy in the case of predicting gene
regulatory activity in Drosophila embryonic development. In this
paper, we introduce a metaheuristic based on genetic algorithm
(GA) to select the best parameters for regulatory prediction from
transcriptional factor binding profiles. Our approach helps to
improve more than 10% accuracy compared to the traditional
grid search. The improvements are also significantly supported
by biological experimental data. Thus, the proposed method
helps boosting not only the prediction performance but also the
potentially biological insights.
I. I NTRODUCTION & R ELATED W ORKS
Since its double helix structure was discovered in 1953,
the DNA (Deoxylribo Nucleic Acid) sequence simply consisting of four letters (Adenine, Cytosine, Guanine, Thymine)
has been considered as the natural blueprint of organism
development. Genome itself contains a variety of information
encoded in a long sequence of DNA letters. For example, an
interesting information is the gene-regulatory that shapes the
different gene expression patterns. Enhancer, or cis-regulatory
module (CRM) is the DNA fragment consisting of the information to regulate the associated genes. It contains the
binding sites for the specific transcriptional factors (TFs)
protein corresponding to a certain regulatory activity. So that,
understanding the CRM activity and its requirement is a
fundamental problem in biology [1]. Authors in [2] proposed
a simple model of the CRM activity which depends on the
respective TF bindings, i.e either the elimination of TF or the
disruption of its binding leads to the changes of the CRM
function. This model has been supported by several smallscale evidences by ChIP (Chromatin Immunoprecipitation)
experiments after Polymerase Chain Reaction amplification.
Recently, one of the first genome-wide scale experiments
[3] was successfully done by using microarray technologies
in the model organism, Drosophila melonagaster. This work
used ChIP on the tiling microarray to obtain the first highresolution atlas of mesodermal cis-regulatory modules. The
data provided a strong experimental proof for the model
mentioned above. In addition, they used transcriptional factor
binding profiles measured by ChIP signals [4] to predict the
expression patterns of genes which are regulated by those
respective enhancers. Interestingly, the prediction performance
was quite well; and more importantly, they predicted some
novel enhancers with highly accurate expression categories.
Thus, learning regulatory code that derives different expression
patterns by computational methods is a very attractive branch
in computational biology [1].
To predict the expression patterns of genes, the authors
[3] applied a traditional grid search for the parameter optimization of radial kernel Support Vector Machine (SVM,
[5]) and gained up to 82% accuracy under the leave-oneout cross validation (LOOCV) framework. Cost C and γ are
two parameters of radial kernel SVM. The former determines
the trade-off between the minimization of fitting error and
the maximization of classification margin whereas the later
affects the efficiency of the kernel function especially for
high-dimensional data. Parameter optimization plays an important role in the prediction performance of SVM, especially
when using radial kernel [6]. Metaheuristic approaches (e.g
Genetic Algorithm and Ant Colony Optimization) have been
successfully applied to optimize the SVM parameters ([6],
[7]) in different context problems.The grid search used by the
authors in [3] was a quick method that helps to approximate
the efficient parameters for SVM prediction. However, this
method only explored a sparse amount of parameter space.
As a consequence, three out of five test cases achieved only
70% of accuracy on average and just one case reached more
than 80%. Especially, those three cases were the situation that
the expression pattern of one uniquely corresponds to one
enhancer activity. Thus, it is necessary to have more intensive
methods to further seek the best parameters, particularly for
the very strict datasets that the available information might be
not enough for the standard prediction.
978-1-4673-0309-5/12/$31.00 ©2012 IEEE
We introduce a genetic algorithm approach to improve the
performance of enhancer activity prediction. Making use of
GA, the method search more intensively on the parameter
space than the traditional grid search did, to explore better
parameter for the prediction. Consequently, the proposed approach outperforms the previous method [3] and obtains more
than 80% LOOCV accuracy on average for all the cases. More
important, our results are significantly better in the case of
predicting the regulatory activity for novel enhancers with in
vivo validated data. Our study proved the need of parameter
choosing and optimization in the SVM prediction with the
specific biological dataset.
II. BIOLOGICAL DATA AND PREDICTION PROBLEM
A. Transcriptional binding
Drosophila development
landscapes
in
embryonic
Drosophila is a model organism for embryonic development
research in biology because of the well-established timecourse experiments for several important transcriptional factors
like Twist or Tinman [3]. It is also well-known for the very
early time point of the cell development that only DNA
information might be existed. It allows us to investigate the
importance of DNA information (e.g DNA motif) with respect
to the developmental regulation of the cell. ChIP is a method to
selectively enrich for DNA sequences bound by a particular
protein. Recently, this technology was used to identify the
active CRMs systematically by either tiling microarray (ChIPchip) or deep sequencing(ChIP-Seq) at whole-genome scale.
Using ChIP-chip, [3] used a tiling array to obtain the data of
transcriptional factor binding for five important mesodermal
factors: Twist, Tinman, Mef2, Bagpipe, and Biniou at 5 crucial
time points during embryogenesis (Fig 1).
As sequence, each CRM is assigned with one expression
category (mesoderm, somatic muscle, or visceral muscle; (Fig
1) referred as meso, sm, vm from here on in the paper) by using
the well-known database (e.g REDFly database [8]) consisting
of 310 CRMs. In this dataset, there are a number of CRMs
belonging to ambiguous expression categories, i.e the patterns
are determined at both meso and sm (called meso sm), or both
vm and sm (called vm sm). In addition, they also identified in
vivo the expression category for 35 de novo CRMs which are
unknown from the REDFly database. Using transgenic reporter
assay experiments, they also could determine the expression
pattern for those novel CRMs. It is very important that one can
test the performance of the prediction approach by predicting
those novel CRMs’ activities using the known REDfly CRMs
in training process.
B. Spatio-temporal cis-regulatory activity prediction in machine learning context
Researchers in [3] applied Support Vector Machine to
establish a prediction framework of transcriptional regulatory
activity, i.e expression category, from the binding profiles of
the corresponding transcriptional factor. The prediction was
helpful to indicate the potential of determining the specific
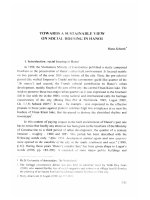
Fig. 1. Regulatory activity prediction based on the transcriptional binding
measured by ChIP-chip heights. The peak height indicates the ChIP binding
of the respective TF at specific time point. In this figure, Twist (Twi), Tin are
at early time point (5-7h, 8-9h,10-11h), Bin is at late time point (10-11h, 1213h,13-15h). Whereas Bap is only at 10-11h and Mef2 is at all time points.
The binding profile is then used to predict the group of the enhancer activity.
Three groups are mesoderm, somatic muscle, visceral muscle on the right
side. A part of the figure is from [1]
transcriptional factors and their degrees that influence the expression patterns it regulated. In the machine learning context,
each CRM was represented by an object data of maximal 15
features which were the combination of transcriptional factors
and time points. The SVM method was applied to predict the
expression pattern of each CRM. In details, the binary SVM
was used to predict the group of an enhancer corresponding
expression of 5 transcriptional binding factors at 5 embryonic
development time points. The groups were mesoderm/somatic
muscle/visceral muscle (meso, SM, VM). The combinations,
Meso+SM and VM+SM, were also considered because of the
natural observation from the expression data.
III. METHODS
A. SVM prediction of regulatory activity based on transcriptional factor binding profiles
A SVM constructs an N-dimensional hyperplane that optimally discriminates the data into two categories. Given an individual enhancer and its corresponding binding profiles from
ChIP-chip data, the binary SVM prediction is used to predict
its transcriptional category. A SVM model is built to learn how
to classify the enhancer x into two classes, e.g mesodermal
or notmesodermal, from a training set of m enhancers which
have known activities. The SVM classifier works based on the
m
following decision function: f (x) = 1 λi K(xi , x) where K
is a kernel function and λs are coefficients which are learned
during the training process. Usually, the linear kernel function
is used for simple data and the radial kernel function is for
the more complex cases.
SVM is a parameter-sensitive machine learning classification method, particularly with the radial kernel function.
Researchers in [3] used fine-grained grid searching to achieve
the optimal result in which C and γ were set as integer values
ranging from 10−2 to 105 and from 10−6 to 102 respectively.
It resulted on average 78% accuracy SVM performance with
LOOCV. In this paper, we investigate the optimization of two
important parameters: C and γ by using Genetic Algorithm.
GA method will search finer in the parameter spaces, and so
better results are expected.
B. Genetic Algorithm
The GA algorithm works as follow (see pseudo code
Algorithm 1): at tth generation called P (t) consisting of
N solutions or N set of parameters (C, γ). Each solution
is evaluated with a fitness function, here, an AUC value. A
next generation (t + 1)th is created by selecting the best
individuals via lottery cycle procedure and GA operators
including mutation or cross-over. More details about GA
could be refered to [9]. The builds of chromosome and fitness
function of GA for our problem are discussed in the next
section.
Algorithm 1: GA algorithm to improve the prediction
Data: An enhancer set with known regulation activity
Output: The best solution
begin
t ← 0 (generation index);
Initialize the generation P (t);
Evaluate P (t);
while termination condition is not met do
t ← t + 1 (next generation);
Select new generation Q(t) from P (t − 1);
Create P (t) from Q(t) by GA operators;
Evaluate P (t) and Select the best individuals;
Output the best solution;
end
The standard implementation with default parameters of GA
algorithm is derived from R package genalg 1 .
C. Fitness function and representation of parameters in GA
The main issue of GA is how to present the problem by a
chromosome. In our method, two parameters C and γ were
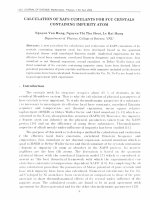
encoded by a chromosome in binary vector. In details, each
chromosome consists of a 51-bit binary vector that represents
real values of the parameters. The 24 first bits are reserved for
the C and the rest represents the value of γ. Figure 2 gives an
example of a chromosome, mutation and crossover operations.
In the mutation, the bit zero in the dark cell of a chromosome
is changed to the bit one in the result chromosome. In the
crossover, two chromosomes are divided at the same postion,
then heads and tails of two chromosomes are exchanged.
At each step, the GA algorithm in silico evolves the population and selects the best individuals for the next generation
according to the fitness function which is defined as the Area
Under Curve (AUC) value computed by [10]. At the last stage,
the best binary vectors are used to transformed back to the
real-valued parameters normalized by a factor of 102 (with
C) and 106 (with γ).
IV. EXPERIMENTAL RESULTS
A. Data & Evaluation
We used two published datasets from the model organism
Drosophila Melanogaster: the first consisted of 310 CRMs
1 />
Fig. 2. 51-bit binary representation consists of 24 bits for C and 27 bit for γ.
After a generation, GA operators like mutation and cross-over are performed
to generate a new representation.
with known regulatory activity, the second was a selected
collection of 35 novel enhancers whose expression category
was tested in vivo from more than 8000 enhancers [3]. The
310 enhancers are from the CRM Activity Database (CAD)
with the expression driven by published CRMs, using REDFly
database [8]. For the second set, we used the training set as the
first 310 known enhancers. The novel enhancers were selected
and tested in vivo from [3].
It is worth to note that the majority of datasets were
imbalanced, i.e the number of active and non-active enhancers
were not equally. To evaluate such the type of data, we used
the so-called Balanced Accuracy (BACC) as the average of
Sensitivity and Specificity of the prediction results. In addition,
we used the traditional Area Under the Curves (AUC) to
estimate the trade off between the two measurements. All
evaluations were computed under the unbiased Leave-One-Out
cross validation (LOOCV) context. The proposed method were
run 20 times and results were recorded. Initiation parameter
of GA was default by the genalg package. The run time is an
hour in PC 3.3Ghz 4GB RAM, while traditional grid search
tooks about 5 minutes in implementation because of its simple
strategy. However, it is not a significant problem for more and
more powerful machine nowadays.
B. Comparative Study
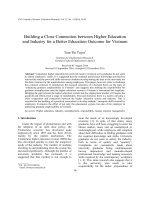
1) Known enhancer dataset: The GA SVM outperforms
the previous study in all cases of datasets including MESO,
VM, SM and VM SM (Fig 3). In case of Meso SM, the performances of two methods are similar and both up to 82%. It is
remarkable to see that the GA SVM significantly improved up
to 10% average the performance of SVM prediction for three
cases of unique regulatory activity (Meso, VM and SM). The
big gap proofs the efficiency of the parameter optimization of
SVM for a particular type of data.
In the view of AUC, the mean and deviation of run 20
times were recoreded, see the table I. The proposed method
Fig. 3.
The comparison of Balanced Accuracy (BACC) between the
GA SVM method and the grid search (GS SVM) method [3] for five
experimental categories. The GA SVM (for 20 runs) outperforms the other
method in all cases.
again has significantly higher performance than the grid search
method in cases of uniquely regulatory activities. The ROCR
package [10] is used for the computation.
Regulatory category
Meso
VM
SM
Meso SM
VM SM
GS SVM[3]
0.66
0.67
0.71
0.82
0.74
GA SVM
0.71±0.01
0.78±0.01
0.75±0.01
0.83±0.01
0.82±0.02
TABLE I
T HE COMPARISON BETWEEN THE GA SVM METHOD WITH THE GRID
SEARCH METHOD (GS SVM) [3] IN TERMS OF A REA U NDER THE
C URVES (AUC) FOR ALL EXPERIMENTAL CATEGORIES .
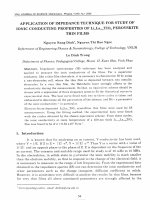
Fig. 4. The comparison between the GA SVM method with the grid search
method [3] for the novel enhancers. True Positive and False Positive indicates
the CRMs with unique regulatory activities where the prediction results are
true/false. Partial indicates the number of CRMs that the predicted regulatory
activity is one of the expression categories detected by in vivo experiments.
expression category where the prediction information needs
to be more precise. In addition, we also outperformed the
prediction in the novel enhancers when using known enhancers
as training set. That indicates the importance of optimization in
biological prediction. The biological data is in emerging time
that leads to the needs of optimal computational optimization.
Future work includes challenging a diversity of prediction
problems in biology and then building up an automatic systems
of evolutionary computation algorithms to learn the prediction
parameters from the biological data itself.
ACKNOWLEDGMENT
This work is partially supported by Vietnams National Foundation
for Science and Technology Development (NAFOSTED).
R EFERENCES
2) In vivo enhancer test: In [3], they carried out the in
vivo experiments for 35 among more than 8000 new enhancers
and reported its specific regulatory activities. In this paper, we
evaluate the performance of the two methods by predicting
these datasets. It also considered the so-called partially corrected predictions if the enhancers were predicted one of the
expression categories observed. Both methods well-perform
up to approximately 80% of novel CRM regulatory activities
(see Fig 4). Interestingly, the GA SVM improves significantly
number of CRM activity predictions for partially expression. It
also helps to decrease number of false positive CRM activity
predictions significantly compared to the previous results [3].
It indicates that the well-suited prediction parameters are
necessary for learning the rules from known CRM datasets
to predict the activity of the novel ones where the training
information might not be really fit the predicting information.
V. CONCLUSIONS
We proposed a new way to improve the prediction of
gene regulatory activity based on transcriptional factor binding
profiles. Our performance was improved roughly more than
10% accuracy compared to the previous method. Especially,
we gained the significantly better results in case of unique
[1] A. Stark, “Learning the transcriptional regulatory code,” Mol. Syst. Biol.,
vol. 5, p. 329, 2009.
[2] M. I. Arnone and E. H. Davidson, “The hardwiring of development:
organization and function of genomic regulatory systems,” Development,
vol. 124, pp. 1851–1864, May 1997.
[3] R. P. Zinzen, C. Girardot, J. Gagneur, M. Braun, and E. E. Furlong,
“Combinatorial binding predicts spatio-temporal cis-regulatory activity,”
Nature, vol. 462, pp. 65–70, Nov 2009.
[4] P. J. Park, “ChIP-seq: advantages and challenges of a maturing technology,” Nat. Rev. Genet., vol. 10, pp. 669–680, Oct 2009.
[5] C. Cortes and V. Vapnik, “Support-vector networks,” Machine Learning,
vol. 20, pp. 273–297, 1995, 10.1007/BF00994018. [Online]. Available:
/>[6] X. Zhang, X. Chen, and Z. He, “An aco-based algorithm for
parameter optimization of support vector machines,” Expert Syst.
Appl., vol. 37, pp. 6618–6628, September 2010. [Online]. Available:
/>[7] C.-L. Huang and C.-J. Wang, “A ga-based feature selection and parameters optimizationfor support vector machines,” Expert Systems with
Applications, vol. 31, no. 2, pp. 231 – 240, 2006. [Online]. Available:
/>[8] M. S. Halfon, S. M. Gallo, and C. M. Bergman, “REDfly 2.0: an
integrated database of cis-regulatory modules and transcription factor
binding sites in Drosophila,” Nucleic Acids Res., vol. 36, pp. D594–
598, Jan 2008.
[9] C. Reeves, Genetic Algorithms and Combinatorial Optimisation: Applications of Modern Heuristic Techniques. UK: In V.J. Rayward- Smith
(Eds), Alfred Waller Ltd, Henley-on-Thames, UK, 1995.
[10] T. Sing, O. Sander, N. Beerenwinkel, and T. Lengauer, “ROCR: visualizing classifier performance in R,” Bioinformatics, vol. 21, pp. 3940–3941,
Oct 2005.