DSpace at VNU: Origins of unusual alcohol selectivities over mixed MgAl oxide-supported K MoS2 catalysts for higher alcohol synthesis from syngas
Bạn đang xem bản rút gọn của tài liệu. Xem và tải ngay bản đầy đủ của tài liệu tại đây (770.35 KB, 32 trang )
Subscriber access provided by Washington & Lee University Library and VIVA (Virtual Library of Virginia)
Article
Origins of Unusual Alcohol Selectivities over Mixed MgAl Oxide
Supported K/MoS2 Catalysts for Higher Alcohol Synthesis from Syngas
Michael Morrill, Nguyen Tien Thao, Heng Shou, Robert J Davis, David G
Barton, Daniela Ferrari, Pradeep K Agrawal, and Christopher W Jones
ACS Catal., Just Accepted Manuscript • DOI: 10.1021/cs400147d • Publication Date (Web): 05 Jun 2013
Downloaded from on June 12, 2013
Just Accepted
“Just Accepted” manuscripts have been peer-reviewed and accepted for publication. They are posted
online prior to technical editing, formatting for publication and author proofing. The American Chemical
Society provides “Just Accepted” as a free service to the research community to expedite the
dissemination of scientific material as soon as possible after acceptance. “Just Accepted” manuscripts
appear in full in PDF format accompanied by an HTML abstract. “Just Accepted” manuscripts have been
fully peer reviewed, but should not be considered the official version of record. They are accessible to all
readers and citable by the Digital Object Identifier (DOI®). “Just Accepted” is an optional service offered
to authors. Therefore, the “Just Accepted” Web site may not include all articles that will be published
in the journal. After a manuscript is technically edited and formatted, it will be removed from the “Just
Accepted” Web site and published as an ASAP article. Note that technical editing may introduce minor
changes to the manuscript text and/or graphics which could affect content, and all legal disclaimers
and ethical guidelines that apply to the journal pertain. ACS cannot be held responsible for errors
or consequences arising from the use of information contained in these “Just Accepted” manuscripts.
ACS Catalysis is published by the American Chemical Society. 1155 Sixteenth Street
N.W., Washington, DC 20036
Published by American Chemical Society. Copyright © American Chemical Society.
However, no copyright claim is made to original U.S. Government works, or works
produced by employees of any Commonwealth realm Crown government in the course
of their duties.
Page 1 of 31
1
2
3
4
5
6
7
8
9
10
11
12
13
14
15
16
17
18
19
20
21
22
23
24
25
26
27
28
29
30
31
32
33
34
35
36
37
38
39
40
41
42
43
44
45
46
47
48
49
50
51
52
53
54
55
56
57
58
59
60
ACS Catalysis
Origins of Unusual Alcohol Selectivities over Mixed MgAl Oxide
Supported K/MoS2 Catalysts for Higher Alcohol Synthesis from Syngas
Michael R. Morrill,a Nguyen Tien Thao,a1 Heng Shou,b Robert J. Davis,b David G. Barton,c Daniela
Ferrari,d Pradeep K. Agrawal, a Christopher W. Jones a
a
School of Chemical & Biomolecular Engineering, Georgia Institute of Technology,
311 Ferst Dr. NW, Atlanta, GA 30332, USA
b
Chemical Engineering Department, University of Virginia, Charlottesville, VA 22904, USA
c
d
The Dow Chemical Company, Core R&D, Midland, MI 48674, USA
The Dow Chemical Company, Hydrocarbons R&D, 2301 N Brazosport Blvd.,
Freeport, TX 77451, USA
*Principal Contacts: ; ;
Abstract
A series of MoS2 catalysts supported on Mg/Al hydrotalcite-derived mixed-metal oxide (MMO) supports
promoted with K2CO3 is used for alcohol synthesis via CO hydrogenation. Alcohol selectivities are found
to vary greatly when the Mo is loaded on the support at 5 wt. % compared with 15 wt. % Mo samples, all
with a Mo:K atomic ratio of 1:1. The most striking difference between the catalysts is the comparatively
low methanol and high C3+ alcohol selectivities and productivities achieved with the 5 % Mo catalyst.
This catalyst also produces more ethane than the 15 % Mo catalyst, which is shown to be associated with
ethanol dehydration and hydrogenation over residual acid sites on this catalyst with lower K content. A
series of catalysts with common composition (5 % Mo and 3 % K supported on MMO) prepared in
different manners all yield similar catalytic selectivities, thus showing that selectivity is predominately
controlled by the MMO to Mo ratio, rather than the synthesis method. When the Mo loading is the same,
catalytic higher alcohol productivity may be correlated to the degree of stacking of the MoS2 layers, as
1
Current address: Faculty of Chemistry, Vietnam National University, 19-Le Thanh Tong ST, Hanoi, Vietnam
ACS Paragon Plus Environment
ACS Catalysis
1
2
3
4
5
6
7
8
9
10
11
12
13
14
15
16
17
18
19
20
21
22
23
24
25
26
27
28
29
30
31
32
33
34
35
36
37
38
39
40
41
42
43
44
45
46
47
48
49
50
51
52
53
54
55
56
57
58
59
60
Page 2 of 31
assessed via X-ray diffraction and scanning transmission electron microscopy. Control reactions where K
loading is increased or the positioning of the MMO in the catalyst bed is changed via creation of multiple
or mixed catalyst beds show that Mo/K/MMO domains play a significant role in alcohol forming
reactions. Higher alcohol forming pathways are proposed to occur via CO insertion pathways or via
coupling of adsorbed reaction intermediates at or near MoS2 domains. No evidence is observed for
significant alcohol coupling pathways by adsorption of alcohols over downstream, bare MMO supports,
although some coupling may occur over K-promoted MMO supports. Nitrogen physisorption, XRD,
Raman, UV-vis DRS, STEM, and XANES are used to characterize the catalysts, demonstrating that the
degree of stacking of the MoS2 domains differs significantly between the low (5 % Mo) and high (15 %
Mo) loading catalysts.
Keywords: Syngas, Higher Alcohols, Molybdenum Sulfide, Mixed Metal Oxide, Hydrotalcite.
Introduction
Synthesis of methanol from syngas is a well-established commercial process, with significant
understanding of the molecular level steps of the catalytic processes.[1-6] Higher alcohol synthesis, though
not as thoroughly investigated as methanol synthesis, remains a topic of vigorous research since its initial
significant investigation in the 1980’s.[7-12] Higher alcohols such as ethanol can be produced via a variety
of pathways, including sugar/lignocellulose fermentation, ethylene hydration, or the catalytic conversion
of syngas (H2, CO, and CO2) via Fischer-Tropsch processes.[1-6,13] Along with ethanol, C3+ alcohols such
as 1-propanol and 1-butanol are the focus of many studies due to their increasing use as fuel additives and
chemicals.[7-12,14-16] Syngas conversion over solid catalysts based on a multitude of transition metals has
been studied for this purpose, including Cu, Fe, Zn, Ru, Rh, Mn, and Mo-based compositions.[1-6,17-25]
ACS Paragon Plus Environment
Page 3 of 31
1
2
3
4
5
6
7
8
9
10
11
12
13
14
15
16
17
18
19
20
21
22
23
24
25
26
27
28
29
30
31
32
33
34
35
36
37
38
39
40
41
42
43
44
45
46
47
48
49
50
51
52
53
54
55
56
57
58
59
60
ACS Catalysis
Molybdenum sulfide based catalysts, when combined with an alkali metal such as potassium,[7-12,26] are of
particular interest due to their low cost compared to noble metal catalysts, their good alcohol selectivity,
and their high resistance to sulfur poisoning. However, they also possess disadvantages such as lower
activity than noble metal catalysts and the need for comparatively higher reaction pressures to achieve
useful catalytic productivities.[13,19,27-31] To reduce this disadvantage, promoters such as cobalt[9,11,12,14-16,32]
have been added to increase alcohol selectivity and nickel[33-35] has been used to improve catalytic
activity.
In addition to bulk MoS2-based catalysts, supported MoS2 catalysts have also been widely evaluated as a
means to maximize higher alcohol selectivity and productivity. Early studies were performed by Concha
et al. and Tatsumi et al. using SiO2, TiO2, MgO, Al2O3, CeO2, and a variety of carbons as supports.[10,36-38]
Concha studied MoS2 with no alkali addition while Tatsumi studied reduced, oxidic Mo rather than MoS2.
Tatsumi et al. followed up their initial work with studies of Mo supported on silica, where several olefins
and alcohols were co-fed into the reactant syngas stream.[39,40] They found added Cn olefins to yield
higher amounts of Cn+1 alcohols and concluded that CO insertion was the primary chain growth
mechanism over these catalysts, rather than methanol homologation or alcohol coupling of lower alcohols
(Guerbet reaction). Later, further studies were performed on MoS2 using activated carbon,
[11,41-46]
multi-
walled carbon nanotubes (MWCNT),[47-59] and γ-alumina[60-63] as supports.
Perhaps the two most important findings of the body of work on CO hydrogenation over supported MoS2
are that dispersing MoS2 domains greatly enhances catalytic activity and that the support itself can affect
selectivity by facilitating other reaction pathways, some of which are unfavorable such as alcohol
dehydration. With these findings in mind, we recently investigated[64] the use of mesoporous Mg/Al
mixed metal oxides (MMO) derived from layered double hydroxides[65-67] as a support to create dispersed
MoS2 domains for higher alcohol synthesis. We hypothesized that a more basic support would promote
ACS Paragon Plus Environment
ACS Catalysis
1
2
3
4
5
6
7
8
9
10
11
12
13
14
15
16
17
18
19
20
21
22
23
24
25
26
27
28
29
30
31
32
33
34
35
36
37
38
39
40
41
42
43
44
45
46
47
48
49
50
51
52
53
54
55
56
57
58
59
60
Page 4 of 31
alcohol forming reactions, unlike γ-alumina, which is commonly acidic and known instead to promote
alcohol dehydration.[68-70] We found that the MMO support, when loaded with approximately 5 wt. % Mo
and 3 % K (Mo:K of 1:1), showed strikingly lower methanol selectivity than other supported catalysts,
deviating from a typical Anderson Schulz Flory distribution, while maintaining a high C2+ alcohol
selectivity at 8 % CO conversion. In that report,
[64]
we postulated that the role of secondary reactions
such as alcohol coupling could be a cause of the unusual alcohol distribution significantly biased towards
C2+ alcohols.
Previous studies have shown that changes in Mo loading when supported on alumina can affect product
distributions and activity for hydrogenation[43,71-73] and hydrodesulfurization[74] reactions. Most notably,
Li et al. showed that increasing Mo loading on a carbon support led to decreased methanol to C2+OH
ratios and increased catalytic activities[43]. They attributed these outcomes to “more complete” Mo-K
interactions that came about as Mo domains grew larger and Mo-support interactions became
proportionately less prominent. In this study, we investigate the effects of Mo loading on MMO supported
catalysts in terms of selectivity and productivity. Additionally, we study the effects of K loading and the
role of the MMO support to deconvolute the specific roles of Mo, K, and MMO in the reaction.
Experimental
MMO supported catalysts with approximate Mo loadings of 5 and 15 wt. % were synthesized and
combined with K2CO3 (Sigma-Aldrich, 99 %) in a manner similar to our previous study.[64] For this paper,
the samples are referred to as Mo/K/MMO-5,3 (the first number, 5, denoting nominal Mo weight loading
and the second number, 3, denoting K weight loading) and Mo/K/MMO-15,9 respectively. In brief, MMO
was made via co-precipitation of a magnesium nitrate hexahydrate (Alfa Aesar, 98–102 %) and aluminum
nitrate nonahydrate (Alfa Aesar, 98–102 %) aqueous solution (Mg:Al molar ratio of 7:3 and 0.6 M in
ACS Paragon Plus Environment
Page 5 of 31
1
2
3
4
5
6
7
8
9
10
11
12
13
14
15
16
17
18
19
20
21
22
23
24
25
26
27
28
29
30
31
32
33
34
35
36
37
38
39
40
41
42
43
44
45
46
47
48
49
50
51
52
53
54
55
56
57
58
59
60
ACS Catalysis
metal ions) and with 1.2 M NaOH (EMD, 97.0 %) and 0.15 M Na2CO3 (Aldrich, 99.5+ %) at 65 °C and a
pH of 9.5. The solution was then stirred for 48 hours, filtered, washed with deionized water, dried at 105
°C, then calcined at 450 °C for 2 h. Ammonium molybdate tetrahydrate (AMT) (Aldrich, ACS Reagent)
was dissolved in DMSO (Aldrich, 99.9+ %) and added to MMO at room temperature via incipient
wetness impregnation. DMSO was used as an impregnation solvent rather than water to prevent the partial
reformation of the original hydrotalcite structure, which can in turn reduce catalytic activity by increasing
crystallite size and “burying” promoters.[29,75,76] The material was then dried in open atmosphere at 135 °C
for 12 hours, loaded into a quartz tube, and decomposed via heating to 450 °C for 2 h with a heating rate
of 5 °C/min under 40 mL/min of flowing nitrogen, which was used rather than air to maintain consistency
with the previous study which included carbon as a support.
Due to the low solubility of AMT in DMSO, the incipient wetness impregnation step was repeated
multiple times to load adequate AMT onto the MMO support for Mo/K/MMO-15,9. After each
impregnation, the sample was heated to 135 °C in open atmosphere for approximately 12 hours, then
cooled to room temperature again. After the decomposition step (heating to 450 °C for 2 h), the resultant
MoOx/MMO samples were physically ground for 15 minutes with K2CO3 (Sigma-Aldrich, 99 %, stored
in an oven at 105 °C), pressed into 10 mm pellets at 1500 psig, crushed, and sieved to 20 – 40 mesh.
For catalytic reactions, sieved particles accounting for approximately 50 mg Mo (1.0 g of a 5 % Mo
catalyst and 0.33 g of a 15 % Mo catalyst) were loaded into a ¼” steel tube and pretreated with 10 %
H2S/H2 (Matheson Tri-Gas, UHP) as described in our previous study. [64] Reactions with syngas, 45 % H2
(Airgas, UHP), 45 % CO (Airgas, UHP, purified with 5A molecular sieve carbonyl trap), 10 % N2 (Airgas
UHP) as an internal standard, and 50 ppm H2S (from 5000 ppm H2S in He, Matheson Tri-Gas, UHP),
were carried out at 310 °C and 1500 psig at flow rates from approximately 10 – 100 standard ml/min (700
– 17000 mLsyngas/gcatalyst/hr). Reactions were carried out until activity and product selectivity stabilized,
which took approximately 4 days. Conversions were then changed as needed by changing syngas flow
ACS Paragon Plus Environment
ACS Catalysis
1
2
3
4
5
6
7
8
9
10
11
12
13
14
15
16
17
18
19
20
21
22
23
24
25
26
27
28
29
30
31
32
33
34
35
36
37
38
39
40
41
42
43
44
45
46
47
48
49
50
51
52
53
54
55
56
57
58
59
60
Page 6 of 31
rate through the reactor. Please note that studies of toxic (CO, H2S) and flammable (H2, CO, H2S) gases
under high pressure require significant safety precautions.
An Agilent 7890 gas chromatograph was used to quantify the main reaction products (methane, ethane,
ethylene, propane, propylene, butane, methanol, ethanol, 1-propaniol, i-propanol, 1-butanol, 2-methylbutanol, acetaldehyde, propionaldehyde, methyl formate, methyl acetate, and ethyl acetate). Details on
product quantification may be found in a previous study.[64] The sulfide catalysts, oxide precatalysts, and
supports were characterized via nitrogen physisorption, powder X-ray diffraction (XRD), Raman
spectroscopy, UV-vis diffuse reflectance spectroscopy (DRS), Extended X-ray Absorption Fine Structure
(EXAFS), X-ray Absorption Near Edge Spectroscopy (XANES), scanning transmission electron
microscopy (STEM), and temperature programmed reduction (TPR).
Sulfided catalysts were
characterized ex-situ after in-situ passivation with 1 % O2 in He (Matheson Tri-gas, UHP) for 8 h at room
temperature flowing at 40 ml/min.
Elemental analysis was performed with a Perkin Elmer Optima 7300 DV equipped with an optical
emission spectrometer. Aliquots of each catalyst were digested in an H2O2/HNO3 solution and then
analyzed in duplicate. Nitrogen physisorption isotherms were collected at -196 °C using a Micromeritics
Tristar II. All samples were heated to 200 °C under vacuum for 10 h before analysis. XRD was
performed using a Philips X-pert diffractometer using CuKα radiation.
Raman spectra were obtained using a Witec confocal Raman microscope (Alpha 300R) with an Ar+ ion
laser (λ = 514.5 nm) with 1 mW (for MoS2) and 3 mW (for MoOx) excitation source intensity. UV-Vis
spectra were obtained on a Cary UV-Vis 500 with an internal diffuse reflectance cell. Pure MMO was
used as a background. Samples for STEM were prepared by dispersing the particles in isopropanol,
ACS Paragon Plus Environment
Page 7 of 31
1
2
3
4
5
6
7
8
9
10
11
12
13
14
15
16
17
18
19
20
21
22
23
24
25
26
27
28
29
30
31
32
33
34
35
36
37
38
39
40
41
42
43
44
45
46
47
48
49
50
51
52
53
54
55
56
57
58
59
60
ACS Catalysis
sonicating the dispersion, and dropping them on a TEM grid. Images were collected on a JEOL 2200FSAC STEM operating at 200 keV at Oak Ridge National Laboratory.
X-ray absorption spectroscopy (EXAFS and XANES) was performed at beam lines X18B and X23A2 of
the National Synchrotron Light Source (NSLS), Brookhaven National Laboratory. The storage ring was
typically operated at 2.8 GeV with a ring current of about 300 mA. The XAS data were obtained in the
transmission mode at the Mo K edge (20 keV) with a spot size of 0.5mm × 5mm. The Mo K edge spectra
were measured at room temperature in air with Mo foil (0.015 mm, 99.9%, Goodfellow) as energy
references. Supported Mo samples were ground with boron nitride (99%, Aldrich) to obtain an absorption
thickness of 1 inside a 5/32” ID pyrex tube. Three scans from 19700 eV to 21220 eV were collected for
each sample. The XAS data were processed using the Athena[77] software for background removal, postedge normalization, and X-ray absorption near-edge structure (XANES) analysis. Standard bulk MoS2
(Acros, 98.5%) was used to determine the amplitude reduction factors (S02) for Mo−S and Mo−Mo. The
interatomic distances (r), coordination numbers (CN), Debye−Waller factors (σ2), and energy shifts (∆E0)
were derived from fitting the results in the Artemis software package.[77] The EXAFS results were fitted
in R-space using two shells (Mo–S & Mo–Mo) generated theoretically using FEFF 6.0.[78]
Results and Discussion
Catalyst Characterization
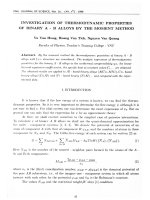
XRD patterns of the synthesized materials are shown in Figure 1. Diffraction lines that are characteristic
of the MgO component of MMO at 44° and 64° were readily apparent on all supported samples. The lines
are smaller on Mo/K/MMO-15,9 mostly likely due to disruption of MMO crystallinity on account of
larger concentrations of Mo and K. A single diffraction line at 27° that corresponds to the (021) plane in
MoO3[79] can be observed only on the oxide precatalyst form of Mo/K/MMO-15,9. The Mo/K/MMO-5,3
counterpart does not show this diffraction line because the MMO support contains comparably smaller
ACS Paragon Plus Environment
ACS Catalysis
Mo domains. This difference is also reflected in the Raman and UV-vis spectra, which are discussed later
in the text.
Both the oxide precatalyst forms of Mo/K/MMO-5,3 and Mo/K/MMO-15,9 show small peaks around 32°
that are characteristic of potassium molybdate structures. Small peaks for the MoS2 [100] (33°) and [110]
(58°) planes were observed on both supported, sulfide samples. An interesting difference between the
sulfide catalysts can be observed for the [002] plane of sulfide domains at 14°, which is prominent for the
bulk MoS2 sample, apparent for the Mo/K/MMO-15,9 catalyst, and absent for the Mo/K/MMO-5,3
catalyst. The presence of the line could be indicative of greater Mo-S stacking in the sulfided domains,[80]
or because Mo loadings are different for the two catalysts, the peak’s absence in Mo/K/MMO-5,3 could
be attributed to the lower Mo loading.
2500
100
103
110
002
Bulk MoS2
2000
Mo/K/MMO-15,9-SR
Counts (a.u.)
1
2
3
4
5
6
7
8
9
10
11
12
13
14
15
16
17
18
19
20
21
22
23
24
25
26
27
28
29
30
31
32
33
34
35
36
37
38
39
40
41
42
43
44
45
46
47
48
49
50
51
52
53
54
55
56
57
58
59
60
Page 8 of 31
1500
Mo/K/MMO-5,3-SR
1000
Mo/K/MMO-15,9-O
500
Mo/K/MMO-5,3-O
0
MMO
10
20
30
40
50
60
70
80
90
2θ
Figure 1. XRD of supported and unsupported K2CO3 promoted MoS2. Supported samples were
sulfided in-situ and reacted with syngas for 2-4 days.
ACS Paragon Plus Environment
Page 9 of 31
1
2
3
4
5
6
7
8
9
10
11
12
13
14
15
16
17
18
19
20
21
22
23
24
25
26
27
28
29
30
31
32
33
34
35
36
37
38
39
40
41
42
43
44
45
46
47
48
49
50
51
52
53
54
55
56
57
58
59
60
ACS Catalysis
The BET surface areas shown in Table 1 are calculated from nitrogen physisorption data and show a
small drop when the MMO support was impregnated with 5 % Mo and 3 % K and a large drop in surface
area when the support was impregnated with 15 % Mo and 9 % K. Additionally, the Mo/K/MMO-5,3
sample lost much more surface area than Mo/K/MMO-15,9 after sulfidation and reaction. This effect
may be due to a bigger impact of carbon deposition or sintering on the highly porous, exposed MMO
surface of Mo/K/MMO-5,3 compared to the higher loading Mo/K/MMO-15,9 sample.
Table 1. BET surface area derived from nitrogen physisorption data for the materials used in this
study.
Sample
BET Surface Area (m2/g)
MMO support
209
Mo/K/MMO-5,3 – oxide precatalyst
151
Mo/K/MMO-5,3 – sulfided, reacted
69
Mo/K/MMO-15,9 – oxide precatalyst
26
Mo/K/MMO-15,9 – sulfided, reacted
24
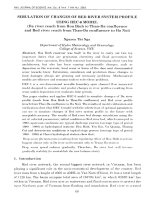
The Raman spectra of the oxide precatalysts are shown in Figure 2a. The spectra of the oxide precatalysts
were collected before the addition of K2CO3 to emphasize only the differences in the Mo domains. The 15
% and 5 % loaded Mo, alkali-free counterparts are denoted as Mo/MMO-15 and Mo/MMO-5,
respectively. The Mo/MMO-15 spectrum showed bands at 957, 847, and 370 cm-1. These bands are
characteristic of Mo7O244- domains that become increasingly prevalent when Mo loading rises.[81-83]
Raman bands at bands 902 and 321 cm-1 are readily apparent for Mo/K/MMO-5 and are characteristic of
MoO42- domains. The band at 902 cm-1 is also present in the Mo/MMO-15 spectra indicating that at high
Mo loadings, a multitude of oxide domains will form.
Bands representing crystalline MoO3 are absent from Mo/MMO-15, which has a Mo loading well above
the monolayer surface coverage threshold. Notably, the sample itself was dark brown in color. These
color centers have potential to scatter light and in turn mask characteristic bands. The sample’s color is
likely caused by a small amount of autoreduced Mo that formed during the decomposition of AMT. A
ACS Paragon Plus Environment
ACS Catalysis
second Raman spectrum was taken after treating Mo/MMO-5 and Mo/MMO-15 in a calcination oven in
air at 450 °C for 2 hours (Mo/MMO-5-Air and Mo/MMO-15-Air respectively). The resultant spectrum
shown in Figure S1 in the supporting information contains similar molybdate bands as Mo/MMO-15 and
additional MoO3 bands, as was originally expected. The autoreduced Mo likely existed in very small
proportions given the absence of MoO2 character in both the XRD and XANES data. Specifically, the
XRD pattern shows no MoO2 diffraction lines, which implies that either crystalline MoO2 is not present in
the sample at all or that the domains are too small to be detected. The XANES spectrum, which will be
discussed in more detail later, shows a K-edge that correlates almost perfectly with MoO3. Additionally,
the band at 550 cm-1 on Mo/MMO-5, which correlates with neither MoO2 nor MoO3, disappeared on
Mo/MMO-5-Air, indicating that it is not a likely component of the MoOx structures.
6000
Intensity (a.u.)
1
2
3
4
5
6
7
8
9
10
11
12
13
14
15
16
17
18
19
20
21
22
23
24
25
26
27
28
29
30
31
32
33
34
35
36
37
38
39
40
41
42
43
44
45
46
47
48
49
50
51
52
53
54
55
56
57
58
59
60
Page 10 of 31
a.
370
321
957
902
847
b.
380
404
1200
Mo/MMO-15
(oxide precatalyst)
4000
Bulk MoS2
800
Mo/MMO-5
(oxide precatalyst)
2000
Mo/K/MMO-15,9
reacted)
400
MMO
0
250
500
750
1000
Wavenumbers (cm-1)
0
360
(sulfided,
Mo/K/MMO-5,3
reacted)
420
(sulfided,
380
400
Wavenumbers (cm-1)
Figure 2. Raman spectra of the MMO supported Mo/K materials precatalysts (a.) and sulfides (b.)
with a 1.5 and 0.5 mW 514 nm laser respectively.
Unlike in the case of the oxide precatalysts, the Raman spectra of the sulfided, catalysts after reaction,
shown in Figure 2b do not show dramatic differences between the samples with different Mo loadings.
Bands at 380 and 404 cm-1, which are characteristic of Mo-S vibrations, were present in the two sulfide
samples.[84] The implications of the Raman spectra of the sulfide samples is simply that the two catalysts
possess similar Mo-S bonds that are not influenced differently by support interactions and that the peaks
for the Mo-O vibrations have disappeared.
ACS Paragon Plus Environment
Page 11 of 31
1
2
3
4
5
6
7
8
9
10
11
12
13
14
15
16
17
18
19
20
21
22
23
24
25
26
27
28
29
30
31
32
33
34
35
36
37
38
39
40
41
42
43
44
45
46
47
48
49
50
51
52
53
54
55
56
57
58
59
60
ACS Catalysis
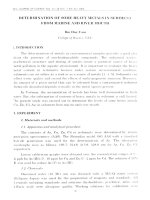
Additional information about the supported MoO3 domains can be obtained from UV-vis DRS data.[85]
The absorption edge energies of the various samples in this study were determined by plotting [F(R∞)hv]2
vs. hv and then finding the x-intercept of the line fitted to the low-energy rise of each spectrum in the
dataset. This rise represents a ligand to metal charge transfer, whose energy is represented by the xintercept of the fit line.[81,83,85,86] Generally, lower energies are associated with larger aggregates. The UVvis data in Figure 3 are complementary to the Raman spectra, yielding useful insights into the
molybdenum domain sizes of the oxide precatalysts. The highest edge energy band of Mo/K/MMO-15 is
between that of crystalline Mo7O246- and Mo2O72- standards from literature while the edge energy for bulk
MoO3 is between that of MoO3 and Mo7O246-.[85] Finally the edge energy of Mo/K/MMO-5 is close to that
of crystalline MoO42-. The spectra for Mo/MMO-15 has a second, less intense edge at approximately 2.2
eV, which is absent from the UV-vis of Mo/MMO-15-Air shown in Figure S2. Consequently, this edge
may be considered a mathematical artifact due to the dark color of the sample and extremely low
reflectance.
ACS Paragon Plus Environment
ACS Catalysis
Mo/MMO-15
(oxide precatalyst)
150
Bulk MoO3
(from decomposed
AMT)
Kubelka-Munk
1
2
3
4
5
6
7
8
9
10
11
12
13
14
15
16
17
18
19
20
21
22
23
24
25
26
27
28
29
30
31
32
33
34
35
36
37
38
39
40
41
42
43
44
45
46
47
48
49
50
51
52
53
54
55
56
57
58
59
60
Page 12 of 31
100
Mo/MMO-5
(oxide
precatalyst)
50
0
2
3
4
5
6
Energy (eV)
Figure 3. UV-vis DRS spectra for bulk MoO3 (from decomposed AMT), Mo/MMO-15, and
Mo/MMO-5.
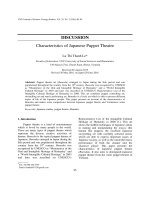
The differences in the supported MoS2 domains observed with XRD were clarified with STEM. Images of
Mo/K/MMO-15,9 and Mo/K/MMO-5,3 are shown in Figure 4. Both samples have long, thin MoS2
domains, but the structures in Mo/K/MMO-15,9 have approximately five stacked Mo-S layers while
Mo/K/MMO-5,3 has about two. Additionally, both of these samples have notably different domains from
those observed in a bulk MoS2 standard, which is made up of short, wide sheets with six or more Mo-S
layers, as shown in Figure 5. The uniquely different morphologies seen in the MMO supported samples
likely occur as a result of the differing initial MoyOx domains, which according to the Raman and UV-vis
spectra are (relatively) small on Mo/MMO-5 and larger on Mo/MMO-15.
ACS Paragon Plus Environment
Page 13 of 31
1
2
3
4
5
6
7
8
9
10
11
12
13
14
15
16
17
18
19
20
21
22
23
24
25
26
27
28
29
30
31
32
33
34
35
36
37
38
39
40
41
42
43
44
45
46
47
48
49
50
51
52
53
54
55
56
57
58
59
60
ACS Catalysis
Figure 4. STEM images of Mo/K/MMO-5,3 (a. and b.) and Mo/K/MMO-15,9 (c. and d.) after
sulfidation and reaction with syngas.
ACS Paragon Plus Environment
ACS Catalysis
1
2
3
4
5
6
7
8
9
10
11
12
13
14
15
16
17
18
19
20
21
22
23
24
25
26
27
28
29
30
31
32
33
34
35
36
37
38
39
40
41
42
43
44
45
46
47
48
49
50
51
52
53
54
55
56
57
58
59
60
Page 14 of 31
Figure 5. STEM images of bulk MoS2 synthesized from ammonium molybdate tetrahydrate and
ammonium sulfide.
The electronic and geometric structure of the molybdenum domains in the Mo/K/MMO-15,9 and
Mo/K/MMO-5,3 samples can be further characterized by XANES spectra (Figure 6). XANES has been
used to provide insights into oxidation states and coordination environment.[24,87-91] This technique is
specifically useful for assessing the state of Mo in the samples, as it may exist in catalysts and precatalysts
in the form of MoO2, MoO3, and MoS2, with each type of domain known to facilitate different
reactions.[92-94] MoO2 domains may exist as a product of incomplete sulfidation, which sometimes occurs
when supports and promoters are added to a catalyst.[43] Previously, we have used XANES spectroscopy
to characterize the state of the Mo species in supported catalysts, demonstrating that the XANES edge
energy can be correlated with the electronic structure of the molybdenum.[20,95]
In the case of the catalysts investigated in this study, three important observations can be made from the
XANES data. First, the two catalysts (Mo/K/MMO-5,3 and Mo/K/MMO-15,9) as oxides or sulfides
closely resemble their bulk counterparts, which indicates fairly complete levels of oxidation or sulfidation
ACS Paragon Plus Environment
Page 15 of 31
respectively, as opposed to significant oxysulfide content.
Second, the two catalysts have
indistinguishable edge energies when in the oxide form. As sulfides, they are also indistinguishable from
one another. This outcome suggests that the average electronic structure of the Mo species is not affected
by small differences in Mo domain structure. Finally, both the pre-edge and post-edge features in the
XANES spectra of the catalysts, as oxides or as sulfides, are also nearly identical. This outcome may be
slightly unexpected in the case of the oxide precatalysts given the differences revealed by UV-vis and
Raman data. Specifically, one might expect the greater Mo-support interactions on Mo/K/MMO-5,3 than
on Mo/K/MMO-15,9 in addition to the fundamentally different oxide domains (MoO42- and Mo7O246-) to
affect the K-edge. The most probable explanation for this observation is that the MoVI-O bonds are all
similar in structure in these materials, regardless of whether the bonding oxygen atom comes from the
oxide support or the Mo domain itself.
1.2
1.0
Bulk MoS2
Mo/K/MMO-5,3 (presulfided, reacted)
Mo/K/MMO-15,9 (presulfided, reacted)
Mo/K/MMO-5,3 (oxide precatalyst)
Mo/K/MMO-15,9 (oxide precatalyst)
Bulk MoO3
0.8
0.6
1.2
1.0
0.4
Normalized Absorption
Normalized Absorption
1
2
3
4
5
6
7
8
9
10
11
12
13
14
15
16
17
18
19
20
21
22
23
24
25
26
27
28
29
30
31
32
33
34
35
36
37
38
39
40
41
42
43
44
45
46
47
48
49
50
51
52
53
54
55
56
57
58
59
60
ACS Catalysis
0.2
0.8
0.6
0.4
Bulk MoS 2
Mo/K/MMO-5,3 (presulfided, reacted)
Mo/K/MMO-5,3 (presulfided, reacted)
Mo/K/MMO-5,3 (oxide precatalyst)
Mo/K/MMO-5,3 (oxide precatalyst)
Bulk MoO3
0.2
0.0
20000
0.0
19990
20100
20200
20300
20400
Energy (eV)
20000
20010
20020
20030
20040
Energy (eV)
Figure 6. XANES Mo K-edge spectra of the 5 % and 15 % Mo supported MMO samples after
combination with K2CO3, presulfidation, and reaction with CO.
ACS Paragon Plus Environment
ACS Catalysis
1
2
3
4
5
6
7
8
9
10
11
12
13
14
15
16
17
18
19
20
21
22
23
24
25
26
27
28
29
30
31
32
33
34
35
36
37
38
39
40
41
42
43
44
45
46
47
48
49
50
51
52
53
54
55
56
57
58
59
60
Page 16 of 31
The Fourier transforms (FT) of k3-weighted extended X-ray absorption fine structure (EXAFS) at the Mo
K edge of bulk MoS2 and the Mo/K/MMO samples after sulfidation and reaction are shown in Figure S3
and the structural parameters derived from the corresponding curve fits are presented in Table 2. Example
curve fits associated with the results in Table 2 are compared to the experimental EXAFS associated with
Mo/K/MMO-15,9 (sulfided and reacted) are shown in Figure S4. All of the R-factors of the fits are less
than 0.04, indicating good agreement between the experimental EXAFS and the corresponding curve fits.
The Mo–S and Mo–Mo interatomic distances in the supported MoS2 samples (Mo/K/MMO-5,3 and
Mo/K/MMO-15,9) matched that of bulk MoS2 standard within experimental error, indicating that the
supported Mo oxides were effectively sulfided in the supported samples, which is consistent with the
XANES results (Figure 6). However, both of the supported sulfides presented a significantly lower Mo–
Mo coordination number (~4) than that in bulk MoS2 (6), and a greater Mo–Mo Debye-Waller factor (≥ 3
× 10−3 Å2) than the corresponding value in bulk MoS2 (1.9 × 10⁻³ Å2), which indicates a high dispersion
of Mo in the supported Mo sulfides.
The two dimensional structure of a single MoS2 layer has structural regularity consistent with a Mo–Mo
coordination number of six within the layer. A reduced Mo–Mo coordination number of about four in the
supported MoS2 (Table 2) suggests that a single MoS2 layer is truncated in one dimension and may be as
small as two Mo atoms wide. Since the coordination number of Mo–Mo did not change upon increasing
the Mo loading from 5 wt. % to 15 wt. % the overall structure of the truncated layers must be quite
similar. Because an increase in the number of stacked layers of a supported MoS2 material is not expected
to increase the coordination of the first Mo-Mo shell, it is unsurprising that the increase in number of
MoS2 “sheets” for Mo/K/MMO-5,3 and Mo/K/MMO-15,9 as was observed in STEM (Figure 4) had little
effect on the Mo-Mo coordination numbers of the corresponding curve fits.
ACS Paragon Plus Environment
Page 17 of 31
1
2
3
4
5
6
7
8
9
10
11
12
13
14
15
16
17
18
19
20
21
22
23
24
25
26
27
28
29
30
31
32
33
34
35
36
37
38
39
40
41
42
43
44
45
46
47
48
49
50
51
52
53
54
55
56
57
58
59
60
ACS Catalysis
Table 2. Results from the Analysis of Mo K edge EXAFS
Sample
Shell
CN
r (Å)
a
∆σ2 (10−3 Å2)
∆E0 (eV)
R factor
Bulk MoS2
Mo–S
Mo–Mo
6
6a
2.40 ± 0.01
3.14 ± 0.01
2.3 ± 1.1
1.9 ± 1.2
2.4 ± 1.0
−5.7 ± 1.6
0.028
Mo/K/MMO-5,3,
sulfided and reacted
Mo–S
Mo–Mo
5.2 ± 0.5
3.8 ± 1.5
2.40 ± 0.01
3.13 ± 0.01
3.0 ± 1.1
3.6 ± 2.0
1.8 ± 1.0
−8.6 ± 2.3
0.033
Mo/K/MMO-15,9,
Mo–S
4.9 ± 0.4 2.41 ± 0.01 2.6 ± 0.9
4.0 ± 0.9
0.031
sulfided and reacted
Mo–Mo 3.9 ± 1.2 3.13 ± 0.01 3.0 ± 1.4
−6.9 ± 1.9
−1
Fitting parameters: Fourier transform range, ∆k, 2−14.5 Å ; fitting range, ∆R, 1−3.2 Å; weighting, k1 &
k3; S02(Mo−S) = 0.84, S02(Mo−Mo) = 0.79
a
Value was assigned in curving-fitting on the basis of standard structure.
Effect of Mo and K Loading on Catalysis
Mo/K/MMO-5,3 and Mo/K/MMO-15,9 were synthesized and reacted with syngas at 310 ˚C and 1500
psig operating at 3-15% CO conversion. Linear alcohol and hydrocarbon selectivities for these catalysts
are shown in Figures 7 and 8 respectively. These selectivities are presented on a CO2-free basis for clarity,
but it should be noted that MoS2-based catalysts efficiently catalyze the water-gas shift reaction,[32,96-100]
so CO2 selectivities are high (see supporting Table S2 in the supporting information). Two replicate
batches for these catalysts were also synthesized and reacted to ensure consistency. The data with error
bars are shown in Figures S5 and S6. Additionally, as a control, Mo/K/MMO-5,3 was loaded with
additional K such that the total K loading was the same as for Mo/K/MMO-15,9. Product selectivities for
the resultant catalyst, Mo/K/MMO-5,9, are also shown in Figures 7 and 8.
Total selectivity for non-alcohol oxygenates (acetaldehyde, propionaldehyde, methyl formate, methyl
acetate, and ethyl acetate) are relatively small for all three catalysts, with selectivities at 1.9 – 2.3 % for
Mo/K/MMO-5,3, 1.8 – 3.1 % for Mo/K/MMO-5,9, and 2.8-3.7 % for Mo/K/MMO-15,9, indicating that
oxygenate formation for these catalysts are chiefly linear, primary alcohols. With respect to linear
hydrocarbons and alcohols, the two Mo/K/MMO-5,x catalysts show strikingly different selectivity trends
ACS Paragon Plus Environment
ACS Catalysis
1
2
3
4
5
6
7
8
9
10
11
12
13
14
15
16
17
18
19
20
21
22
23
24
25
26
27
28
29
30
31
32
33
34
35
36
37
38
39
40
41
42
43
44
45
46
47
48
49
50
51
52
53
54
55
56
57
58
59
60
Page 18 of 31
from Mo/K/MMO-15,9. Specifically, methanol selectivities for Mo/K/MMO-5,x are substantially less
than for Mo/K/MMO-15,9 at all conversions. Ethanol selectivity decreases with increasing conversion for
Mo/K/MMO-5,x samples but increases with conversion for Mo/K/MMO-15,9. These outcomes suggest
the selectivitity differences are not related to K loading alone but are instead related to differences seen in
the characterization data (i.e. differently sized MoS2 domains) and/or high MMO:Mo ratios.
Ethane selectivity over these catalysts also emphasizes an important difference. There was little ethane
production over the Mo/K/MMO-x,9 catalysts while it was comparatively high over Mo/K/MMO-5,3. In
addition to being a product of Fischer-Trosch type CO insertions, ethane may also be a product of the
dehydration of ethanol followed by hydrogenation of the produced olefin. The dehydration of alcohols is
known to occur over acidic sites such as those found on alumina, which is also a component of the MMO
support. In a reducing environment dehydration can be followed by hydrogenation and thus ethanol to is
converted to ethane and 1-propanol to propane. Because alcohols or their respective intermediates must
first be formed for dehydration to take place, the reaction is likely secondary and should take place
preferentially at higher conversions.
Indeed, ethane selectivity for Mo/K/MMO-5,3, as shown in Figure 8 and Table S2 (and propane
selectivity, lumped with “Total HC” in Table S2) follow this expectation – increasing ethane selectivity
with conversion. The Mo/K/MMO-x,9 catalysts, on the other hand, do not exhibit such behavior. Instead
these catalysts produce almost negligible amounts of C2+ hydrocarbons. This result is expected given their
high K content, which should neutralize acidic sites. Methanol is not likely involved in similar
dehydration pathways given the absence of dimethyl either, which was produced in quantities that were
too small to be quantified. Ethylene was also notably absent from reaction products for all the catalysts, so
assuming it is formed during ethanol dehydration, it must be quickly hydrogenated to ethane.
ACS Paragon Plus Environment
Page 19 of 31
1
2
3
4
5
6
7
8
9
10
11
12
13
14
15
16
17
18
19
20
21
22
23
24
25
26
27
28
29
30
31
32
33
34
35
36
37
38
39
40
41
42
43
44
45
46
47
48
49
50
51
52
53
54
55
56
57
58
59
60
ACS Catalysis
C3+ alcohol selectivity on Mo/K/MMO-5,9 surpasses that of Mo/K/MMO-5,3, which is expected and
consistent with several studies that have quantified the effects of increasing K loadings on MoS2
catalysts.[50,101,102] The interpretations of these studies (titration of acid sites and partial suppression of CO
dissociation) do not however explain why the C3+ alcohol selectivity of Mo/K/MMO-5,3 is greater than
that of Mo/K/MMO-15,9. In having a greater K loading and the same Mo:K ratio, the latter catalyst
should have a more basic surface and therefore increasingly favor alcohol formation. The Mo/K/MMO5,x catalyst must then have a character not directly related to K loading that also favors linear, primary
alcohol formation over the formation of other oxygenates.
C3+ alcohol productivity ( gOH/gMo/hr) is reported in Table S2 and shows a decrease with increasing CO
conversion for the Mo/K/MMO-5,x catalysts but remains relatively constant for Mo/K/MMO-15,9.
Additionally, C3+ alcohol productivity for the Mo/K/MMO-5,x catalysts is more than twice that over
Mo/K/MMO-15,9 at low conversions. These outcomes again suggest a fundamental difference in
character between the catalysts that cannot be explained by differences in K loading alone.
Rather, this character is likely related to two key differences in catalyst structure: (i) variations in the
proportion of surface-exposed MMO, Mo, and K and (ii) differences in MoS2 structure such as the
stacking of the MoS2 domains as reflected in XRD and STEM. Based on the data presented above, it is
unknown what changes in selectivity either of these cases could bring about. Therefore, additional
experiments were undertaken.
Case (i) would result if the MMO support served to promote different reaction pathways than K over a
sulfide catalyst. Several papers in the literature show that MMO or MgO, a component in MMO, can
couple alcohols in conjunction with other metals[103-106] effectively making 1-propanol from methanol and
ethanol, 1-butanol from 2 ethanols, and 2-methyl-propanol from 1-propanol and methanol. With that
ACS Paragon Plus Environment
ACS Catalysis
1
2
3
4
5
6
7
8
9
10
11
12
13
14
15
16
17
18
19
20
21
22
23
24
25
26
27
28
29
30
31
32
33
34
35
36
37
38
39
40
41
42
43
44
45
46
47
48
49
50
51
52
53
54
55
56
57
58
59
60
Page 20 of 31
functionality, MMO could potentially perform a similar reaction over supported MoS2 catalysts with or
without the promotion of K. Alternatively, the interface of the MoS2 domains with the MMO support
could be important in the spillover and coupling of reactive intermediates between the various domains.
Simply put, if MMO or MMO/Mo/K surfaces favor coupling of alcohols compared to MoS2/K domains, a
high MMO:Mo ratio would result in a bias towards C3+ alcohols not observed in the reaction of more
conventional bulk MoS2/K, and in parallel, a supported catalyst with high Mo content as well.
Potential effects of case (ii) are more ambiguous. Several theoretical and experimental studies have linked
differing edge geometries and coordinatively unsaturated site (CUS) numbers and spacings of the MoS2 to
active sites for CO and/or H2 adsorption on MoS2.[72,107-112] Thus, in addition to different CUS site
structures, it is possible that different size MoS2 domains could yield different active site concentrations
that then lead to modified selectivities for higher alcohols. However, the precise effect of these different
structures in the context of CO hydrogenation over supported MoS2 is yet unknown. The following
section provides an experimental pathway for deconvoluting case (i) and case (ii).
ACS Paragon Plus Environment
MeOH % Selectivity (CO2 free)
60
a. Mo/K/MMO-5,3
b. Mo/K/MMO-15,9
c. Mo/K/MMO-5,9
50
40
30
20
10
0
0
5
10
15
60
a. Mo/K/MMO-5,3
b. Mo/K/MMO-15,9
c. Mo/K/MMO-5,9
50
40
30
20
10
0
0
5
Conversion (% CO)
10
a. Mo/K/MMO-5,3
b. Mo/K/MMO-15,9
c. Mo/K/MMO-5,9
0
5
10
15
1-ButOH % Selectivity (CO2 free)
1-PrOH % Selectivity (CO2 free)
20
0
10
15
Conversion (% CO)
30
30
a. Mo/K/MMO-5,3
b. Mo/K/MMO-15,9
c. Mo/K/MMO-5,9
20
10
0
0
5
10
15
Conversion (% CO)
Conversion (% CO)
30
Ethane % Selectivity (CO2 free)
Figure 7. Alcohol selectivity (CO2-free) vs. CO conversion for C1 to C4 alcohols over MMO
supported catalysts, Mo/K/MMO-5,3, Mo/K/MMO-15,9, and Mo/K/MMO-5,9.
Methane % Selectivity (CO2 free)
1
2
3
4
5
6
7
8
9
10
11
12
13
14
15
16
17
18
19
20
21
22
23
24
25
26
27
28
29
30
31
32
33
34
35
36
37
38
39
40
41
42
43
44
45
46
47
48
49
50
51
52
53
54
55
56
57
58
59
60
ACS Catalysis
EtOH % Selectivity (CO2 free)
Page 21 of 31
a. Mo/K/MMO-5,3
b. Mo/K/MMO-15,9
c. Mo/K/MMO-5,9
25
20
15
10
5
0
0
5
10
15
15
a. Mo/K/MMO-5,3
b. Mo/K/MMO-15,9
c. Mo/K/MMO-5,9
10
5
0
0
Conversion (% CO)
5
10
15
Conversion (% CO)
Figure 8. Alcohol selectivity (CO2-free) vs. CO conversion for methane and ethane over
Mo/K/MMO-5,3, Mo/K/MMO-15,9, and Mo/K/MMO-5,9.
ACS Paragon Plus Environment
ACS Catalysis
1
2
3
4
5
6
7
8
9
10
11
12
13
14
15
16
17
18
19
20
21
22
23
24
25
26
27
28
29
30
31
32
33
34
35
36
37
38
39
40
41
42
43
44
45
46
47
48
49
50
51
52
53
54
55
56
57
58
59
60
Page 22 of 31
Role of MMO in Catalysis
To gain insight into case (i), namely the functionality of MMO, bare MMO was combined with Mo in
three different fashions for follow-up experiments. In the first experiment, sieved Mo/K/MMO-15,9
particles were placed upstream of a separate bed of identically sized bare MMO particles such that the
total Mo, K, and MMO amounts were the same as in Mo/K/MMO-5,3 reaction (but with differing size
and distribution of Mo and K domains). This reaction is referred to as Mo/K/MMO-15,9-MMOs. Figure
9d shows a schematic description of the catalyst bed for this experiment in addition to several others that
will be discussed next.
For the second experiment, a mortar and pestle was used to grind the oxide precatalyst Mo/K/MMO-15,9
with bare MMO such that the total elemental composition of the resultant catalyst also matched that of
Mo/K/MMO-5,3. This catalyst is referred to as Mo/K/MMO-15,9-MMOg (Figure 9e). The XRD patterns
and BET surface area data of the oxide precatalyst and sulfided, reacted materials for these two cases are
shown in Figure S7 and Table S1, respectively, in the supporting information. Notably, the XRD pattern
for the Mo/K/MMO-15,9-MMOg precatalyst contained diffraction lines characteristic of molybdenum
(VI) oxide and potassium molybdate at 27 ° and 32 ° respectively, which were similar in magnitude to
those of Mo/K/MMO-15,9.
However, once sulfided and reacted, Mo/K/MMO-15,9-MMOg then showed XRD lines more similar to
those of Mo/K/MMO-5,3 – a short broad peak (MoS2) at 33 ° and two peaks (MgO) of much greater
magnitude at 44 ° and 64 °. This result suggests that initial oxide domain size does not in fact greatly
affect sulfide domain size once the catalyst is sulfided. In other words, under sulfidation conditions, the
Mo species can migrate around the support to a significant extent, to the point where the Mo/K/MMO15,9-MMOg catalyst appears to have sulfide domains that are similar to the Mo/K/MMO-5,3 catalyst by
XRD despite very different preparation conditions. An extremely small peak at 14 ° correlating with the
ACS Paragon Plus Environment
Page 23 of 31
1
2
3
4
5
6
7
8
9
10
11
12
13
14
15
16
17
18
19
20
21
22
23
24
25
26
27
28
29
30
31
32
33
34
35
36
37
38
39
40
41
42
43
44
45
46
47
48
49
50
51
52
53
54
55
56
57
58
59
60
ACS Catalysis
MoS2 [002] plane can also be observed, indicating slightly more order in the stacking structure than in
Mo/K/MMO-5,3. The overall Mo to MMO ratio in the precatalyst seems to play a dominant role in
establishing the size of the MoS2 domains.
Bulk MoS2 (synthesized as described in the previous study[64]) was ground with bare MMO and K2CO3 to
make the catalyst for the third and final experiment exploring the role of MMO, denoted as Mo/K-bulkMMOg (Figure 9f). Despite the different Mo precursor, this catalyst had the same composition as the
previous two – 85 % MMO, 5 % Mo, and 3 % K. The XRD pattern for this catalyst shown in Figure S7 is
similar to that of the sulfide form of Mo/K/MMO-15,9-MMOg, differing primarily in the magnitude of
the peak at 14 °, indicating a level of Mo-S stacking more closely resembling that of the original bulk
(unsupported) catalyst.
Figure 9: Catalyst bed schematics for Figures 7, 8, 10, and 11 showing various combinations of Mo,
K, and MMO. Cases a. and b. represent the base cases for the study. Case c. (not shown) represents
the same catalyst as case a. but with a higher K content. Case d. is the combination of catalyst b.
and bare MMO in series such that the final overall bed composition is the same as case a. Case e.
represents the same materials as case d. but ground into a homogeneous mixture. Case f. was
prepared similarly to e. but bulk MoS2 was used as the Mo source instead of Mo/K/MMO-15,9.
Cases a., d., e., and f. represent catalyst beds with the same total amounts of MoS2, K2CO3, and
MMO in the bed.
ACS Paragon Plus Environment
ACS Catalysis
1
2
3
4
5
6
7
8
9
10
11
12
13
14
15
16
17
18
19
20
21
22
23
24
25
26
27
28
29
30
31
32
33
34
35
36
37
38
39
40
41
42
43
44
45
46
47
48
49
50
51
52
53
54
55
56
57
58
59
60
Page 24 of 31
Reactivity results for Mo/K/MMO-15,9-MMOs, Mo/K/MMO-15,9-MMOg, and Mo/K-bulk-MMOg are
combined with those from Mo/K/MMO-5,3 and Mo/K/MMO-15,9 and shown in Figures 10 and 11 along
with Table S2 in the supporting information. The trends of increasing methane and lowered methanol
with increasing conversion can be observed for all five cases, which further strengthens the conclusions
that methanol is a primary product of the reaction and is consumed via secondary reactions.[64]
The selectivity trends for the catalysts Mo/K/MMO-5,3, Mo/K/MMO-15,9-MMOg, and Mo/K-bulkMMOg are shown to be virtually identical, despite the fact that the catalysts were generated via different
synthesis routes (Mo/K/MMO-5,3 from a homogeneous mix of MMO, Mo, and K2CO3 with small MoOx
domains (Figure 9a); Mo/K/MMO-15,9-MMOg from the grinding of Mo/K/MMO-15,9, which has large
MoOx domains, and bare MMO (Figure 9e); and bulk MoS2, K2CO3, and bare MMO (Figure 9f)).
Specifically, the unusual trends associated with Mo/K/MMO-5,3 of lowered ethanol selectivity with
increasing conversion and relatively high ethane selectivity were observed for Mo/K/MMO-15,9-MMOg
and Mo/K-bulk-MMOg, but not for Mo/K/MMO-15,9-MMOs.
The fact that the low methanol selectivity observed over Mo/K/MMO-5,3[64] was not replicated by the
Mo/K/MMO-15,9-MMOs experiment (with a downstream bare MMO bed) shows that the low methanol
and high C3+OH selectivity are not simply due to secondary reactions independently facilitated by bare
MMO. If the low methanol and elevated higher alcohol selectivities over Mo/K/MMO-5,3 were
associated with secondary reactions, they were likely not associated with conversion of stable products
such as methanol into higher alcohols via alcohol coupling pathways (e.g. methanol + ethanol to give 1propanol) over the bare, K-free support. These selectivity phenomena are likely instead related to
reactions that occur only at an MMO-Mo-K interface or on MMO/K domains; both possibilities could
result in adsorbed intermediates reacting to give the observed product distributions.
ACS Paragon Plus Environment