DSpace at VNU: Effect of Neodymium and Transition Metals Co-doped on Structural, Optical and Magnetic Properties of BiFeO3 Materials
Bạn đang xem bản rút gọn của tài liệu. Xem và tải ngay bản đầy đủ của tài liệu tại đây (700.07 KB, 7 trang )
VNU Journal of Science: Mathematics – Physics, Vol. 31, No. 3 (2015) 63-69
Effect of Neodymium and Transition Metals Co-doped on
Structural, Optical and Magnetic Properties of BiFeO3 Materials
Dao Viet Thang1,2,*, Du Thi Xuan Thao2, Le Thi Mai Oanh1, Nguyen Van Minh1
1
Center for Nano science and Technology, Hanoi National University of Education,
136 Xuan Thuy, Hanoi, Vietnam
2
Department of Physics, Hanoi University of Mining and Geology,
Duc Thang, Bac Tu Liem, Hanoi, Vietnam
Received 18 May 2015
Revised 01 June 2015; Accepted 24 August 2015
Abstract: Structural, optical and magnetic properties of BiFeO3 and Bi0.9Nd0.1Fe0.95TM0.05O3 (TM
= Ni, Co) polycrystallines prepared by sol–gel method have been investigated. X-ray diffraction
(XRD) patterns reveal that all samples crystalize in rhombohedrally distorted perovskite structure
belonging to R3C space group. The analysis results of both XRD and Raman scattering show the
increase of lattice distortion with the co-replacing of Nd and TM ions into A and B sites
respectively. All samples exhibit a weak ferromagnetic behavior at room temperature with the
enhancement of the magnetization in Nd and TM co-doped samples.
Keywords: Raman, co-doped, magnetization, BFO.
1. Introduction∗
Due to the simultaneous coexistence of ferroelectric, ferromagnetic and ferroeleastic phase,
multiferroics materials recently are interested in many research groups all over the world. This kind
of materials promises the application in novel devices such as spintronics, information storage,
sensing and actuator [1, 2]. Among the multiferroics, BiFeO3 (BFO) has been regarded as one of the
most widely studied single-phase multiferroics showing multiferroics properties at room-temperature,
TC at 1103 K and TN at 643 K [3, 4]. BFO is crystallized in a rhombohedrally distorted perovskite
ABO3 structure belonging to R3C space group. The stereochemical activity of Bi 6s2 lone-pair
electrons, hybridized with both the empty 6p0 orbitals of Bi3+ ion and the 2p6 states of O2- ion is
responsible for non-centrosymmetric ferroelectric order along the <111> direction of the cubic
perovskite-like lattice [3, 5, 6]. On the other hand, the magnetic structure of BFO shows G-type antiferromagnetism order modulated by a cycloid spin below the Néel temperature [6, 7]. However, bulk
_______
∗
Corresponding author. Tel.: 84-:985811377
Email:
63
64
D.V. Thang et al. / VNU Journal of Science: Mathematics – Physics, Vol. 31, No. 3 (2015) 63-69
BFO is not suitable for device applications because the appearance of impurity phases in bulk sample
leading to a high leakage current, a weak ferromagnetic ordering, and a wide range change of
transition temperature [3, 8, 6]. In order to solve these problems, a chemical modification doping rare
earth or transition metals ions into A- or B-sites of the perovskite BFO is strongly recommended [9,
10]. Many works reported the enhancement of electrical and magnetical properties of BFO material.
Which the A-sites are replaced by trivalent rare earth ions (Nd3+, La3+, Ho3+, Sm3+, Eu3+, Gd3+) [11-16,
10, 17] or divalent metal ions (Ba2+, Sr2+, Ca2+, Pb2+) [18-21] and B-sites are substituted by some
transition metal cations (Zr4+, Nb5+, Ni2+ or Co2+) [22-26]. The magnetoelectric effect in these
materials was assigned to the coupling between ferroelectric order resulting from electron lone pair of
A-site Bi3+ ions and the ferromagnetic order resulting from the substitution of cation Fe3+ into B-site [27].
In this study, neodymium and transition metals co-doped BFO samples were synthesized by solgel method. The influence of neodymium and transition metals co-doped on the microstructures,
surface morphology, magnetic and optical properties of materials were investigated.
2. Experimental
BiFeO3
(BFO),
Bi0.9Nd0.1FeO3
(BNFO),
Bi0.9Nd0.1Fe0.95Ni0.05O3
(BNFNO)
and
Bi0.9Nd0.1Fe0.95Co0.05O3 (BNFCO) nanocrystals were prepared by sol–gel method. For preparation of
precursor solutions, Nd(NO3)3.6H2O, Bi(NO3)3.5H2O, Fe(NO3)3.9H2O, Ni(NO3)2.6H2O, and
Co(NO3)2.6H2O were used as starting materials. In the first step, these chemicals were mixed in
correct weight contribution and an aqueous solution of citric acid and ethylence glycol was prepared in
distilled water. Then, salt of iron nitrate, bismuth nitrate, neodymium nitrate and nickel(II) nitrate (or
cobalt(II) nitrate) were added in turn with constant stirring at temperature 50 – 60 °C to avoid
precipitation and obtain a homogeneous solution. Solution of citric acid and ethylene glycol was
dropped into the solution with the molar ratio of citric acid/ethylene glycol of 70/30. Then, water in
solution was evaporated at temperatures 100 °C to obtain colloidal gel. Finally, the gel was heat treated at
temperature of 800 °C for 7 hours to remove organics in the samples and crystalize BiFeO3 nanocrystal.
The samples were characterized by different techniques: X-ray diffraction pattern using a D5005
diffractometer with CuKα radiation and with 2θ varied in the range of 20 – 70° at a step of 0.03°.
Raman scattering measurements were performed by Jobin Yvon T64000 spectrometer equipped with
wavelength 514.5 nm of Ar laser. The surface morphology was explored by scanning electron
microscopy. The optical and electrical properties were determined by the absorption spectra using a
Jasco V670 UV-VIS photospectrometer. Vibrating sample magnetometer was used to measure
magnetic properties of the samples
3. Results and discussion
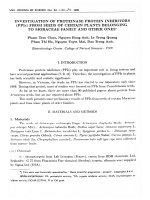
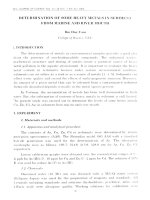
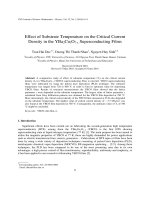
Fig. 1a shows XRD patterns of the BFO, BNFO, BNFNO and BNFCO samples. Impurities phases
are not detected in BFO and BNFO samples but they are found in BNFNO and BNFCO samples. BFO
65
D.V. Thang et al. / VNU Journal of Science: Mathematics – Physics, Vol. 31, No. 3 (2015) 63-69
5.584
(b)
14.100
c
Å
param eter ( )
(116)
(122)
(018)
(300)
(110)
(104)
Bi25FeO40
Bi2Ni2O5
(024)
(006)
(202)
(104)
(110)
(a)
BFO
BNFO
BNFNO
5.576
14.025
a
5.568
13.950
5.560
13.875
param eter ( )
intensity (a.u.)
(012)
sample shows the strong separation of (104)-(110) diffraction peak couple (the small Figure). For codoped samples, these peaks shift closer together and tend to merge into a single peak. The ratio of
diffraction intensity between (104) and (110) peaks decreases rapidly from 1.04 to 0.82.
Moreover, almost of XRD peaks shift toward the higher value of 2θ angle. These changes in XRD
patterns indicate that the lattice parameters of the BNFO, BNFNO and BNFCO samples are altered by
doping especially in co-doping samples. The values of lattice parameters were calculated by UnitCell
software and displayed in Fig. 1b. This change could be attributed to the difference of ion radius
between the host lattice ions Bi3+ and Fe3+ to replacing ions Nd3+ and Ni2+ (Co2+) respectively [27].
Å
5.552
13.800
BNFCO
20
40
60
5.544
32
BFO
BNFO
2−theta (degree)
BNFNO
BFCO
Samples
E- 7
E- 2
E- 5
E- 6
A1- 2
A1- 3
BFO
BNFNO
E- 3
E- 1
Intensity (a.u.)
A1- 1
Fig. 1. XRD patterns of the BFO, BNFO, BNFNO and BNFCO powders.
A4
E8 E9
500
2A4 2E8
1000
BNFCO
2E9
1500
Raman shift (cm-1)
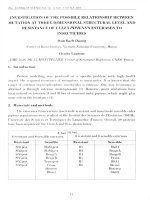
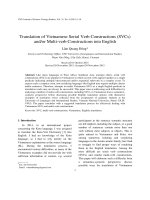
Fig. 2. Raman spectra of BFO, BNFNO and BNFCO powders at room temperature.
The structural transformation of BNFNO and BNFCO materials are also observed in Raman
spectra. Fig. 2 shows the Raman spectra of BFO, BNFNO, and BNFCO samples. According to group
theory, there are 13 Raman-active modes predicted for the rhombohedrally distorted space group R3C,
which can be summarized using the following irreducible representation: Γ = 4A1 + 9E, including A11, A1-2, A1-3 and A1-4 modes at 136, 168, 212 and 425 cm-1, respectively, and E modes at 71, 98, 275,
66
D.V. Thang et al. / VNU Journal of Science: Mathematics – Physics, Vol. 31, No. 3 (2015) 63-69
305, 335, 363, 456, 549 and 597 cm-1 [28, 29]. As shown in Fig. 2, the observed Raman spectral
containing 11 peaks of pristine sample is in good agreement with the results reported by Yuan et al.
[29] and Singh et al. [28]. Three intense peaks at 132, 169 and 215 cm-1 are assigned to A1-1, A1-2 and
A1-3 modes, respectively. The other eight peaks at 96, 270, 338, 368, 436, 470, 544 and 605 cm-1 are
assigned to E-1, E-2, E-5, E-6, A1-4, E-7, E-8 and E-9 modes, respectively. It is interesting to note that
the E-3 modes at 293 cm-1 is detected in BNFNO sample which is not observed in the BFO and
BNFCO samples. Although the result is not reported, this peak may cause of from the impurity
Bi2Ni2O5 phase (it is suitable with RXD result in Fig.1). However, it needs evidences to clarify this
issue. For BFO sample, E-2 mode at 270 cm-1 and A1 modes at 132, 169 and 215 cm-1 in the low
frequency range are associated with Bi-O vibration. High frequency E modes correspond to Fe-O
vibration [29, 30]. Co-doped samples (BNFNO and BNFCO) exhibit the shift of three Raman modes
A1-1, A1-2 and A1-3 to higher frequency. The changes of both intensity and position of these peaks
indirectly indicates the substitution of Nd3+ ions for Bi3+ ions [7]. Moreover, the shift of E-3 and E-8
modes to higher frequency reveals the increase of local lattice distortion and the formation of oxygen
vacancy due to substitution of the Ni, Co dopant at the B site [7, 31]. Compressive stress of structural
distortion due to co-doping. The appearance of a prominent additional band around ∼ 1000 – 1350
cm−1 in co-doped samples can be assigned to the two-phonons Raman scattering in BFO labeled as
2A4, 2E8 and 2E9 [30]. The strong contribution of these two-phonon bands to the total Raman spectrum
has been attributed to a resonant enhancement with the intrinsic absorption edge in BFO [32, 33].
(b)
(a)
200 nm
200 nm
(d)
(c)
200 nm
200 nm
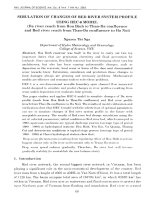
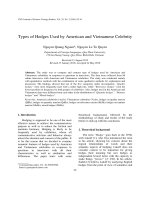
Fig. 3. (a)-(d) SEM images of the BFO, BNFO, BNFNO and BNFCO materials, respectively.
67
D.V. Thang et al. / VNU Journal of Science: Mathematics – Physics, Vol. 31, No. 3 (2015) 63-69
Fig. 3 presents SEM images of four study samples which exhibit the sphere particle grain shape.
The particles size are evaluated varying from 40 to 100 nm for BFO sample. The particle size
generally decreases in doped and co-doped samples comparing to un-doped BFO sample. This can be
explained by the replacing of dopant ions into BFO lattice crystal. This causes the crystal distortion
and limits the growth of crystal.
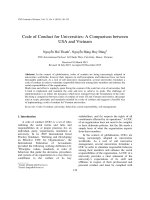
Fig. 4a shows UV–Vis absorption spectrum of BFO, BNFO, BNFNO and BNFCO samples (insert
figure is the plots of (αhν)2 versus (hν) for the BFO sample). The band gap values obtained by WoodTauc method for BFO, BNFO, BNFNO and BNFCO samples are 2.03, 2.00, 1.97, and 1.85 eV,
respectively (in Fig. 4b). The valence band of BFO material are well known forming by 3d-Fe and 2pO states. The conduction band is composed of 3d-Fe and 6p-Bi states. The appearance of second
absorbance at 700 nm can be assigned to the transition of electron from t2g bands to eg bands of Fe3+
ions [34, 35]. The slight decrease of optical band gap in doped and co-doped samples can be explained
by the appearance of Nd impurity band in the energy band gap. Fig. 4a also exhibit a weak absorption
peak at 750 nm for doped and co-doped BFO samples which can be assigned to electron transitions
from the ground state 4I9/2 to the excited levels (4F7/2 + 4S3/2) of Nd3+ ion [36].
2.05
(b)
2.00
BNFCO
BFO
BNFNO
BFO
Eg (eV)
BNFO
1.95
1.90
22
(αhν) (a.u.)
Intensity (a.u.)
(a)
1.85
1.5
2.0
2.5
3.0
hν (eV)
400
500
600
BFO
700
BNFO
BNFNO
BNFCO
Samples
Wavelength (nm)
2
Magnetic moment (emu/g)
Magnetization (emu/g)
Fig. 4. (a) UV–Vis absorption spectrum of the BFO, BNFO, BNFNO and BNFCO samples. The insert shows the
plot of (αhv)2 as a function of photon energy of the BFO. (b) optical band gap of the samples, respectively.
2.5
2.0
MS
Mr
1.5
1.0
0.5
0.0
BFO
BNFO
BNFNiO BNFCoO
Materials
0
BFO
BNFO
BNFNO
BNFCO
-2
-7000
0
7000
Magnetic field (Oe)
Fig. 5. Magnetic-field dependence of the magnetization for BFO, BNFO, BNFNO and BNFCO materials.
68
D.V. Thang et al. / VNU Journal of Science: Mathematics – Physics, Vol. 31, No. 3 (2015) 63-69
Fig. 5 presents the magnetic hysteresis (M‐H) loops of the BFO, BNFO, BNFNO and BNFCO
samples under the maximum field of 10 kOe at room temperature. It is clear that all samples display a
weak ferromagnetic behavior. The magnetizations sharply increase in co-doped BFO samples
comparing to un-doped and Nd-doped BFO samples. The calculated saturation magnetization values
of the BFO, BNFO, BNFNO and BNFCO samples are 0.155, 0.211, 2.262 and 1.808 emu/g,
respectively. Yoo et al. [7] reported that the enhanced magnetic moment of co-doped samples can be
assigned to the transition of magnetic structure from incommensurate cycloidal spiral spin structure to
G-type collinear antiferromagnetic structure.
4. Conclusions
The doped, co-doped and un-doped BiFeO3 materials were prepared by sol–gel method. The
replacement of Nd into A-sites and Co (Ni) into B-site were observed through the shift of XRD peaks
resulting the change of lattice parameters and the shift of Raman peaks which related to the vibration
of replacing sites. The optical band gap changes with the co-substitution of rare earth and transition
metal into BFO crystal lattice. Weak ferromagnetism was observed in all samples with the sharply
increase of saturation magnetization values HC in co-doped BFO samples comparing to un-doped BFO
and Nd-doped BFO samples.
Acknowledgments
This work was supported by National Foundation of Science and Technology of Vietnam
(NAFOSTED) with code 103.02.2014.21. The authors would like to thank the subject science and
technology of University of Mining and Geology (code T15-08).
Reference
[1]
[2]
[3]
[4]
[5]
[6]
[7]
[8]
[9]
[10]
Eerenstein W., N.D. Mathur, and J.F. Scott, Nature. 442, (2006) 759-765.
Tokura Y., J. Magn. Magn. Mater. 310, (2007) 1145–1150.
F. Kubel and H. Schmid, Acta Cryst. B46, (1990) 698-702
X. Qi, J. Dho, R. Tomov, M. G. Blamire, and J.L.M. Driscoll, Appl. Phys. Lett. 86, (2005) 062903.
P. Ravindran, R. Vidya, A. Kjekshus, H. Fjellvåg, and O. Eriksson, Phys. Rev. B 74, (2006) 224412.
X.J. Xi, S.Y. Wang, W.F. Liu, H.J. Wang, Feng Guo, Xu Wang, J. Gao, and D.J. Li, J. Mag. Mag. Mater. 355,
(2014) 259–264.
Y.J. Yoo, J.S. Hwang, Y.P. Lee, J.S. Parkb, J.Y. Rhee, J.-H. Kang, K.W. Lee, B.W. Lee, and M.S. Seo, J. Magn.
Magn. Mater. 374, (2015) 669–675.
B. Ruette, S. Zvyagin, A. P. Pyatakov, A. Bush, J. F. Li, V. I. Belotelov, A. K. Zvezdin, and D. Viehland, Phys.
Rev. B. 69, (2004) 064114.
Lazenka V.V., A.F. Ravinski, I.I. Makoed, J. Vanacken, G. Zhang, and V.V. Moshchalkov, J. Appl. Phys.
111(12), (2012) 123916.
K. Chakrabarti, K. Das, B. Sarkar, and S.K. De, J. Appl. Phys. 110, (2011) 103905.
D.V. Thang et al. / VNU Journal of Science: Mathematics – Physics, Vol. 31, No. 3 (2015) 63-69
69
[11] M.S.B. Darby, D.V. Karpinsky, J. Pokorny, S. Guerin, A.L. Kholkin, S. Miao, B.E. Hayden, and I.M. Reaney,
Thin Solid Films. 531, (2013) 56-60.
[12] G. L. Yuan, Siu Wing Or, J. M. Liu, and Z.G. Liu, Appl. Phys. Lett. 89, (2006) 052905
[13] Sen K., S. Thakur, K. Singh, A. Gautam, and M. Singh, Mater. Lett. 65(12), (2011) 1963-1965.
[14] Raoa T.D., T. Karthika, A. Srinivasc, and S. Asthanaa, Solid State Commun. 152(23), (2012) 2071–2077.
[15] Xu X., T. Guoqiang, R. Huijun, and X. Ao, Ceram. Int. 39(6), (2013) 6223-6228.
[16] Minh N.V. and D.V. Thang, J. Nonlinear Opt. Phys. 19(2), (2010) 247–254.
[17] Lotey G.S. and N.K. Verma, Chem. Phys. Lett. 574, (2013) 71-77.
[18] Chauhan S., M. Arora, P.C. Sati, S. Chhoker, S.C. Katyal, and M. Kumar, Ceram. Int. 39(6), (2013) 6399-6405.
[19] Wang L.Y., D.H. Wang, H.B. Huang, Z.D. Han, Q.Q. Cao, B.X. Gu, and Y.W. Du, J. Alloy. Compd. 469(1-2),
(2009) 1-3.
[20] Tirupathi P. and A. Chandra, J. Alloy. Compd. 564, (2013) 151-157.
[21] R. Mazumder and A.Sen, J. Alloy. Compd. 457, (2009) 577–580.
[22] Xie J., Y. Liu, C. Feng, and X. Pan, Mater. Lett. 96, (2013) 143-145.
[23] Jun Y.-K., W.-T. Moon, C.-M. Chang, H.-S. Kim, H.S. Ryu, J.W. Kim, K.H. Kim, and S.-H. Hong, Solid State
Commun. 135(1-2), (2005) 133-137.
[24] Wen Z., G. Hu, S. Fan, C. Yang, W. Wu, Y. Zhou, X. Chen, and S. Cui, Thin Solid Films. 517(16), (2009) 44974501.
[25] Y.R. Dai, Qingyu Xun, Xiaohong Zheng, Shijun Yuan, Ya Zhai, and M. Xu, Physica B 407, (2012) 560–563.
[26] Lin Peng, Hongmei Deng, Jianjun Tian, Qing Ren, Cheng Peng, Zhipeng Huang, Pingxiong Yang, and J. Chu,
Appl. Surf. Sci. 268, (2013) 146– 150.
[27] K. Chakrabarti, K. Das, B. Sarkar, S. Ghosh, and S.K. De, Appl. Phys. Lett. 101, (2012) 042401.
[28] Singh MK, Jang HM, Ryu S, and J. MH, Appl. Phys. Lett. 88, (2006) 042907-042907-3.
[29] G. L. Yuan, S. W. Or, and H.L. Chan, J. Appl. Phys. 101, (2007) 064101.
[30] Xia Yan, Guoqiang Tann, Wenlong Liu, Huijun Ren, and A. Xia, Ceram. Int. 41, (2015) 3202–3207.
[31] Hermet P., M. Goffinet, J. Kreisel, and P. Ghosez, Phys. Rev. B. 75(22), (2007).
[32] Ramirez M.O., M. Krishnamurthi, S. Denev, A. Kumar, S.-Y. Yang, Y.-H. Chu, E. Saiz, J. Seidel, A.P. Pyatakov,
A. Bush, D. Viehland, J. Orenstein, R. Ramesh, and V. Gopalan, Appl. Phys. Lett. 92(2), (2008) 022511.
[33] Minh N.V. and D.V. Thang, J. Alloy. Compd. 505(2), (2010) 619-622.
[34] Liu Z., Y. Qi, and C. Lu, J. Mater. Sci.-Mater. El. 21(4), (2009) 380-384.
[35] Thang; D.V., D.T.X. Thao;, and N.V. Minh, J. Sci. Tech. 52(3C), (2014).
[36] Bagayev S.N., V.V. Osipov, M.G. Ivanov, V.V. Platonov, A.N. Orlov, A.V. Spirina, S.M. Vatnik, and A.S.
Kaygorodov, Laser Phys. 19(5), (2009) 1165-1168.