Changing human landscape interactions after development of tourism in the northern Vietnamese Highlands
Bạn đang xem bản rút gọn của tài liệu. Xem và tải ngay bản đầy đủ của tài liệu tại đây (2.88 MB, 10 trang )
Anthropocene 5 (2014) 42–51
Contents lists available at ScienceDirect
Anthropocene
journal homepage: www.elsevier.com/locate/ancene
Changing human–landscape interactions after development of
tourism in the northern Vietnamese Highlands
Huong Thi Thu Hoang a,b,d,*, Veerle Vanacker a, Anton Van Rompaey b,
Kim Chi Vu c, An Thinh Nguyen d
a
Earth and Life Institute, Georges Lemaıˆtre Center for Earth and Climate Research, Universite´ Catholique de Louvain, Place L. Pasteur 3, Bte L4.03.08,
Louvain-la-Neuve, Belgium
Division of Geography, Department of Earth and Environmental Sciences, K.U. Leuven, Celestijnenlaan 200 E, bus 2409, B-3001 Heverlee, Belgium
c
Institute of Vietnamese studies and Development sciences, VNU, 336 Nguyen Trai street, Thanh Xuan district, Hanoi, Viet Nam
d
Faculty of Geography, Hanoi University of Sciences, VNU, 334 Nguyen Trai street, Thanh Xuan district, Hanoi, Viet Nam
b
A R T I C L E I N F O
A B S T R A C T
Article history:
Received 16 January 2014
Received in revised form 7 August 2014
Accepted 27 August 2014
Available online 6 September 2014
In developing countries in tropical regions, the poorest segments of the rural population often rely on
forests for survival. The creation of off-farm jobs in the tourism sector, construction or manufacturing
has been suggested as a potential way to alleviate pressure on tropical forests. Using Sa Pa district as a
case study, we evaluated the coupling of human and forest dynamics. The district was opened for
international tourism in 1993, which had a large impact on daily life in Sa Pa town and its surrounding
communities. Analysis of land cover change for the period 1993–2014, using high-resolution satellite
images from three timeperiods and an analysis of covariance, detected possible associations between
forest cover change and socio-economic, cultural and biophysical variables at the village level. Between
1993 and 2006, Sa Pa district experienced a net decrease of forest in favour of arable land, while this
trend was reversed in the period 2006–2014. However, trends at district level mask substantial
heterogeneity at village level. Results show that deforestation is considerably lower in villages that are
strongly involved in tourism activities. Marginal agricultural fields with low productivity are also
preferentially abandoned. Because of diversification in alternative economic activities, rural households
may become less dependent on natural resources and agricultural products for their survival. These
results suggest that the creation of off-farm income sources activities can be a driver of shifts in human–
environment interactions, as new livelihood strategies can offset the pressure on forested land.
ß 2014 Elsevier Ltd. All rights reserved.
Keywords:
Coupled human–environmental changes
Tourism development
Ethnicity
Land use pressure
Forest transition
Northern Vietnam
Introduction
Many tropical areas worldwide are characterized by high rates
of deforestation. According to Lambin and Geist (2003), one-third
of the humid forest in Southeast Asia was cleared between the
beginning of the twentieth century and World War II. The decline
in forest cover continued after the 1950s. Presently, forests cover
46–48% of the land surface in Southeast Asia, but less than 10% of
the primary tropical rainforest is preserved (FAO, 2010; Dong et al.,
2012). Recent deforestation rates for this region are assessed at
1.5% per year (FAO, 2006; Grainger, 2008). Nevertheless, forest
* Corresponding author at: Earth and Life Institute, Georges Lemaıˆtre Center for
Earth and Climate Research, Universite´ Catholique de Louvain, Place L. Pasteur 3, Bte
L4.03.08, Louvain-la-Neuve, Belgium. Tel.: +32 494694385; fax: +32 16322980.
E-mail addresses: ,
(H.T.T. Hoang).
/>2213-3054/ß 2014 Elsevier Ltd. All rights reserved.
dynamics are diverse. In some countries, such as the Philippines or
Cambodia, the deforestation rate is much higher than the
Southeast Asian average; while in other countries, such as
Vietnam, the start of a forest transition is reported (FAO, 2006;
Meyfroidt and Lambin, 2008b). Forest transition is defined by a
reversal of the trend of deforestation so that net reforestation
occurs (Meyfroidt and Lambin, 2008b). Causes of tropical
deforestation and forest transition are still poorly understood,
and are the scope of ongoing research programmes. Deforestation
and reforestation patterns are linked to multiple biophysical and
socio-economic variables such as ethnicity (Castella et al., 2005; Vu
et al., 2013), land tenure (Mottet et al., 2006), increasing demand
for food production (Zhang, 2000; Geist and Lambin, 2001; Casse
et al., 2004; Meyfroidt and Lambin, 2008a), poverty (Hobbs, 2001;
Adams et al., 2004; Dasgupta et al., 2005; Robinson, 2006; Zwane,
2007), soil fertility (Szillassi et al., 2010; Vanacker et al., 2014), and
accessibility (Koning, 2000; Castella et al., 2005; Etter et al., 2006;
Van Dessel et al., 2008).
H.T.T. Hoang et al. / Anthropocene 5 (2014) 42–51
In rural areas in developing countries, the poorest segments of
the population often rely on forests for survival (Tugault-Lafleur,
2007; Coulibaly-Lingani et al., 2009). The use of forest products
allows livelihood diversification, but may lead to forest degradation and/or net deforestation when it is not controlled (Jadin et al.,
2013). The Vietnamese mountain areas are dominantly populated
by ethnic minorities that speak local languages and still adopt a
traditional livelihood based on self-subsistence farming (Fox et al.,
2000; Tugault-Lafleur, 2007). These minorities often live in
relatively isolated conditions and do not fully participate in the
major economic transformation of Vietnam that is taking place in
the lowlands. The livelihood of these local people strongly depends
on the available natural resources because of a lack of infrastructure and education that would allow them to participated in
market-oriented activities (Frontier Vietnam, 1997). During past
decades, the scarcity of arable land coupled with population
growth has led to increasing pressure on forests (Burgess and
Barbier, 2001). Exploitation of forest resources by ethnic minorities, responding to socio-economic pressures, is generally thought
to be the cause of rapid forest degradation and/or deforestation in
Southeast Asia (Fox et al., 2000; Geist and Lambin, 2001). Studies
by Jodha (1998), Ravnborg (2003), Scherr (2000) and Jadin et al.
(2013), however, showed that deforestation is not necessarily
associated with poverty.
The creation of off-farm jobs has been suggested as a potential
way to alleviate pressures on tropical forests (Mather, 1992; Rudel
et al., 2005; Getahun et al., 2013; Teka-Belay et al., 2013). Off-farm
jobs are often created by economic development of urban areas
resulting in rural–urban migrations (Vanegas and Henry, 2012;
Vermeiren et al., 2012). Development of tourism activities in rural
areas has also been suggested as a viable means to offset pressures
on forests (Garcı´a-Martı´nez et al., 2011; Nyaupane and Poudel,
2011). When rural households can generate additional income
from tourism activities, abandonment of low-productive farmland
and spontaneous establishment of secondary forest on former
agricultural plots may result. Dong et al. (2008) supported this
hypothesis based on a case-study in Lugu lake (China). Job and
Paesler (2013) also described how the intensification of tourism in
Wasini (Kenya) has led to less intensive land use for agricultural
purposes, eventually resulting in a decrease of farmland and an
increase of the forest area. Nevertheless, this hypothesis has been
challenged by other studies suggesting that tourism activities
stimulate deforestation and forest degradation. Research by
Forsyth (1995) in northern Thailand showed that the growth of
the tourism sector did not decrease agricultural pressure on forests
and soil resources because households invested their income from
tourism in the expansion of arable fields and increasing frequency
of cultivation by hiring external labour. Additionally, Gaughan
et al. (2009) showed that the increased number of visitors to the
archaeological sites of Angkor Kwat in Cambodia accelerated
deforestation in the Angkor basin. The deforestation occurred due
to increased charcoal production for new restaurants and hotels,
which required wood products from forests. In the coastal areas of
Hainan Island (Southern China) and the Mediterranean (Turkey),
Wang and Liu (2013) and Atik et al. (2010) respectively indicated
that tourism development led to a rapid increase of the built-up area.
These activities resulted in a decrease of agricultural land and coastal
forest, causing landscape fragmentation and coastal erosion.
In this study, we evaluate possible changes in the human–
environment interactions after the development of tourism
activities. Using Sa Pa district in the northern Vietnamese
Highlands as a test case, we addressed the following questions:
First, how has forest cover changed in the period between 1993 and
2014? Second, how does forest cover change relate to tourism
development? Third, what are the likely impacts of the changing
human–landscape relationships on local livelihoods?
43
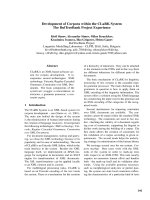
Study area
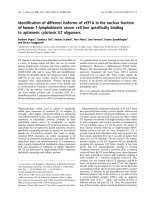
Sa Pa district is located in Northern Vietnam (Fig. 1) and covers
an area of ca. 680 km2. It has a total of 55,900 inhabitants (GSO,
2010) living in 17 communes and its administrative centre, Sa Pa
town. The district is considered as a gateway to the northern
Vietnamese Highlands. The topography is rough, with an elevation
of 180 m in the Muong Hoa valley and up to 3143 m at the Fansipan
peak (highest elevation in Vietnam, located within Hoang Lien
National Park). The major rivers are the Muong Hoa and Ta Trung
Ho River that flow in the Red River nearby Lao Cai. The region is
characterized by a sub-tropical and temperate climate with an
annual rainfall of 2763 mm (Frontier Vietnam, 1999).
Sa Pa district is home to 6 major ethnic groups: the Hmong, the
Yao, the Ta`y, the Gia´y, the Xa Pho and the Kinh. The Ta`y occupied
the fertile valleys and middle altitudes. The other ethnic groups
such as the Hmong and Yao entered Northern Vietnam only in the
19th century (Michaud and Turner, 2006), and settled on steep
forested slopes generally above 800 m. Before 1960s, there were
only a few Kinh lowlanders living in Sa Pa town as the surveillance
and maintenance staffs of French military (Michaud and Turner,
2006). From 1960s onwards, Kinh migrated to Sa Pa district as this
was stimulated by the New Economic Zone Policy of the national
government (Michaud and Turner, 2000, 2006). The Kinh were
mainly involved in administration, tourism, and education and
settled in the district’s capital, while most of the other ethnic
groups practiced different types of subsistence agriculture mostly
in the form of shifting cultivation (Tugault-Lafleur, 2007). Apart
from the shifting cultivation, ethnic minorities also used to
cultivate opium and collect forest products for their survival
(Michaud and Turner, 2000; Sowerwine, 2004b; Turner, 2012),
which could have contributed to past forest clearance. Today, the
ethnic groups cultivate water rice on permanent terraced paddy
fields; maize and other crops on upland fields (Leisz et al., 2004;
Turner, 2011). Terraced paddy fields were first introduced by the
Hmong and Yao who migrated from southern China to northern
Vietnam during the late 19th and early 20th centuries (Michaud,
1997). Additionally, many households cultivate cardamom
(Amomum aromaticum) under forest cover as a substitute cash
crop, after the ban on opium in 1992 (Tugault-Lafleur and Turner,
2009; Turner, 2011).
Because of its scenic landscape and presence of five ethnic
groups with their traditional way of living, Sa Pa is considered as
one of the most attractive tourism areas in Vietnam. The Hoang
Lien Mountains comprise probably the last remnants of native
forest of the northern Vietnamese highlands. It became one of the
first areas recognized as a ‘special use forest’ in Vietnam, and it was
converted into the Hoang Lien National Park (HLNP) in July 2002
following the Prime Minister’s Decision 90/2002/QD-TTg to protect
biodiversity by preserving the subtropical and temperate forest
ecosystems (Le, 2004; Jadin et al., 2013). Already under the French
Regime (1887–1940), Sa Pa district was a well-known holiday and
relaxation resort (Michaud and Turner, 2006). Northern Vietnam
suffered a lot under the first Indochina war (1945–1954). The town
sunk into oblivion, as a large part of the population of Sa Pa town
fled away from the hostilities. In the early 1960s, in the framework
of the New Economic Zones Policy, migration schemes were
designed by the new socialist regime that stimulated the
Vietnamese Kinh from the lowlands to populate the northern
Vietnamese Highlands (Hardy, 2005). The decision of the national
government to open Sa Pa district for international tourism in 1993
had a large impact on daily life in Sa Pa town and its surrounding
communities. The number of domestic and international visitors
increased exponentially from 16,100 in 1995 to 405,000 in 2009
(GSO, 1995, 2010) (Fig. 1). Tourism is now the most important
economic activity in the area, and it generated 58% of Sa Pa
H.T.T. Hoang et al. / Anthropocene 5 (2014) 42–51
44
Fig. 1. Location of Sa Pa district, with graph on the evolution and distribution of tourist visits.
district’s GDP in 2010 (GSO, 2010). The poverty rate in Sa Pa district
decreased gradually from 36% in 2000 to 21% in 2009 (GSO, 2000,
2010). Local inhabitants that potentially benefit from tourism
activities are hotel and restaurant owners and shopkeepers in Sa Pa
town; tour guides, traditional craft sellers from the rural villages
and farming households that offer rooms for homestays. The
tourism infrastructure is dominantly controlled by the Kinh
majority, while the other minorities mainly deliver labour force
to run the tourism industry.
Materials and methods
Mapping land cover and land cover changes
In order to evaluate the potential impact of tourism activities on
forest cover in Sa Pa, three land cover maps were compiled based
on LANDSAT images available from the U.S. Geological Survey
archives (). One LANDSAT-patch (path/row
128/45) covers the whole Sa Pa district with a resolution of 30 m by
30 m. The Landsat images date from Feb 1, 1993 (just after the
opening for international tourism), Nov 4, 2006 (midst of the
evaluation period) and Jan 02, 2014 (current state). All images
were taken in the post-harvest period when the arable fields are
bare. All Landsat images in the freely available USGS archive are
orthorectified with precision terrain correction level L1T
(Vanonckelen et al., 2013). All images were then corrected for
atmospheric and topographic effects using the MODTRAN-4 code
and the semi-empirical topographic correction implemented
in ATCOR2/3 (Richter, 2011; Balthazar et al., 2012). Then, a
supervised maximum likelihood classification was carried out to
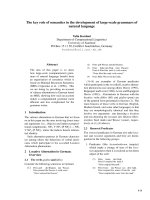
map the following 5 land cover categories (Fig. 2): forest, shrub,
arable land, water body and urban area. Spectral signatures for the
different land cover types were identified by delineating training
areas on the basis of field work carried out in 2010 (Fig. 5).
The accuracy of the land cover maps was assessed by comparing
the classified land cover with visual interpretations of very high
resolution remote sensing data. For 1993, the comparison was
done with aerial photographs (MONRE, 1993); for 2006 with a
VHR-SPOT4 image (MONRE, 2006) and for 2014 with a VHR-SPOT5
image (MONRE, 2012). Random sampling of validation points was
done with n = 219 for the 1993 map, n = 315 for the 2006 map, and
n = 306 for the 2014 map. The number of sample points per land
cover class varied from 3 to 111, depending on the areal cover of
the classes. For all randomly selected points, the land cover was
compared with the classified land cover. This comparison allowed
to assess the overall accuracy, quantity disagreement and
allocation disagreement (in %) following the procedures described
by Pontius and Millones (2011).
In order to analyze land cover change trajectories over 3
timeperiods, the change trajectories were grouped in 6 classes: (1)
deforestation (change from any class of forest to non-forest), (2)
reforestation (change from non-forest to forest), (3) land abandonment (change from agricultural land to shrub or forest), (4)
expansion of arable land (conversion from shrub to arable land), (5)
H.T.T. Hoang et al. / Anthropocene 5 (2014) 42–51
45
Fig. 2. Land cover maps derived from Landsat images for(A) 1993, (B) 2006, (C) 2014 and (D) proportions of the main land cover classes in 1993, 2006, 2014.
other changes, and (6) no change (Table 1). The original classes
‘water body’ and ‘urban area’ that only occupy a minor fraction of
the land were not taken into consideration. A major challenge in
mapping land cover change is the detection of permanent land
abandonment in shifting cultivation systems in which fields are
regularly taken out of production for a short time span only.
Therefore in this study we defined land abandonment as a
transition from agricultural land (observed in 1993) to natural
regrowth of shrub (observed in 2006) on condition that the parcel
was not taken again in production in 2014. Pixels with observed
transitions such as A-A-S and A-A-F (Table 1) of which it is not sure
that they are permanently abandoned were classified into the
group ‘Other change’
Analysis of the controls on land cover change patterns
In order to understand the observed land cover change patterns,
socio-economic and biophysical data were collected at the level of
villages. In Sa Pa district, the majority of the ethnic groups lives in
ethnically homogeneous villages (ba:n or thoˆn in Vietnamese). Only
4 of the 85 villages are inhabited by multiple ethnic groups, and
they are typically located in the commune (xa˜) centres. Therefore,
the village level is considered as the most detailed and relevant
scale level for the analysis of human–environment interactions
Table 1
Land cover change trajectories and their descriptions for period 1993–2014.
Order Land cover change
Category Change trajectory
1993
2006
2014
Forest
Forest
Arable land
Arable land
Shrubs
Shrubs
Arable land
Shrubs
Arable land
Shrubs
Arable land
Shrubs
1
Deforestation
F-F-A
F-F-S
F-A-A
F-A-S
F-S-A
F-S-S
Forest
Forest
Forest
Forest
Forest
Forest
2
Reforestation
A-F-F
S-F-F
S-S-F
Arable land Forest
Shrubs
Forest
Shrubs
Shrubs
Forest
Forest
Forest
3
Land abandonment
A-S-S
A-S-F
Arable land Shrubs
Arable land Shrubs
Shrubs
Forest
4
Arable land expansion S-S-A
S-A-A
S-F-A
5
Other change
A-A-S, A-F-S, A-F-A, S-A-S, A-S-A, S-F-S, F-A-F,
F-S-F, S-A-F, A-A-F
6
No change
F-F-F, A-A-A, S-S-S
Shrubs
Shrubs
Shrubs
F is forest, S is shrubs and A is arable land.
Shrubs
Arable land
Arable land Arable land
Forest
Arable land
H.T.T. Hoang et al. / Anthropocene 5 (2014) 42–51
46
Table 2
Dependent variables used for the ANCOVA analysis. All variables were averaged at the village level.
Variable
Acronym
Description
Type
Unit
Source
Deforestation
DEFOREST
Numerical
%
Landsat images 1993,
2006, 2014
Reforestation
REFOREST
Land abandonment
ABANLAND
Expansion of arable land
EXPLAND
Total area of deforestation of each village divided
by the surface area of the village and multiply by 100
Total area of reforestation of each village divided
by the surface area of the village and multiply by 100
Total area of land abandonment of each village divided
by the surface area of the village and multiply by 100
Total area of arable land expansion of each village divided
by the surface area of the village and multiply by 100
Table 3
Independent variables used for the ANCOVA analysis. All variables were collected or averaged at the village level.
Variable
Acronym
Description
Type
Unit
Source
Engagement in tourism
Ethnic group
%
Vietnam Rural, Agricultural,
and Fishery Census
conducted in 2006 with the
support of the World Bank
(GSO, 2006b)
Numerical
%
Cardamom cultivation
CC
The percentage of households engaged in tourism in 2006
Hmong
Yao
Ta`y
Gia´y
Xa Pho
Mixed ethnic groups
The percentage of households under the poverty level
of Vietnam in 2006
Surface area of cardamom cultivation per household
Numerical
Categorical
Poverty Rate
TOUR
H
Y
T
G
XP
MIX
PR
Numerical
ha/hh
Population growth
POPGR
Population growth rate in the period 1989–2006
Numerical
%/year
Effect of preservation policy
InsideNP
Outside NP
EL
SL
DROAD
DRIVER
DTOWN
DMARKET
The villages are located inside the National park
The villages are located outside the National park
Average elevation calculated at pixel-level
Average slope calculated at pixel-level
Average of the distance to main roads calculated at pixel-level
Average of the distance to rivers calculated at pixel-level
Average of the distance to Sa Pa town calculated at pixel level
Average of the distance to markets calculated at pixel level
Categorical
Elevation
Slope
Distance to
Distance to
Distance to
Distance to
roads
rivers
Sa Pa town
market
(Castella et al., 2002). In Vietnam, however, village boundaries are
not officially delineated because the commune is the lowest
administrative unit (Castella et al., 2005). Therefore, the village
boundaries (n = 85) in Sa Pa district were delineated by means of
participatory mapping following the procedure described by
Castella et al. (2005) and Meyfroidt (2009). Cadastral officers
were offered a 1/10.000 scale colour print of the 2006 VHR-SPOT 4
image (printed in true colours, 5 m resolution) and were asked to
draw the village borders on a transparent sheet on top.
Tables 2 and 3 show all the variables that were collected at
the village level. Socio-economic variables were derived from
the yearbook of 1989 and 2006, and from the Vietnam Rural,
Agricultural, and Fishery Census conducted in 2006 under the
leadership of the Department of Agriculture, Forestry and Fishery
Statistics and the General Statistics Office with support from the
World Bank. The original census data available at household level
were aggregated to village level, and the following variables were
calculated: the percentage of households involved in tourism (%),
the ethnic group (categorical), the population growth rate (%/year),
the poverty rate expressed as percentage of households under the
national poverty threshold of 2400,000 VND/person/year and the
involvement in cardamom cultivation (ha/household) (Table 3). In
order to evaluate the potential effect of the land use policy inside
and outside the National park, one more categorical variable
(inside/outside the park) was taken into account to examine the
effect of public policy. Six biophysical variables were firstly
collected at pixel level (30 Â 30 m): the elevation (m above sea
level), the slope gradient (degree), the distance to main road (m),
the distance to rivers (m), the distance to Sa Pa town (m), the
distance to nearest market (m) and were then aggregated to
village level to match with the scale of socio-economic variables
(Table 3).
Numerical
Numerical
Numerical
Numerical
Numerical
Numerical
m
Degree
m
m
m
m
Yearbook in 1989 and 2006
(GSO, 1989, 2006a)
Topographic maps of 2009
published by Ministry of
Natural Resources and
Environment at the scale
1:50,000. (MONRE, 2009)
Multiple regression analysis using ANCOVA (analysis of
covariance) was performed to detect possible associations
between land cover change, and socio-economic and biophysical
variables at the level of individual villages which can considered as
homogeneous units in terms of ethnicity, livelihood and biophysical setting. ANCOVA is a widely applied technique as it allows
evaluating the combined effect of a range of both categorical and
numerical predictors (Maneesha and Bajpai, 2013). ANCOVA was
performed for each one of the four land cover change types
(deforestation, reforestation, land abandonment, and expansion
of arable land) as the dependent variable. A multicollinearity
test was carried out to detect correlation between explanatory
variables. Multicollinearity diagnostics were performed by
calculating the Variation Inflation Factors (VIF) and the Tolerance
(TOL). In this study, variables with VIF greater than 2 and TOL
less than 0.6 are excluded from the analyses as proposed by
Allison (1999). The final models included ethnicity and effect of
preservation as categorical variables; engagement in tourism,
cardamom cultivation, poverty rate, population growth, slope,
distance to rivers, distance to main road and distance to Sa Pa
town as numerical variables (Table 3). ANCOVA model parameters
were estimated using XLSTAT software, and the explanatory
power of the ANCOVA models was assessed by the Goodness of fit
statistics, R2.
Results
Land cover change patterns
Fig. 2 shows the land cover maps for the years 1993, 2006 and
2014. The overall accuracy of the land cover classification was
assessed at 80.0%, 86.4% and 84.6% (quantity disagreement of 5.0%,
H.T.T. Hoang et al. / Anthropocene 5 (2014) 42–51
2.8%, 4.4% and allocation disagreement of 15.0%, 10.8%, 11.0%) for
the land cover maps of 1993, 2006 and 2014, respectively.
The land cover pattern in Sa Pa district is strongly determined
by the topography. Valleys are generally cultivated. Steep slopes
and mountain peaks are predominantly covered by forests or
shrubs. Patches of forest are concentrated on the Hoang Lien
mountain range in the southern part of Sa Pa district, and are also
found on remote steep slopes. Shrubs are widely distributed, and
can be found in valleys, mountain peaks or on steep slopes.
Between 1993 and 2014, the overall area covered by forest and
arable land increased slightly (with respectively +3% and +2%)
while shrubs decreased with À5% (Fig. 2D). However, land cover
changes are not linear in SaPa district, and there exist substantial
temporal differences. During the first period (1993–2006), the
study area experienced a general trend of deforestation for
expansion of arable land. Between 1993 and 2006 the area covered
by forest decreased by À1% while arable land increased by +4%,
respectively. The deforestation tendency seems to be reversed
after 2006 in Sa Pa district. The area covered by forests increased by
+4% while arable land decreased by À2% between 2006 and 2014.
The area covered by shrubs decreased continuously between 1993
and 2014. A forest transition could be observed in the study area as
a shift from a net deforestation to a net reforestation, and it
occurred at the mid of the 2000s.
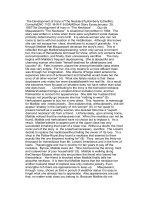
Fig. 3 shows the spatial pattern of land cover change between
1993 and 2014. Most of the deforestation took place in the
northern and southeastern part of the district which can be
explained by the fact that forests in the southwestern part are
mainly situated within the Hoang Lien National Park. According to
the national law, farmland expansion is forbidden within national
parks. Nevertheless, some forest loss can be observed which is
probably due to forest fires and illegal logging.
Description of the predictors of land cover change
Fig. 4 shows the spatial pattern of the independent variables
that were evaluated in this study. It is clear that Kinh people are
living in Sa Pa town, while Hmong and Ta`y ethnic groups occupy
the rural area. Hmong ethnic groups are settled on higher
47
elevations, and Ta`y are generally settled nearby the rivers in the
valleys. The villages of the Yao are situated in the peripheral areas
in the north and south of Sa Pa district. Fig. 4A shows that the
household involvement in tourism is highest in Sa Pa town (>50%).
Involvement in tourism in the peripheral areas is restricted to a few
isolated villages. The poverty rate map shows that the town of Sa
Pa and its surrounding villages are richer than the more peripheral
areas. The southern part of the district is also richer because many
local households receive an additional income from cardamom
cultivation under forest. Cardamom is mainly grown under trees of
the Hoang Lien National Park in the southern part of the district.
The population growth is positive in the whole district and highest
in Sa Pa town and its immediate surroundings.
Table 4 shows the results of the ANCOVA analysis for four land
cover trajectories: deforestation, reforestation, land abandonment
and expansion of arable land. The explanatory power of the
ANCOVA models is assessed by the R2 values (Table 4). Between 55
and 72% of the variance in land cover change is explained by the
selected predictors. Land cover change is controlled by a
combination of biophysical and socio-economical factors. Forests
are typically better preserved in villages with poor accessibility
(steep slopes, far from main roads, and poor market access), and a
low or negative population growth. The influence of environmental
and demographic drivers on forest cover change has previously
been described for other areas of frontier colonization (Castella
et al., 2005; Hietel et al., 2005; Getahun et al., 2013; Vu et al., 2013).
Table 4 shows that household involvement in tourism is
negatively associated with deforestation and positively with land
abandonment. When the involvement of households in tourism
activities increased with 10%, deforestation is predicted to have
decreased with resp. 0.61% and land abandonment to have
increased with 0.45%. Deforestation is higher in villages in the
north and southeast of Sa Pa district, that are located at greater
distance from the tourism centre. Land abandonment is mostly
observed in Sa Pa town and in the communes of Ta Phin, San Sa Ho,
Lao Chai, Ta Van and Ban Ho (Figs. 1 and 3). In some villages (Sa Pa
town; Ta Chai village, belonging to Ta Phin commune; Ly Lao Chai
village, belonging to Lao Chai commune and Hoang Lien village,
belonging to Ban Ho commune), more than 8% of the surface area
was abandoned between 1993 and 2014. Over the period 1995–
2009, the number of tourists in Sa Pa district has increased by 25
times (Fig. 1). Given the current economic policy, it is expected that
Table 4
The results of ANCOVA at village level (85 villages). Only the controlling factors that
are retained at a 10% significance level are listed.
LCC categories
Controlling
factors
Value
Standard
deviation
Pr > |t|
Goodness
of fit of
model (R2)
Deforestation
SL
TOUR
POPGR
CC
Inside NPa
À0.494
À0.061
1.543
À0.975
À4.985
0.148
0.065
0.723
1.141
1.802
0.001
0.034
0.036
0.100
0.007
0.59
Reforestation
SL
Inside NPa
0.356
À6.183
0.191
2.304
0.067
0.009
0.55
Land abandonment
DRIVER
TOUR
Inside NPa
Ethnic-MIXb
0.003
0.045
À1.567
2.443
0.001
0.029
0.688
0.998
0.039
0.093
0.026
0.017
0.63
Expansion of
arable land
DROAD
SL
CC
Inside NPa
Ethnic-Hb
À0.001
À0.599
À3.444
À3.464
3.693
0.000
0.174
1.330
2.007
1.737
0.087
0.001
0.012
0.089
0.037
0.72
a
Fig. 3. Land cover change map for the period 1993–2014.
b
Reference category is Outside NP.
Reference category is ethnic-Y.
48
H.T.T. Hoang et al. / Anthropocene 5 (2014) 42–51
Fig. 4. Spatial pattern of the independent variables: (A) percentage of households engaged in tourism, (B) surface area of cardamom cultivation per household, (C) ethnic
distribution in 2006, (D) poverty rate in 2006, (E) population growth rate in the period 1989–2006, (F) distance to Sa Pa town at pixel-level, (G) slope gradient, (H) distance to
the nearest road at pixel-level and (I) distance to the rivers at pixel-level.
the development of tourism activities will further increase in the
future (Michaud and Turner, 2006).
The statistical results indicate that the cultivation of cardamom
is negatively associated with deforestation and expansion of arable
land. This means that the involvement in cardamom cultivation
(under forest) slows down deforestation and expansion of
cultivated land, as cardamom plantations are not classified here
as agricultural land. Cardamom production provides higher
incomes than traditional crop farming (Sowerwine, 2004a).
Recently, cardamom is emerging as an important cash crop in
northern Vietnam that requires little investment and labour but
may offer higher income levels (Tugault-Lafleur and Turner, 2009).
Because of the requirement of a dense forest canopy for optimal
production, the villagers not only protect the remaining old forest
but also allow regeneration of some of the swidden lands in order
to create the necessary ecological conditions to plant and harvest
cardamom (Sowerwine, 2004b). Its impact on forest conservation
is similar to the system of shade coffee cultivation in forest that
also contributed to a preservation of the afromontane forests in,
e.g., the south of Ethiopia (Getahun et al., 2013).
The role of ethnicity is complex. After controlling for biophysical and socio-economic settings, Hmong villages are characterized
by higher expansion rates of arable land compared to Yao villages.
This can be explained by the fact that Hmong villages are more
H.T.T. Hoang et al. / Anthropocene 5 (2014) 42–51
densely populated than Yao villages (Jadin et al., 2013) so they
need to expand their arable land more to supply the food demand.
In villages with mixed ethnicities, the land abandonment rate is
higher than in Yao villages, which can be explained by the fact that
mixed ethnicities only occur in the accessible commune centres
that are more involved in off-farm activities.
The effect of preservation policy is certainly reflected in the
difference in land cover changes inside and outside the National
park. The estimated coefficients for the explanatory variable
‘Inside NP’ are negative for all land cover change categories
whereby the ‘Outside NP’ is taken as a reference value. This means
that land units with the same physical and socio-economic
properties have lower dynamics when they are located inside the
Hoang Lien National park.
Discussion
In Vietnam, the rapid increase in forest area since the early
1990s resulted in a reversal of the national deforestation trend
(Meyfroidt and Lambin, 2008b). The national-scale assessment
masks a wide range of other land use dynamics that exist at the
local scale, and that are not necessarily conform to the trends in
forest cover change at national scale. In the Sa Pa district,
reforestation was observed at the mid of the 2000s, some years
later than was observed at national scale. This time point roughly
corresponds to the strong increase in number of tourists to Sa Pa
(Fig. 1). There is a wide variety of human-induced change in forest
cover. Forest cover changes are different in villages that are
strongly involved in tourism activities. They are characterized by
significantly higher rates of land abandonment and lower rates of
deforestation. This can be explained by recent changes in labour
division and income in rural households. In the traditional ethnic
society, labour was mainly divided by gender (Duong, 2008b).
Traditionally, women were primarily responsible for housework,
agricultural labour and firewood collection while men were in
charge of the heavy works such as logging, plowing, building
houses and processing tools (Cooper, 1984; Sowerwine, 2004a;
49
Symonds, 2004). This traditional labour division was challenged by
the rapid growth of the tourism industry in Sa Pa town (Duong,
2008b). As the demand for traditional handicrafts increased
strongly and trade opportunities appeared, women from ethnic
minorities engaged in these activities (Michaud and Turner, 2000).
Today, many young female from rural villages act as trekking
guides, and young and old women from ethnic minorities alike sell
textile commodities to tourists (Turner, 2011). Some of them have
become professional tour guides and are hired by hotels and travel
agencies in town, and can gain higher incomes (Duong, 2008a).
With this extra income, they can live independently, make their
own money and are able to provide financial support to their
families (Duong, 2008a).
The development of tourism activities mainly offered new offfarm opportunities for women from ethnic minorities, having as a
direct consequence that women are now less involved in
agricultural activities while men are more involved into household
management. As there is less labour available for agricultural
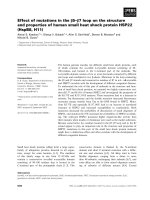
activities, cutting or clearing of trees, marginal agricultural fields
with low productivity are preferentially abandoned (Fig. 5D) and
deforestation is reduced. Our results suggest that the additional
income from tourism is sufficiently high to exceed the added value
that can be gained from steep land agriculture or from forest
extraction. The fallowed fields will regenerate into shrubs and
secondary forests that can develop the optimal ecological
conditions for cardamom cultivation. Despite the fact that it
may take up to a decade or longer before the households will
achieve economic returns on their investment, many families
expect an income from cardamom for their children (Sowerwine,
2004a). Moreover, many villagers are abandoning swidden rice
cultivation because of increasing land constraints, lower yields,
loss of soil fertility and lack of labour availability (Sowerwine,
2004a). Since 1991, much of this land has been declared
‘‘watershed protection land’’, and swidden rice varieties are
rapidly abandoned as more time is devoted to wet rice production
(Sowerwine, 2004a). Because of diversification in alternative
economic activities, rural households are becoming less depen-
Fig. 5. Major land cover types that were identified in Sa Pa district: (A) Forest, (B) Shrubs, (C) Arable land and (D) Abandoned steep farmland.
First author in 2010
50
H.T.T. Hoang et al. / Anthropocene 5 (2014) 42–51
dent on natural resources for their survival, and deforestation was
reduced.
This decrease in land pressure after tourism development is not
confirmed by previous studies in Southeast Asia, where the
presence of alternative income sources has increased the
frequency of cultivation through hired rural labour and/or the
expansion of the cultivated area through land purchase (e.g., Forsyth
(1995) for northern Thailand). This suggests that local and national
land use policy likely plays an important role in directing tourism
development towards sustainable natural resource management. In
Sa Pa, conservation policy has had a positive effect on forest
protection as most of the forests within the National park remained
intact during last the 21 years. This makes the area attractive for
tourists , and tourists are further supporting biodiversity conservation by providing extra revenue for conservation. Direct revenue is
presently being raised by the Ham Rong project, and by the charging
of fees for climbing Fansipan mountain or visiting exclusive sites
within Sa Pa district (Frontier Vietnam, 1999).
Conclusions
This paper aimed at better understanding of the human–
environment interaction in the Sa Pa district after the advent and
growth of the tourism industry. A land cover change analysis
between 1993 and 2014 showed that the Sa Pa district as a whole
experienced a forest transition, with an observed turning point
around mid 2000s. However, trends at district level mask
substantial heterogeneity at village level. The results from this
paper show that forest cover changes are different in rural villages
that have access to alternative income sources, either from
cardamom cultivation under forest canopy or from tourism
activities. These rural villages are typically characterized by higher
rates of land abandonment and lower rates of deforestation. Because
of diversification in alternative economic activities, rural households
are becoming less dependent on natural resources and agricultural
products for their survival. Our results suggest that the creation of
off-farm jobs in the tourism sector, construction or manufacturing
can be a driver of shifts in coupled human–environmental changes.
The tourism activities in Sa Pa can therefore be considered as a
special pathway towards a forest transition whereby the generation
of off-farm jobs has a positive impact on forest conservation. In our
view, the main challenge is to find a balance between the rapid
development of tourism activities and the preservation of the
authentic socio-cultural elements of the ethnic minorities that make
the area attractive for tourists in the first place.
Acknowledgements
This research was part of the bilateral scientific project on
‘Land-use change under impact of socio-economic development
and its implications on environmental services in Vietnam’ funded
by the Belgian Science Policy (BELSPO) (Grant SPP PS BL/10/V26)
and the Vietnamese Ministry of Science & Technology (MOST)
(Grant 42/2009/HÐ-NÐT). Patrick Meyfroidt, Isaline Jadin, Francois
Clapuyt have provided valuable suggestions for this research
project. We are thankful to all ministries and institutions in
Vietnam which provided the necessary data to undertake this
research. We also thank village leaders and local people in Sa Pa
district for facilitating the field data collection, and the anonymous
reviewers for their valuable input.
References
Adams, W.M., Aveling, R., Brockington, D., Dickson, B., Elliott, J., Hutton, J., Roe, D.,
Vira, B., Wolmer, W., 2004. Biodiversity conservation and the eradication of
poverty. Science 306 (5699) 1146–1149.
Allison, P.D., 1999. Logistic Regression Using the SAS System: Theory and Application. SAS Institute Inc., Cary, NC.
Atik, M., Altan, T., Artar, M., 2010. Land use changes in relation to coastal
tourism developments in Turkish Mediterranean. Pol. J. Environ. Stud. 19 (1)
21–33.
Balthazar, V., Vanacker, V., Lambin, E., 2012. Evaluation and parametrization of
ATCOR3 topographic correction method for forest cover mapping in mountain
areas. Int. J. Appl. Earth Observ. Geoinf. 18, 436–450.
Burgess, J.C., Barbier, E.B., 2001. Sustainable development. Int. Encycl. Soc. Behav.
Sci. 15329–15335.
Casse, T., Milhøj, A., Ranaivoson, S., Randriamanarivo, J.R., 2004. Causes of deforestation in southwestern Madagascar: what do we know? For. Policy Econ. 6 (1)
33–48.
Castella, J.C., Pham, H.M., Kam, S.P., Villano, L., Tronche, N.R., 2005. Analysis of
village accessibility and its impact on land use dynamics in a mountainous
province of northern Vietnam. Appl. Geogr. 25, 308–326.
Castella, J.C., Tronche, N.R., Nguyen, V., 2002. Landscape changes in Cho Don District
during the doi moi era (1990–2000) and their implications for sustainable
natural resource management in Vietnam’s mountainous provinces. In: Castella, J.C., Dang, D.Q. (Eds.), Doi Moi in the Mountains. The Agricultural Publishing House, Hanoi, Vietnam, pp. 149–173.
Cooper, R., 1984. Resource Scarcity and the H’mong Response: Patterns of Settlement and Economy in Transition. National University of Singapore Press,
Singapore.
Coulibaly-Lingani, P., Tigabu, M., Savadogo, P., Oden, P-C., Ouadba, J-M., 2009.
Determinants of access to forest products in southern Burkina Faso. For. Policy
Econ. 11 (7) 516–524.
Dasgupta, S., Deichmann, U., Wheeler, D., 2005. Where is the poverty–environment
nexus? Evidence from Cambodia, Lao PDR, and Vietnam. World Dev. 33 (4)
617–638.
Dong, J., Xiao, X., Sheldon, S., Biradar, C., Duong, N.D., Hazarika, M., 2012. A
comparison of forest cover maps in Mainland Southeast Asia from multiple
sources: PALSAR, MERIS, MODIS and FRA. Remote Sens. Environ. 127, 60–73.
Dong, R., Yu, L., Liu, G., 2008. Impact of tourism development on land-cover change
in a matriarchal community in the Lugu Lake area. Int. J. Sustain. Dev. World
Ecol. 15, 28–35.
Duong, B.H., 2008a. Contesting marginality: consumption, networks, and everyday
practice among Hmong girls in Sa Pa, Northwestern Vietnam. J. Vietnamese
Stud. 3 (3) 231–260.
Duong, B.H., 2008b. S u. ’ thay poˆ:i ca´c moˆ´i quan h lao poˆ. ng o:’ moˆ. t ba:n H’moˆng tai
. Sa
Pa, Taˆy Ba˘´c Vi t Nam (Changing Labor Relations in a Hmong Village in SaPa,
Northwestern Vietnam). In: Sikor, T., Sowerwine, J., Romm, J., Nghiem, P.T.
~ ng chuyeˆ:n poˆ:i kinh teˆ´ – xa˜ hoˆi o: vu`ng cao Vi t Nam (Upland
(Eds.), Nhu
’
. ’
Transformations). CRES (Trung taˆm Nghieˆn c u ta`i nguyeˆn va` Moˆi Tru’o`’ng,
´
Ðai
. hoc
. Quoˆc gia Ha` Noˆi),
. Hanoi, Vietnam, pp. 85–97.
Etter, A., McAlpine, C., Wilson, K., Phinn, S., Possingham, H., 2006. Regional pattern
of agricultural land use and deforestation in Colombia. Agric. Ecosyst. Environ.
114, 369–386.
FAO, 2006. Global Forest Resources Assessment 2005: Progress Towards Sustainable Forest Management Rome, .
FAO, 2010. Global Forest Resources Assessment 2010. FAO, Rome.
Forsyth, T.J., 1995. Tourism and agricultural development in Thailand. Ann. Tour.
Res. 22 (4) 877–900.
Fox, J., Truong, D.M., Rambo, A.T., Tuyen, N.P., Cuc, L.T., Leisz, S., 2000. Shifting
cultivation: a new old paradigm for managing tropical forests. Bioscience 50,
521–528.
Frontier Vietnam, 1997. Biodiversity Value of Hoang Lien Mountains and Strategies
for Conservation. Society for Environmental Exploration, UK and Institute
of Ecology and Biological Resources, Hanoi, Hanoi, Vietnam, pp. 68 Report
nr 13.
Frontier Vietnam, 1999. Hoang Lien Nature Reserve – Conservation Evaluation
1997/98. Society for Environmental Exploration, UK and Institute of Ecology
and Biological Resources, Hanoi, Hanoi, Vietnam, pp. 107 Report nr 17.
Garcı´a-Martı´nez, A., Bernue´s, A., Olaizola, A.M., 2011. Simulation of mountain cattle
farming system changes under diverse agricultural policies and off-farm labour
scenarios? Livest. Sci. 137 (1–3) 73–86.
Gaughan, A.E., Binford, M.W., Southworth, J., 2009. Tourism, forest conversion,
and land transformations in the Angkor basin, Cambodia. Appl. Geogr. 29 (2)
212–223.
Geist, H.J., Lambin, E.F., 2001. What Drives Tropical Deforestation? A MetaAnalysis of Proximate and Underlying Causes of Deforestation Based on Subnational Case Study Evidence. CIACO, Louvain-la-Neuve, Belgium LUCC Report
Series No. 4.
Getahun, K., Van Rompaey, A., Van Turnhout, P., Poesen, J., 2013. Factors controlling
patterns of deforestation in moist evergreen Afromontane forests of Southwest
Ethiopia. For. Ecol Manage. 304, 171–181.
Grainger, A., 2008. Difficulties in tracking the long-term global trend in tropical
forest area. Proc. Natl. Acad. Sci. U. S. A. 105, 818–823.
GSO [General Statistics Office], 1989. National Vietnamese Census, Year book. The
people committee of Sa Pa district, Lao Cai, Vietnam.
GSO [General Statistics Office], 1995. National Vietnamese Census, Year book. The
people committee of Sa Pa district, Lao Cai, Vietnam.
GSO [General Statistics Office], 2000. National Vietnamese Census, Year book in
period 1995–2000. The people committee of Sa Pa district, Lao Cai, Vietnam.
GSO [General Statistics Office], 2006a. National Vietnamese Census, Year book. The
people committee of Sa Pa district, Lao Cai, Vietnam.
H.T.T. Hoang et al. / Anthropocene 5 (2014) 42–51
GSO, 2006b. Vietnam Rural, Agricultural, and Fishery Census. Department of
Agriculture, Forestry and Fishery.
GSO [General Statistics Office], 2010. National Vietnamese Census, Year book. The
people committee of Sa Pa district, Lao Cai, Vietnam.
Hardy, A., 2005. Red Hills. Migrants and the State in the Highlands of Vietnam
Institute of Southeast Asian Studies (ISEAS), Singapore.
Hietel, E., Waldhardt, R., Otte, A., 2005. Linking socio-economic factors, environment and land cover in the German Highlands, 1945–1999. J. Environ. Manage.
75, 133–143.
Hobbs, R., 2001. Agricultural expansion and tropical deforestation: poverty, international trade and land use. Agric. Ecosyst. Environ. 86 (2) 218–219.
Jadin, I., Vanacker, V., Hoang, T.T.H., 2013. Drivers of forest cover dynamics in
smallholder farming systems: The case of Northwestern Vietnam. AMBIO 42 (3)
344–356.
Job, H., Paesler, F., 2013. Links between nature-based tourism, protected areas,
poverty alleviation and crises – the example of Wasini Island (Kenya). J. Outdoor
Recreation Tour. 1 (2) 18–28.
Jodha, N.S., 1998. Common property resources and rural poor in dry regions of India.
Econ. Pol. Wkly. 21, 1169–1181.
Koning, D., 2000. Accessibility: key factor for development. In: Nori, M., et al. (Eds.),
Drawing Lessons from Experience Proceeding of Workshop on Sustainable
Rural Development in the Southeast Asian Mountainous Region.
Lambin, E.F., Geist, H.J., 2003. Regional differences in tropical deforestation. Issue
Environ. 45, 22–36.
Le, V.L., 2004. Hoang Lien National Park. National Culture Publishing House, Hanoi,
Vietnam.
Leisz, S.J., Ha, N.T.T., Yen, N.T.B., Lam, N.T., Vien, T.D., 2004. Developing a methodology for identifying, mapping and potentially monitoring the distribution of
general farming system types in Vietnam’s northern mountain region. Agric.
Syst. 85 (3) 40–63.
Maneesha, Bajpai, P., 2013. Multiple regression analysis using ANCOVA in University model. Int. J. Appl. Phys. Math. 3 (5) 336–340.
Mather, A.S., 1992. The forest transition. Area 24 (4) 367–379.
Meyfroidt, P., 2009. Forest Transition in Vietnam: Evidence, Theory and SocialEcological Feedbacks. (PhD dissertation)Universite´ Catholique de Louvain,
Louvain La Neuve, Belgium.
Meyfroidt, P., Lambin, E.F., 2008a. The causes of the reforestation in Vietnam. Land
Use Policy 25 (2) 182–197.
Meyfroidt, P., Lambin, E.F., 2008b. Forest transition in Vietnam and its environmental impacts. Glob. Change Biol. 14 (6) 1319–1336.
Michaud, J., 1997. From Southwest China into upper Indochina: an overview of
Hmong (Miao) migration. Asia Pacific Viewp. 38 (2) 119–130.
Michaud, J., Turner, S., 2000. The Sa Pa marketplace, Lao Cai province, Vietnam. Asia
Pacific Viewp. 41 (1) 85–100.
Michaud, J., Turner, S., 2006. Contending visions of a hill-station in Vietnam. Ann.
Tour. Res. 33 (3) 785–808.
MONRE, 1993. Aerial Photos. Department of Survey and Mapping, Ministry of
Natural Resources and Environment (MONRE).
MONRE, 2006. VHR-SPOT Image 2006. Remote Sensing Center, Ministry of Natural
Resources and Environment, Vietnam (MONRE).
MONRE, 2009. Topographic Maps at the Scale 1:50,000. Ministry of Natural
Resources and Environment.
MONRE, 2012. VHR-SPOT Image 2012. Remote Sensing Center, Ministry of Natural
Resources and Environment, Vietnam (MONRE).
Mottet, A., Ladet, S., Coque´, N., Gibon, A., 2006. Agricultural land-use change and its
drivers in mountain landscapes: a case study in the Pyrenees. Agric. Ecosyst.
Environ. 114 (2–4) 296–310.
Nyaupane, G.P., Poudel, S., 2011. Linkages among biodiversity, livelihood, and
tourism. Ann. Tour. Res. 38 (4) 1344–1366.
Pontius Jr., R.G., Millones, M., 2011. Death to Kappa: birth of quantity disagreement
and allocation disagreement for accuracy assessment. Int. J. Remote Sens. 32
(15) 4407–4429.
Ravnborg, H.M., 2003. Poverty and environmental degradation in the Nicaraguan
hillsides. World Dev. 31 (11) 1933–1946.
51
Richter, R., 2011. Atmospheric/Topographic Correction for Satellite Imagery—
ATCOR-2/3 User Guide, Version 8.0. Switzerland: ReSe Applications Schla¨pfer.
Robinson, J.G., 2006. Conservation biology and real-world conservation. Conserv.
Biol. 20 (3) 658–669.
Rudel, T.K., Coomes, O.T., Moran, E., Achard, F., Angelsen, A., Xu, J., Lambin, E., 2005.
Forest transitions: towards a global understanding of land use change. Glob.
Environ. Change 15 (1) 22–31.
Scherr, S., 2000. A downward spiral? Research evidence on the relationship
between poverty and natural resource degradation. Food Policy 25 (4)
479–498.
Sowerwine, J., 2004a. The Political Ecology of Dao (Yao) Landscape Transformations:
Territory, Gender, and Livelihood Politics in Highland Vietnam. (PhD dissertation)University of California, Berkeley, America.
Sowerwine, J., 2004b. Territorialisation and the politics of highland landscapes in
Vietnam: negotiating property relations in policy, meaning and practice. Conserv. Soc. 2 (1) 98–117.
Symonds, P.V., 2004. Calling in the Soul: Gender and the Cycle of Life in a H’mong
Village. The University of Washington Press, The United States of America.
Szillassi, P., Jordan, G., Kovacs, F., Van Rompaey, A., Van Dessel, W., 2010. Investigating the link between soil quality and agricultural land use change. A case
study in the Lake Balaton Catchment, Hungary. Carpathian J. Earth Environ. Sci.
5, 61–70.
Teka-Belay, K., Van Rompaey, A., Poesen, J., 2013. Assessing the role of policies on
land use change and agricultural development since 1960 in northern Ethiopia.
Land Use Policy 30, 944–951.
Tugault-Lafleur, C., 2007. Diversifying Livelihoods: Hmong Use and Trade of Forest
Products in Northern Vietnam. (Master thesis)McGill University, Montreal,
Canada.
Tugault-Lafleur, C., Turner, S., 2009. The price of spice: ethnic minority livelihoods
and cardamom commodity chains in upland northern Vietnam. Singapore J.
Trop. Geogr. 30 (3) 388–403.
Turner, S., 2011. Making a living the Hmong way: an actor-oriented livelihoods
approach to everyday politics and resistance in upland Vietnam. Ann. Assoc.
Am. Geogr. 102 (2) 403–422.
Turner, S., 2012. Forever Hmong: ethnic minority livelihoods and agrarian transition in upland northern vietnam. Prof. Geogr. 64 (4) 540–553.
Van Dessel, W., Van Rompaey, A., Poelmans, L., Szillassi, P., 2008. Predicting land
cover changes and their impact on the sediment influx in the Lake Balaton
Catchment. Landsc. Ecol. 23, 645–656.
Vanacker, V., Bellin, N., Molina, A., Kubik, P.W., 2014. Erosion regulation as a
function of human disturbances to vegetation cover: a conceptual model.
Landsc. Ecol. 29, 293–309.
Vanegas, R., Henry, S., 2012. Identifying socio-economic and demographic driving
factors at household population level conditioning the local agricultural practices, land use and perception of land degradation in the Paute catchment
(Ecuador). In: 5th Conference of the Aso Latinoamericana de Poblacion
Proceedings, Uruguay.
Vanonckelen, S., Lhermitte, S., Van Rompaey, A., 2013. The effect of atmospheric and
topographic correction methods on land cover classification accuracy. Int. J.
Appl. Earth Observ. Geoinf. 24, 9–21.
Vermeiren, K., Van Rompaey, A., Loopmans, M., Serwajja, E., Mukwaya, P., 2012.
Urban growth of Kampala, Uganda: Pattern analysis and scenario development.
Landsc. Urban Plan. 106 (2) 199–206.
Vu, K.C., Van Rompaey, A., Govers, G., Vanacker, V., Schmook, B., Nguyen, H., 2013.
Land transitions in Northwest Vietnam: an integrated analysis of biophysical
and socio-cultural factors. Hum. Ecol. 41 (1) 37–50.
Wang, J., Liu, Y., 2013. Tourism-led land-use changes and their environmental
effects in the southern coastal region of Hainan Island, China. J. Coast. Res. 29 (5)
1118–1125.
Zhang, Y., 2000. Deforestation and forest transition: theory and evidence in China.
In: Palo, M., Vanhanen, H. (Eds.), World Forests from Deforestation to Transition? Kluwer Academic Publishers, Dordrecht, p. 25.
Zwane, A.P., 2007. Does poverty constrain deforestation? Econometric evidence
from Peru. J. Dev. Econ. 84 (1) 330–349.