DSpace at VNU: The Structure of Liquid PbSiO3: Insight from Analysis and Visualization of Molecular Dynamics Data
Bạn đang xem bản rút gọn của tài liệu. Xem và tải ngay bản đầy đủ của tài liệu tại đây (626.07 KB, 8 trang )
VNU Journal of Science: Mathematics – Physics, Vol. 31, No. 3 (2015) 15-22
The Structure of Liquid PbSiO3: Insight from Analysis
and Visualization of Molecular Dynamics Data
Nguyen Van Yen1,*, Nguyen Van Hong1, Le The Vinh2
1
Department of Computational Physics, Hanoi University of Science and Technology
No. 1 Dai Co Viet, Hanoi, Vietnam
2
Vinh University of Technology Education, Nguyen Viet Xuan, Hung Dung, Vinh, Nghe An, Vietnam
Received 23 April 2015
Revised 28 May 2015; Accepted 15 July 2015
Abstract: The structural characteristics of liquid PbSiO3 have been investigated by means of the
molecular dynamics simulation. The simulations were done in a microcanonical ensemble, using
pair potentials. Models consisting of 5000 atoms (1000 Pb, 1000 Si and 3000 O) were constructed
at different pressures and at temperatures 3200 K. The local structure and network topology were
analyzed through radial distribution function, bond angle distributions and coordination number
distribution. The local environment around Pb atoms and continuity of silica and lead oxide subnetworks as well as their change under compression are also discussed in detail, moreover, we
have used visualization techniques illustrated network structure.
Keywords: Structural phase, liquid, triclusters, simulation, pressure.
1. Introduction∗
Lead-silicate glass is an important material in many high technology application [1]. They are used
as special materials in electronics and optoelectronics (in the production of image plate amplifiers and
scintillators [2]). The structural chemistry of glass systems of PbO-SiO2 have been studied for a long
time. Because, they exhibit many properties (such as thermal, optical, and mechanical properties) very
different than other silicate glasses. Specially, the PbO-SiO2 form a thermally and chemically stable
glass over a wide composition range. The atomic structure of lead-silicate glasses has been extensively
investigated by using various experimental techniques, including IR spectroscopy [3], Raman spectroscopy [3–5], NMR [4, 6, 7], XPS [8], X-ray [9,10], neutron diffraction methods [11,12], and
EXAFS [7,13]. Computer simulations of the structure have also been performed [13]. It is well known
that most glasses, depending on the method of preparation, can have various densities with the same
composition. In this respect, silica is probably the most studied material (e.g. [14–24]). Studies on
_______
Corresponding author. Tel.: 84- 984545072
Email:
∗
15
16
N.V. Yen et al. / VNU Journal of Science: Mathematics – Physics, Vol. 31, No. 3 (2015) 15-22
low- and high-density forms of many binary silica glasses have also been performed. However, the
structure and dynamics of rarefied [25] and densified silicate glasses containing heavy-metal oxides,
as far as the authors know are still in debate.
The present contribution is a molecular dynamics (MD) [26] study of the structure of rarefied and
densified lead-silicate glass of the PbSiO3 composition. In order to see more clearly the structural
characteristics of low-and high-density states, we have performed our simulations in a wide range of
densities, from 5.9 g/cm3 to 8.7 g/cm3. The number of issues need to be clarified such as
microstructure, microphase separation, polymorphism and diffusion properties.
2. Calculation method
Molecular dynamic (MD) simulation is carried out for lead silicates systems (5000 atoms) at
temperatures of 3200 K and pressure range from 0 to 35GPa. The Born-Mayer potential is used in this
simulation. Detail about this potential can be found in Refs. [27, 28] the software used in our
calculation, analysis and visualization was written by ourselves. It was written in C language and run
on Linux operating system. We use the Verlet algorithm to integrate the equations of motion with MD
step of 1.6 fs. This value assures the requirement to accurately integrate the Newtonian equations of
motion in order to track atomic trajectories and the computational cost is reasonable. Initial
configuration is obtained by randomly placing all atoms in a simulation box. This sample is
equilibrated at temperature of 6000 K for a long time (about 105 MD steps) and then it is compressed
to different pressure (from 0 to 35GPa) and relaxed for about 106 MD step. After that the models at
different pressure is cooled down to the temperature of 3200 K with the rate of about 1013 MD K/s. A
consequent long relaxation (about 107 MD steps) has been done in the NPT ensemble (constant
temperature and pressure) to obtain equilibrium state. In order to improve the statistics the measured
quantities such as the coordination number, partial radial distribution function are computed by
averaging over 1000 configurations separated by 10 MD steps.
3. Results and discussions
S iO
1 .0
S iO
S iO
4
PbO
5
PbO
6
PbO
PbO
0 .8
fraction
PbO
PbO
0 .6
3
4
5
6
7
8
0 .4
0 .2
0 .0
0
20
40
0
P (G P a )
20
40
60
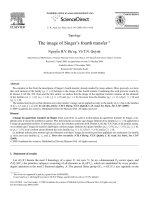
Fig. 1. Distribution of coordination units SiOx(left) and PbOx(right) as a function of pressure.
17
N.V. Yen et al. / VNU Journal of Science: Mathematics – Physics, Vol. 31, No. 3 (2015) 15-22
The structural organization in liquid PbSiO3 were investigated through pair radial distribution
function, coordination distribution, bond length and bond angle distribution. Intermediate range order
is clarified by visual tool.
Firstly, figure 1 shows that, the distribution of coordination units TOx (T is Si or Pb). With SiOx
units(left), it can been that, at low pressure(density), most of Si atoms has coordination number of 4 (
about 97.5%). Meanwhile, the distribution of coordination SiO5 units is very small (about 2.5 %) and
non-existence of the SO6 units. When increasing pressure, the significant change of SiOx units. The
fraction of SiO4 units is decreases while the fraction of SiO5 and SiO6 increases. The fraction of SiO5
get maximum at pressure 25 GPa with the fraction 54.98%. At pressure 35 GPa, the fraction SiO4 units
is small and the fraction units of SiOx mainly consists of the fraction units SiO5 and SiO6. This result is
in good agreement with calculated results in the works [29, 30], this has been visualization in figure 5.
With units PbOx(right), it can seen that, at ambient pressure, most of coordination units are PbO3,
PbO4, PbO5 with the fraction 25.49%, 47.24%, 22.89% respectively. When pressure increases, PbOx
(x=3,4) decreases, whereas the units PbOx(x=5,6,7 and 8) increases, the fraction PbO5 and PbO6 get
maximum at about 10GPa, 15GPa respectively. At high pressure, most of coordination units are PbO6,
PbO7, PbO8. Of which, the fraction of PbO7 units is largest (about 40.83%).
S iO 4
0 .3
S iO 6
S iO 5
10 G Pa
15 G Pa
20 G Pa
0 G Pa
5 G Pa
10 G P a
S iO 4
0 GPa
5 GPa
10 G Pa
25 G Pa
30 G Pa
35 G Pa
Fraction
Fraction
0 .1 5
0 .1 0
0 .0 5
S iO 5
10 G Pa
15 G Pa
20 G Pa
S iO 6
25 G P a
30 G P a
35 G P a
0 .2
0 .1
0 .0 0
0 .0
1 .5
2 .0
2 .5 1 .5
2 .0
B o n d le n g th
2 .5 1 .5
2 .0
50
2 .5
100
150
50
a
0.15
PbO 4
PbO 5
150
50
100
150
b
5 GPa
10 GPa
15 GPa
PbO 6
15 GPa PbO
8
20 GPa
25 GPa
30 GPa
PbO7
15 GPa
20 GPa
25 GPa
0.10
Fraction
Fraction
0.10
0 GPa
5 GPa
10 GPa
100
B o n d a n g le (D e g re e )
(Å )
20 GPa
25 GPa
30 GPa
35 GPa
0.05
0.05
0.00
0.00
50
100
150
50
100
150
50
100
150
50
100
150
50
100
150
Bond angle(Degree)
Bond angle(Degree)
c
d
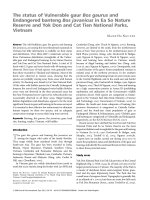
Fig. 2 The bond length distribution and The bond angle distribution in coordination units TOx
(T=Si, Al; x= 4, 5, 6, 7 and 8).
18
N.V. Yen et al. / VNU Journal of Science: Mathematics – Physics, Vol. 31, No. 3 (2015) 15-22
Fig 2 show that, the bond length and bond angle distributions in basic structural units at different
pressures. The bond angle can be used to describe the statistical average of angles formed with
neighboring atoms(Angular Distribution Function). The peaks of bond-length distributions TOx(T is Si
or Pb) in SiO4, SiO5 and SiO6 units are 1.60, 1.65 and 1.70 Å respectively(fig 2a). The peaks of bondangle distributions TOx(T is Si or Pb) in SiO4, SiO5 and SiO6 units are 1000-1050, 850-900, 850-900
respectively(fig 2b). The PbO4, PbO5 and PbO6 units are 850-950, 850-900, 800-850 respectively(fig2c).
This values are in good agreement with the experiment [31] and MD simulation [13, 32]. Results
show that, the T-O bond length and O-T-O bond angle distribution of TOx units are undependent
minor in pressure. It means that, the topology TOx (T is Si, x=4, 5, 6 and Pb, x=4, 5, 6, 7 and 8) at
different pressure is identical. The fig.2 has a main peak except the bond-angle O–T–O distribution for
fig.2c and fig.2d, The appearance of two peaks in the case of PbOx (x= 4, 5 ,6,7 and 8).
OT3
0.8
O-Si3
a
OT4
b
Si2-O-Pb
Si-O-Pb2
OT5
fraction
0.6
0.4
0.2
0.0
Si-O-Pb3
c
Si3-O-Pb
0.8
d
Si2-O-Pb2
O-Pb5
fraction
0.6
Si-O-Pb4
Si4-O-Pb
Si2-O-Pb3
0.4
Si3-O-Pb2
0.2
0.0
-5
0
5
10
15
P(GPa)
20
25
30
35
40
-5
0
5
10
15
20
25
P(GPa)
Fig. 3. Distribution of all types of coordination units OTy
(T is Si, Pb; y= 3, 4 and 5) in liquid PbSiO3 as a function of pressure.
30
35
40
N.V. Yen et al. / VNU Journal of Science: Mathematics – Physics, Vol. 31, No. 3 (2015) 15-22
19
The fig 3a show that, at ambient pressuse, the fraction of coordination OT3, OT4 and OT5 are
about 51.03%, 18.23% and 1.01% respectively. As pressuse increases, the fraction of coor-dination
OT5 units increases. While, the fraction of coordination OT3 units decreases. The fraction of
coordination OT4 units increases to the maximum value (at pressures about 15 GPa) and then decline
with increasing pressure. At high pressure (35 GPa), the fraction of coordination OT3, TO4 and TO5
units are 5.51%, 38.83% and 42.73% respectively. Fig 3b, 3c and 3d show the distribution of all types
TOx. Fig 3b show that, at ambient pressuse, the fraction of coordination Si2-O-Pb and Si-O-Pb2 units
are 25.45%, 74.08% respectively. As pressure increases, the fraction of Si-O-Pb2 decreases. While, the
fraction of Si2-O-Pb increases. At high pressure(about 35 Gpa), this fraction is 77.17% and 8.69%
respectively. The number of O–Si3 and O-Pb3 is very small(about 15%). Fig 3c show that, at ambient
pressure, the most coordination units is Si-O-Pb3. When pressure increases, this fraction decreases. In
contrast, the fraction Si2-O-Pb2 increases When pressure increases. At high pressure(35GPa), this
fraction is 69.51%, the other type is very small. Fig 3d show that, the most coordination OT5 units are
Si-O-Pb4 and Si2-O-Pb3, the other type is very small (total about 10%). At ambient pressure, the most
coordination Si-O-Pb4 units (about 79.4%), while the fraction of Si2-O-Pb3 is 12.8%. When increases
pressuses, the fraction Si-O-Pb4 decreases. Whereas, the fraction Si2-O-Pb3 increases. At high
pressure(about 35 Gpa), the fraction Si-O-Pb4 about 29% and Si2-O-Pb3 63%.
a
b
c
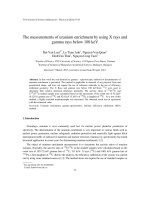
Fig. 4. Spatial distribution of (a) units SiOx;(b) units PbOx; and (c) mixture
of units SiOx and PbOx in PbSiO3. Model is constructed at 0 GPa.
Figures 4 show the spatial distribution of SiOx , PbOx and mixtures of SiOx and PbOx at different
pressures. It can be seen that, the distribution of coordination units PbOx is not uniform, but tend to
form clusters of units PbOx. Similarly, the coordination units SiOx tend to form clusters of units SiOx
and this is the origin of microphase separation.
Figure 6a shows that, the density as a function of pressure, when the pressure increases, the density
increases, the density and pressure is function linearly. The density of Pb is hight compared with other
20
N.V. Yen et al. / VNU Journal of Science: Mathematics – Physics, Vol. 31, No. 3 (2015) 15-22
metals. figure 6b shows that, The number “bridging oxygen bonds”. It means that, the SiOx units link
to each other can be symbolized by using Qn. where n represents the number of SiOx units link to each
other via a bridging oxygen bonds. In which, the value of n range from 0 to 6. It can be seen that, the
fraction of Q0 is very low(4.4%). It means that, the number oxygen are not bridging bonds very small.
At ambient pressure , The number bridging
a
b
Fig. 5. Network structure of SiOx that is extracted from PbSiO3 at ambient pressure (a); at
35 GPa(b). Regions with blue color is cluster/chain of SiO4, red color is cluster/chain of SiO6,
yellow color is cluster/chain of SiO5 units.
0
Q
1
Q
2
Q
3
Q
4
Q
5
Q
6
Q
9
0.4
3
density(g/cm )
8
fraction
7
0.2
6
5
0.0
0
10
20
30
40
P(GPa)
Fig.6a. The dependence of density on pressure.
-5
0
5
10
15
20
25
30
35
40
45
P(Gpa)
Fig.6b. The number bridging oxygen bonds.
Oxygen bonds mainly are Q1, Q2 and Q3. In which, the fraction Q2 is largest (about 38.8%). When
the pressure increases, Q1 and Q2 strongly decreases. At high pressure(about 35GPa), the fraction Q1
and Q2 are 0.1% and 3% respectively. Meanwhile, the Q3 initially increases, the maximum value about
30.7%(10GPa). Then decreases with pressure, at high pressure(about 35GPa) this the fraction is
N.V. Yen et al. / VNU Journal of Science: Mathematics – Physics, Vol. 31, No. 3 (2015) 15-22
21
12.64%. In contrast, the fraction Q4, Q5 and Q6 increases when pressure increases. At ambient
pressure, they is very small. when pressure increases, the fraction Q5 strongly decreases. At high
pressure(about 35GPa), this the fraction is 38.5%. Meanwhile, Q4 and Q6 are 27.48%, 18.25%
respectively. It means that, The number “bridging oxygen bonds” Qn change when pressure increases.
At ambient pressure, the fraction Qn mainly Q1, Q2 and Q3. At high pressure(about 35GPa), the fraction
Qn mainly Q4, Q5 and Q6. This result is in agreement, when at pressure ambient, the structure units
mainly is SiO4. At pressure 35GPa, the structure units mainly is SiO5 and SiO6(see that in the fig 5 ).
In which, fig.5a(0 GPa), mainly is the ball color blue(SiO4). Fig.5b(30 GPa). Mainly is the ball color
red and yellow(SiO5 and SiO6).
4. Conclusion
The structure of PbSiO3 comprises basic structural units TO4, TO5 and TO6 (T is Si or Pb). at low
pressure, most of structural units is TO4. When increasing pressure, the fraction of units TO4
decreases, while the fraction of SiO6 increases. At hight pressure, most of structural units is TO6. The
distribution of units SiO4, SiO5 and SiO6 are not uniform, but tend forming SiO4, SiO5 and SiO6
clusters. and this is the origin of polyamorphism in liquid PbSiO3
The SiOx is connected to each other through common O atoms “bridging oxygen bonds”. The
fraction Qn change When increasing pressure. At ambient pressure, the fraction Qn mainly Q1, Q2 and
Q3. At high pressure(about 35GPa), the fraction Qn mainly Q4, Q5 and Q6. and forming network of
SiOx units that is similar to pure silica network. However, due to the existence of Pb+2 incorporates in
to silicate network mainly via linkages Si-O-Pb, Si-O-Pb2, Si-O_Pb3 anh Si-O-Pb4 (mainly at low
pressure) and via linkages Si2-O-Pb, Si2-O-Pb3 and Si2-O-Pb4(at high pressure).
The distribution of bond length T–O and bond angle O–T–O in units TOx do not depend on
pressure. These results reveal that, the structure of TOx units does not depend on pressure. It means
that, the basic structural units TOx of different models (different densities) are identical.
Acknowledgments
This research is funded by Vietnam National Foundation for Science and Technology
Development (NAFOSTED) under Grant Number 103.05-2014.40.
References
[1] C.C.Wang, Empirical Relation between the Linear and the Third-Order Nonlinear Optical Susceptibilities, Phys.
Rev. B 2 (1970) 2045.
[2] Wiza J L, Microchannel plate detectors, Nucl. Instrum. Meth. 62 (1979) 587.
[3] A. Abbas, J. Delaye, D. Ghaleb, G. Calas, “ Molecular dynamics study of the structure and dynamic behavior
at the surface of a silicate glass” J. Non-Cryst. Solids 315 (2003) 187.
[4] H. Verweij and W.L. Konijnendijk, ‘‘Structural Units in K2O–PbO–SiO2 Glasses by Raman Spectroscopy,’’ J.
Am. Ceram. Soc., 59 [11–12] (1976) 517.
[5] A.M Zahra, C.Y. Zahra, DSC and Raman studies of lead borate and lead silicate glasses, J. Non-cryst. Solids 155
(1993) 45.
22
N.V. Yen et al. / VNU Journal of Science: Mathematics – Physics, Vol. 31, No. 3 (2015) 15-22
[6] F. Fayon, C. Bessada, D. Massiot, I. Farnan, J.P. Coutures, 29Si and 207Pb NMR study of local order in lead
silicate glasses, J.Non-Cryst. Solids 232–234 (1998) 403.
[7] F. Fayon, C. Landron, K. Sakurai, C. Bessada, D. Massiot, Pb2+ environment in lead silicate glasses probed by
Pb-LIII edge XAFS and 207Pb NMR, J.Non-Cryst. Solids 243 (1999) 39.
[8] P.W. Wang, L.P. Zhang, Structural role of lead in lead silicate glasses derived from XPS spectra J. Non-Cryst.
Solids 194 (1996) 129.
[9] H. Morikawa, Y. Takagi, H. Ohno, Structural analysis of 2PbO·SiO2 glass, J. Non-Cryst. Solids 53(1982) 173.
[10] M. Imaoka, H. Hasegawa I. Yasui, X-ray diffraction analysis on the structure of the glasses in the system PbOSiO2, J. Non-Cryst. Solids 85(1986) 393.
[11] K. Yamada, A. Matsumoto, N. Niimura, T. Fukunaga, N.Hayashi, N. Watanabe, Short Range Structural Analysis
of Lead Silicate Glasses by Pulsed Neutron Total Scattering, J. Phys. Soc. Jap 55 (1986) 831.
[12] M.L. Boucher, D.R. Peacor, The crystal structure of alamosite PbSiO3, Z. Kristallogr.126 (1968) 98.
[13] J. Rybicki, A. Rybicka, A. Witkowska, G. Bcrgmanski, A. DiCicco, M. Minicucci, G. Mancini, The structure of
lead-silicate glasses: molecular dynamics and EXAFS studies, J. Phys. CM 13 (2001) 9781.
[14] Wei Jin, Rajiv K. Kalia, Priya Vashishta, and José P. Rino, Structural transformation in densified silica glass: A
molecular-dynamics study, J P Phys. Rev. B 50 (1994) 118.
[15] Olivi-Tran N and Jullien R, Numerical simulations of aerogel sintering, Phys. Rev. B 52 (1995) 258.
[16] Valle R G D and Venuti E, High-pressure densification of silica glass: A molecular-dynamics simulation, Phys.
Rev. B 54 (1996) 3809.
[17] Rat E, Foret M, Courtens E, Vacher R and Arai M, Observation of the Crossover to Strong Scattering of Acoustic
Phonons in Densified Silica, Phys. Rev. Lett 83 (1999) 1355.
[18] Vacher R, Courtens E, Foret M, Hehlen B, Rat E, Casalta H and Dorner B, Brillouin scattering of neutrons and
X-rays from glasses, Physica B 276–278 (2000) 427.
[19] Ishikawa K, Uchiyama Y, Ogawa H and Fujimura S, Dependence of TO and LO mode frequency of thermally
grown silicon dioxide films on annealing temperature, Appl. Surf. Sci 117–118 (1997) 212.
[20] Zhu D M and Weng H F, Thermal conductivity and heat capacity study of a densified a-SiO2, J. Non-Cryst.
Solids 185 (1995) 262.
[21] Woignier T, Duffours L and Phalippou J, Irreversible volume shrinkage of silica aerogels under isostatic
pressure, J. Non-Cryst. Solids J. Non-Cryst. Solids 194 (1996) 283.
[22] Hiramatsu A, Arai M, Shibazaki H, Tsunekawa M, Otomo T, Hannon. A.C and Bennington. S.M, Investigation
on permanently densified vitreous silica by means of neutron scattering, Physica B 219–220 (1996) 287.
[23] Tan .C.Z, Arndt. J and Xie. H.S, Optical properties of densified silica glasses, Physica B 252 (1998) 28.
[24] Tan. C.Z and Arndt. J, X-ray diffraction of densified silica glass, J. Non-Cryst. Solids 249 (1999) 47.
[25] Rigato. V, Boscarino. D, Maggioni. G, Mariotto. G, Pivin. J.C and Della Mea G, Physical properties of lead-silicate
glassy thin films deposited by sputtering in Ar : H2 mixtures, Nuc. Inst.Meth. Phys. Res. B 116 (1996) 424.
[26] Hockney R W and Eastwood J W, Computer Simulation Using Particles, McGraw-Hill. New York (1981).
[27] E. Hemesath, L. R Corrales, Sensitivity of structural results to initial configurations and quench algorithms of
lead silicate glass, J. Non-Crystalline Solids 351 (2005) 1522.
[28] Agnieszka Witkowska et al, Structure of partially reduced xPbO (1−x)SiO2 glasses: combined EXAFS and MD
study, Non-crystalline Solids 351 (2005) 380-393.
[29] P.K. Hung and N.V. Hong, Simulation study of polymorphism and diffusion anomaly for SiO 2 and
GeO2liquid, Eur. Phys. J. B 71, (2009) pp 105-110.
[30] Horbach J, Th Voigtmann, The dynamics of silica melts under high pressure: mode-coupling theory results, J.
Phys. Condens. Matter, Vol. 20, No. 24, (2008) pp. 244118.
[31] Young Hoon Yeom, Yang Kim, Karl Seff, Crystal structure of Pb2+44Pb4+5Tl+18O2−17–Si100Al92O384, zeolite X
exchanged with Pb2+ and Tl+ and dehydrated, containing Pb4O4(Pb2+,Pb4+mixed)4 clusters, Microporous and
Mesoporous Materials 28 (1999) 103.
[32] G Bergmanski et al, M Bialoskórski, M Rychcik-Leyk, A Witkowska, The structure of rarefied and densified
PbSiO3 glass: a molecular dynamics study, Task quarterly 8 No 3 (2004), 393–412.