DSpace at VNU: Modification of uncertainty analysis in adapted material flow analysis: Case study of nitrogen flows in the Day-Nhue River Basin, Vietnam
Bạn đang xem bản rút gọn của tài liệu. Xem và tải ngay bản đầy đủ của tài liệu tại đây (799.46 KB, 9 trang )
Resources, Conservation and Recycling 88 (2014) 67–75
Contents lists available at ScienceDirect
Resources, Conservation and Recycling
journal homepage: www.elsevier.com/locate/resconrec
Modification of uncertainty analysis in adapted material flow analysis:
Case study of nitrogen flows in the Day-Nhue River Basin, Vietnam
Nga Thu Do a , Duc Anh Trinh b , Kei Nishida c,∗
a
b
c
Hanoi University of Science (HUS), Vietnam National University, No. 19, Le Thanh Tong, Hoan Kiem, Hanoi, Viet Nam
Institute of Chemistry, Vietnam Academy of Science and Technology (VAST), A18 – No. 18 Hoang Quoc Viet, Cau Giay, Hanoi, Viet Nam
International Research Centre for River Basin Environment (ICRE), University of Yamanashi, 4-3-11 Takeda, Kofu, Yamanashi 400-8511, Japan
a r t i c l e
i n f o
Article history:
Received 26 September 2013
Received in revised form 19 April 2014
Accepted 22 April 2014
Keywords:
Nutrient
Material flow analysis (MFA)
Monte Carlo simulation
Uncertainty
Reassessment procedure
a b s t r a c t
Nitrogen flows impacted by human activities in the Day-Nhue River Basin in northern Vietnam have
been modeled using adapted material flow analysis (MFA). This study introduces a modified uncertainty
analysis procedure and its importance in MFA. We generated a probability distribution using a Monte
Carlo simulation, calculated the nitrogen budget for each process and then evaluated the plausibility
under three different criterion sets. The third criterion, with one standard deviation of the budget value
as the confidence interval and 68% as the confidence level, could be applied to effectively identify hidden
uncertainties in the MFA system. Sensitivity analysis was conducted for revising parameters, followed by
the reassessment of the model structure by revising equations or flow regime, if necessary. The number
of processes that passed the plausibility test increased from five to nine after reassessment of model
uncertainty with a greater model quality. The application of the uncertainty analysis approach to this case
study revealed that the reassessment of equations in the aquaculture process largely changed the results
for nitrogen flows to environments. The significant differences were identified as increased nitrogen load
to the atmosphere and to soil/groundwater (17% and 41%, respectively), and a 58% decrease in nitrogen
load to surface water. Thus, modified uncertainty analysis was considered to be an important screening
system for ensuring quality of MFA modeling.
© 2014 Elsevier B.V. All rights reserved.
1. Introduction
Modeling of water quality is greatly needed for managing
aquatic environments. Uncertainty is a critical factor when the
model is applied and various types and sources of uncertainty have
been identified in previously proposed modeling approaches (Beck,
1987). The first is data inaccuracy caused by unreliable empirical
measurements made in the process of data collection. The second is data gaps due to shortages of information that occur when
employing data from different fields (Björklund, 2002; Steen, 1997;
Huijbregts, 1998; Radwan et al., 2004; Antikainen, 2007). Each of
these sources of uncertainty is common in developing countries.
Sources of uncertainty due to inaccuracy and gaps in data were
explored to establish a low-waste emission system for the agroindustry (Oenema et al., 2003). A calculation of the nitrogen budget
in a case study of the Netherlands using different data sources
indicated relatively large uncertainties, including greater than 30%
∗ Corresponding author. Tel.: +81 55 220 8593.
E-mail addresses: dothu (N.T. Do),
(D.A. Trinh), (K. Nishida).
/>0921-3449/© 2014 Elsevier B.V. All rights reserved.
variation in denitrification and leaching values. Walker and Beck
(2012) addressed resource management and environmental issues
that manipulate nutrients, water and energy flows under data
uncertainty condition in the Upper Chattahoochee Watershed in
North East Georgia, USA. The results showed that the largest degree
of uncertainty was 35% and was associated with anthropogenic
energy flow. The third and most important source of incorrect conclusions is structural bias. Such bias can be caused by simplification
in material flow analysis (MFA) modeling, especially when temporal or spatial variations are significant (Björklund, 2002). Radwan
et al. (2004) stressed the importance of and need for investigating
uncertainty due to the model structure in modeling of river water
quality. When water quality model results were compared with
measurement results, the errors were 2% for dissolved oxygen, 20%
for biochemical oxygen demand, 17% for NH4 –N and 15% for NO3 –N
in the case study. Reichert and Omlin (1997) stated that ‘neglecting
the uncertainty in the model structure leads to an underestimation of the uncertainty in model predictions’. Thus, for quantifying
uncertainty, classification of individual uncertainties of the various
sources is essential.
In the context of nutrient management in environmental sanitation systems, the adapted MFA methodology has been proposed as
68
N.T. Do et al. / Resources, Conservation and Recycling 88 (2014) 67–75
one of the most appropriate methods for reconciling with uncertain
and limited data (Montangero and Belevi, 2008). This methodology
could also trace critical sources of nitrogen by determining pollutant stocks and fluxes among environmental processes and human
activities by systemizing and reusing applicable results from previous research. Therefore, the MFA was applied to visualize and
assess environmental quality in terms of nitrogen under the influence of human activities in the old quarter of Hanoi (Montangero
et al., 2007) and in two small communes in Ha Nam Province, Vietnam (Do-Thu et al., 2011). Importance of uncertainty analysis in
MFA has been demonstrated by various researchers. For example,
nutrient flows in Danube countries and significance of uncertainties due to data inaccuracy were assessed by applying MFA coupled
with a Monte Carlo simulation. The uncertainties related to nutrients (N and P) were analyzed by traditional sensitivity analysis, and
the relative errors identified in air emissions of N and P from agriculture were about 150–200% (Buzas, 1999). In addition, adapted
MFA has been successfully applied in multi-provincial areas, such
as the Thachin River Basin in Thailand, to provide an overview of
origins and flow paths of point and non-point pollution sources (N
and P) for the entire basin (Schaffner et al., 2009, 2010a, 2010b).
The results showed that aquaculture (point source) and rice farming (non-point source) were the key sources of N and P in this river
basin, and comparison with water-quality and flow measurements
revealed that such sources were responsible for approximately 80%
of the underestimation caused by gaps and inaccuracies in data.
Sources of uncertainty were mentioned in these reports, but methods for identifying and resolving the uncertainty were lacking.
Several approaches have been employed to deal with data
uncertainty in MFA studies. The simplest is trial and error, i.e. comparing results with those of similar studies or with other sources of
data to assess reasonableness of the findings (Brunner and Baccini,
1992; Hekkert et al., 2000; Lassen and Hansen, 2000). When solving uncertainty in this manner, inconsistency in data has been
considered as an error in budget calculation. Weisz et al. (1998)
developed a cross-checking approach that employed an operating matrix for material inter-relations between the economy and
nature. This matrix was a helpful tool for establishing MFA on a
national scale. Although it enables use of a large amount of data
and can fill in data gaps, problems remain in applying the matrix to
cases of data scarcity. Budget calculations in the above-mentioned
studies could be revised; however, uncertainty in MFA has not yet
been fully analyzed.
This study aimed to analyze problems related to uncertainty of
input data and model structure by using adapted MFA for model
improvement. For this purpose, on the basis of a method proposed
previously, new criterion sets for plausibility tests and a detailed
procedure for reassessment were suggested in MFA. One of the
most severely polluted river systems in Vietnam, the Day-Nhue
River Basin (DNRB), was chosen as the case study. A number of
studies have been conducted on the current status of water quality
for the Day and Nhue rivers (Trinh et al., 2006, 2007, 2012a,b; Hanh
et al., 2009); however, research that addresses the environment of
the entire basin (atmosphere, surface water and soil/groundwater)
has not yet been conducted. As the key factors in uncertainty
analysis, an evaluation of the interactions between different activities and various environmental elements in the entire DNRB is
described here, and the critical sources of nitrogen in the system
are identified.
2. Methodology
2.1. Study area
The DNRB covers 7665 km2 of Ha Nam, Nam Dinh, Ninh Binh
Provinces, and a part of Hanoi City and Hoa Binh Province (Ministry
of Natural Resources and Environment; MONRE, 2006), with a total
population of approximately 10.5 million (GSO, 2010). At present,
this river system is under considerable pressure from socioeconomic development activities and urbanization, and the basin is
experiencing an annual population increase of about 5% (MONRE,
2006). However, the region’s infrastructure is incompatible with
rapid development (Ministry of Construction; MOC, 2009). Establishment and operation of industrial zones, craft villages, factories
and agricultural areas have caused significant changes to the natural environment, especially to water quality. The basin includes
more than 156,269 industrial, commercial and service establishments (MOC, 2009). The number of craft villages is increasing in all
provinces in the basin, with the largest number located in Hanoi
City. Agriculture is also an important activity in this basin. Approximately 50% of land in the Day–Nhue basin is used for farming
and animal production. Given the existing infrastructure resources,
solid wastes and wastewater are not yet controllable (MOC, 2009).
2.2. Data collection
A field survey was conducted in 2010 to collect general background information (social, industrial and agricultural) and environmental conditions for 2008–2010 in the study area. The most
important data were the data collected from the Vietnam General
Statistical Office (GSO, 2008–2010). Other information was in the
government reports and documents or results of projects that have
been done in the DNRB (MOC, 2009; MONRE, 2006); these were collected from Departments of Natural Resources and Environment of
five provinces in the river basin (DARDs, 2010) and from research
institutes and non-government organizations. Input data such as
population, area, number of animals and crop yields is referred to
as ‘parameters’. The parameters were categorized into two types,
certain and uncertain. In the subsequent analysis, the probability
distribution, mean and standard deviation were assumed for each
parameter on the basis of the authors’ knowledge about the data
source and the characteristics of the study site (Table 1). The normal
distribution provides a good model for parameters; when a parameter has a strong tendency to take a central value, positive and
negative deviations from this central value are equally likely. The
lognormal distribution is appropriate to represent non-negative
and positively skewed physical quantities, such as pollutant concentrations, and is particularly suitable for representing large
uncertainties (Montangero and Belevi, 2008). For parameters that
do not have a clear distribution pattern, a uniform distribution is
assigned. This categorization was originally introduced in this study
and would be useful in uncertainty analysis and model revision,
because only uncertain parameters are subject to revision when
evaluating a model. On the other hand, Monte Carlo simulation was
run automatically through whole simulation, probability distribution of model output was, therefore, generated as a result.
2.3. Model establishment
Flows among the environmental and human-related processes
in the draft of MFA system were cross-checked with observations
and short interviews with local residents and then compared with
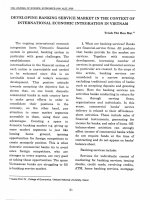
the proposed flows. For example, in Fig. 1, eleven processes related
to human activities (industrial production, agriculture and solid
waste disposal) and three processes corresponded to natural environments (atmosphere, water and soil/groundwater) in the river
basin are associated in terms of nitrogen using arrows.
After drafting model structure, model equations were added or
updated on the basis of the collected data. Two types of equations
were used in this model: balance equations and model equations
(Brunner and Rechberger, 2004). Model equations consisted of the
certain and uncertain parameters. A stock change rate (budget) of
N.T. Do et al. / Resources, Conservation and Recycling 88 (2014) 67–75
69
Table 1
List of parameters directly used in aquaculture process.
Symbol
Description of data
Data type
Unit
Statistical distribution
Mean
Value
Standard deviation (SD)
References
SD/mean (%)
S pond HN
Area of fish ponds in Hanoi
Certain
km2
Normal
129.56
GSO (2008)
10
S pond HNa
Certain
km2
Normal
58.56
GSO (2008)
10
Certain
2
km
Normal
96.77
GSO (2008)
10
Certain
km2
Normal
172.22
GSO (2008)
10
Certain
km2
Normal
10.28
GSO (2008)
10
Y fi HN
Area of fish ponds in Ha
Nam
Area of fish ponds in Nam
Dinh
Area of fish ponds in Ninh
Binh
Area of fish ponds in Hoa
Binh
Fish yield of Hanoi
Certain
t/year
Normal
31,737
GSO (2008)
10
Y fi HNa
Fish yield of Ha Nam
Certain
t/year
Normal
11,400
GSO (2008)
10
Y fi ND
Fish yield of Nam Dinh
Certain
t/year
Normal
15,300
GSO (2008)
10
Y fi NB
Fish yield of Ninh Binh
Certain
t/year
Normal
9012
GSO (2008)
10
Y fi HB
Fish yield of Hoa Binh
Certain
t/year
Normal
756
GSO (2008)
10
aN man pond
Certain
kg N/km2
Uniform
805a
MARD
(2008)
D pond
Nitrogen load in manure
supplied for fish pond per
time preparation
Depth of fish-pond
Certain
m
Uniform
1.50a
CN fish
Nitrogen content in fish
Certain
%
Normal
3.00
CN fish feed
Nitrogen content in
commercial food for fish
Certain
%
Normal
7.50
Fd pond
Frequency of sludge
removals
Uncertain
–
Lognormal
2.00
rN SL fish
Nitrogen accumulated in
fish pond sludge
Percentage of nitrogen
release from aquaculture
system
Fish feed conversion ratio
Uncertain
–
Lognormal
0.10
Uncertain
%
Lognormal
0.30
Uncertain
–
Normal
3.00
Uncertain
–
Lognormal
0.02
S pond ND
S pond NB
S pond HB
rN emis pond
rFC
e
a
b
Treatment yield in case of
sludge removal
Field observation and
interview
local
farmers
OSPAR
(2000)
OSPAR
(2000)
Field observation and
interview
local
farmers
OSPAR
(2000)
Schaffner
(2007)
OSPAR
(2000)
OSPAR
(2000)
966b
2.50b
References
Authors’
assumptions
Authors’
assumptions
Authors’
assumptions
Authors’
assumptions
Authors’
assumptions
Authors’
assumptions
Authors’
assumptions
Authors’
assumptions
Authors’
assumptions
Authors’
assumptions
MARD (2008)
Field
observation
and interview
local farmers
13
OSPAR (2000)
17
OSPAR (2000)
50
Authors’
assumptions
50
OSPAR (2000)
17
Schaffner
(2007)
10
OSPAR (2000)
5
OSPAR (2000)
Minimum values of the uniform distribution.
Maximum values of the uniform distribution.
nitrogen was calculated from balance equation for each process
in which zero budget was ideally assumed. A well-balanced budget had values of mean and standard deviation that were ±5% of
largest flow size. Herein, target substance was total nitrogen, but
the chemical forms of nitrogen were not differentiated. A modified
uncertainty analysis procedure was primarily focused, and hence
chemical speciation will be considered in the future.
2.4. Uncertainty analysis
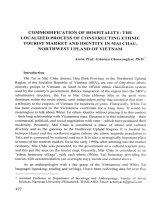
Fig. 2 shows a flow chart of the modified uncertainty analysis procedure used in the present MFA study. Model quality was
improved by adding two additional criteria in the plausibility test
and a method for identifying sensitive parameters to the process
budget. The model was further improved by classifying three types
of model uncertainty in parameter, equation and flow regime,
detailed as follows:
(a) ≥Monte Carlo simulation
The Monte Carlo simulation was run on the platform of Excel
Visual Basic Macro when conducting plausibility test or sensitivity analysis. After defining a standard deviation for each
parameter, the Monte Carlo randomly simulated the model
parameters using mean, standard deviation and the specified
probability distribution. The difference between results generated from 1000 iterations and 5000, 1 × 10⁴ , 2 × 10⁴ or 3 × 10⁴
iterations was only 1%, which is acceptable for an uncertainty
range. Then, 1000 iterations were chosen for the following
quantification. By using the parameters with 1000 iterations,
a set of 1000 budget values were calculated for each process
in the whole system. This budget set was then subjected to a
subsequent analysis using plausibility criteria.
(b) ≥Plausibility test
Montangero and Belevi (2008) primarily proposed
parameter-based criteria for improving model quality of
MFA by referring to the environmental state reports of Hanoi
City and information from previous research conducted
in Vietnam. However, even though all parameters were
70
N.T. Do et al. / Resources, Conservation and Recycling 88 (2014) 67–75
Fig. 1. Material flow analysis (MFA) system for the Day–Nhue River basin. Dashed lines represent new nitrogen flows added after field observations. Note: livestock process
(12) contains pig process (12a), poultry process (12b) and cattle process (12c) processes; field crop process (14) contains paddy (14a) and vegetable–fruit (14b).
examined within the corresponding plausible range, the
quality of whole model may not be assured. A budget-based
criterion introduced by Montangero (2006) is an alternative
to solve this problem. This criterion was developed to check
model plausibility with the assumption that there was no N
stock within the household process; to pass the plausibility
test, at least 68% of the 1000 iterated budget values (i.e. the
confidence level) should be in the range of ±15% (i.e. the confidence interval) for the total input in the process (Criterion 1).
Montangero et al. (2007) assumed that a population’s standard
deviation was 15% of the mean by considering unregistered
inhabitants in the old quarter of Hanoi. Thus, the confidence
interval might be assumed as 15% of total input. Do-Thu et al.
(2011) showed that the budget value of the household process
was highly controlled by the parameter ‘population’. However,
in the case of a larger target area with more complex systems
in a river basin, the budget value cannot be controlled by a
single influential factor such as population, but must account
for an increased number of parameters, such as number of
animals or paddy area. Therefore, two other criteria were
Input data
Running Monte Carlo simulation
Plausibility test
with proposed criteria
Fail
Running Monte Carlo simulation
Sensitivity analysis
for process budget
Checking impact of parameters
on both total input and total output in the process
No parameter reassessment is possible
Checking model equations
No equation reassessment is possible
If any reassessment is possible
Pass
Checking flow regimes
MFA results
No flow reassessment is possible
Fig. 2. Flow chart of modified uncertainty analysis in MFA. Gray boxes represent for new proposals in the procedure.
N.T. Do et al. / Resources, Conservation and Recycling 88 (2014) 67–75
71
Table 2
List of detailed balance equations and model equations for aquaculture process before and after model revision.
Nitrogen flow
dMN(13)/dt
Input
AN2–13
AN3–13
AN6–13
AN12a–13
AN12b–13
AN15–13
AN17–13
Output
AN13–6
AN13–14
AN13–15
AN13–15 a
AN13–16
AN13–16 a
AN13–17
AN13–17 a
S pond
Y fish
a
Equation (Unit: tN/year)
=AN2–13 + AN3–13 + AN6–13 + AN12–13 + AN15–13 + AN17–13 − AN13–6 − AN13–14 − AN13–15 − AN13–16 − AN13–17
See Onsite sanitation (2)
See Drainage (3)
=Y fish × rFC × CN fish feed × 10−2
=aN man pond × S pond × Fd pond × 10−3
See Poultry (12b)
=S pond × D pond × (1 + ET/P) × CN river
=S pond × P × CN rain × 10−3
=Y fish × CN fish × 10−2
=(AN2–13 + AN6–13 + AN12–13 – AN13–6 ) × rN SL fish × Fd pond
=(AN6–13 − AN13–6 ) × (1 − e)
=(AN2–13 + AN6–13 + AN12–13 − AN13–6 ) × (1 – rN SL fish × Fd pond – rN leach paddy – rN emis pond)
=AN6–13 × rN leach paddy
=(AN2–13 + AN6–13 + AN12–13 –AN13–6 ) × rN leach paddy
=AN6–13 × rN emis pond
=(AN2–13 + AN6–13 + AN12–13 – AN13–6 ) × rN emis pond
=S pond HN + S pond HNa + S pond ND + S pond NB + S pond HB
=Y fi HN + Y fi HNa + Y fi ND + Y fi NB + Y fi HB
Equation after reassessment.
newly proposed and compared with the previously proposed
one.
In MFA, output was traditionally estimated on the basis of
input, as shown in Table 2 (AN13–16 and AN13–17 ), but output
should periodically be independently quantified, as presented
in Do-Thu et al. (2011). Therefore, it was necessary to assess the
uncertainty of output and input simultaneously. In the second
criteria, the confidence interval was ±15% of the averaged value
of input and output, and the confidence level was 68% (Criterion
2). Therefore, this criterion could assess the flow-size-based
budget balance of inputs and outputs in the process.
Criteria 1 and 2 examined the budget value based on flow
size of a process, total input or both total input and output,
respectively. However, large-sized flows may allow the process budget to pass the plausibility test even though the budget
value is imbalanced because of problems in the model structure.
The 68% confidence level, which was initially set by Montangero
et al. (2007), corresponded to one standard deviation of the
theoretical normal distribution. Therefore, the third criterion
was proposed, with one standard deviation of the budget value
as the confidence interval and 68% as the confidence level
(Criterion 3). The error of each parameter accumulated in the
standard deviation of the budget value would also be considered, thus, this criterion could better identify hidden problems
in the model. Finally, Criteria 1, 2 and 3 would be tested in this
study as an example of a model-improvement method.
(c) ≥Sensitivity analysis for process budget
In traditional concept of adapted MFA, sensitivity analysis for
environmental impacts is needed for identifying the influential parameters on outflows to environments, and ultimately,
for reducing requirements for data collection (Montangero and
Belevi, 2008). Herein, the sensitivity analysis was applied to
reduce uncertainty in parameter that caused imbalance of process budgets and failures in the plausibility test. This analysis
was performed to quantify the effect of a 10% increase in the
mean value of each parameter on the respective process’ total
input and total output and to identify the parameters that were
sensitive to total input and total output for reassessment in the
following step.
(d) ≥Reassessment of model
If any process failed the plausibility test, that process was
reassessed by verifying uncertain parameter as determined by
literature reviews, model equations and flow regimes. Firstly,
the sensitive and uncertain parameters were identified by
sensitivity analysis for each individual process. To improve
the pass rate in the plausibility test, the sensitive parameters were replaced by the ones from area which had similar
social–physical conditions as the study site in the parameter
reassessment. If parameter reassessment was not possible, the
model equation and flow regime were reassessed accordingly.
This procedure was repeated until the process passed the plausibility test or no further reassessment was possible. All of the
nitrogen flows would be finalized with mean and standard deviation values after the reassessment procedure.
3. Results
3.1. Model establishment
The draft of the MFA system for the entire DNRB was carefully
cross-checked by field survey. As can be observed in Fig. 1, 14 new
flows were added, and 6 flows were updated. A water supply process (5) was removed for model simplification because of its minor
impacts to surrounding environments and to other processes of the
entire system in terms of nitrogen load. Also, the grassland process
(7) and forest process (8) were combined into forest–grassland process (8), and craft village (9) and industry (10) were combined into
industry (10) because of their similar roles in the MFA system. The
collected data and detailed equations to simulate nitrogen flows, for
example, between the aquaculture process and the natural environments (atmosphere, surface water and soil/groundwater) or other
processes, are shown in Tables 1 and 2, respectively.
3.2. Uncertainty analysis
(a) ≥Plausibility test results for three different criterion sets
Table 3 shows pass rates for all processes before and after
reassessment. For Criteria 1, 2 and 3, the confidence intervals were ±15% of the total input, ±15% of the average input
and output and ±one standard deviation of the nitrogen budget, respectively. Unlike Criteria 1 and 2, the forest–grassland
process passed the test for Criterion 3 without need for revision because the standard deviation of its budget (638 ± 1153 t
N/year) was about twenty times the value of 15% of the total
input (384 ± 20 t N/year). Therefore, the pass rate increased
naturally.
72
N.T. Do et al. / Resources, Conservation and Recycling 88 (2014) 67–75
Table 3
Results of the plausibility test for all processes: percentages of the estimated budget within confidence intervals (pass rate) before (a) and after (b) reassessment.
Process
Household (1)
On-site sanitation system (2)
Drainage (3)
Solid waste collection (4)
Market (6)
Forest–grassland (8)
Industry (10)
Solid waste disposal place (11)
Pigs (12a)
Poultry (12b)
Cattle (12c)
Aquaculture (13)
Paddy (14a)
Vegetable-fruit (14b)
Criterion 1
Criterion 2
Criterion 3
(a)
(b)
(a)
(b)
(a)
(b)
86
100
100
22
0
28
0
4
60
49
76
0
57
1
86
100
100
22
0
29
0
4
77
74
76
96
82
92
86
100
100
24
0
28
0
1
40
46
74
0
33
0
86
100
100
24
0
29
0
1
77
74
74
94
82
88
77
100
33
42
0
75
0
24
42
46
70
0
69
6
77
88
33
42
0
75
0
24
69
68
70
74
71
82
Notes: Criteria 1, 2 and 3 represent three different criterion sets, where confidence intervals were ± 15% of total input, ± 15% of averaged input and output and ± one standard
deviation of the budget, respectively. The confidence level was 68% in all cases. Pass rates of processes greater than 68% are indicated in bold.
Fig. 3 and Table 3 show probability distributions of the budgets and pass rates of the processes in the plausibility tests,
respectively. The budget for the drainage process was well
balanced (−2771 ± 1319 t N/year), indicating that the process
could pass the test for Criterion 2 without reassessment. Owing
to a large flow size (e.g. wastewater flow from onsite sanitation process to drainage process, 36,760 ± 4699 t N/year), the
drainage process was able to pass Criterion 1 without reassessment. However, the standard deviation of the budget was also
small, and the budget value was negatively skewed; therefore,
the drainage process had less chance to pass the test for Criterion 3. Similarly, the budget for the solid waste collection
process was well balanced (2040 ± 1467 t N/year). However,
this process did not pass the test for any criterion because of
a small flow size. In addition, the pass rate for Criterion 3 was
higher than those for Criterion 1 or 2, implying that Criterion 3
could better evaluate the quality of the model structure without
being impacted by flow size. Therefore, the uncertainty analysis
under Criterion 3 would be considered as representative.
In short, 9 out of 14 processes failed the plausibility test for
Criterion 3 before reassessment (Table 3). The drainage, solid
waste collection, market, industry and solid waste disposal
place processes could not be thoroughly reassessed owing to
data shortage. However, the agricultural processes, pig, poultry,
aquaculture and vegetable–fruit, could be reassessed.
(b) ≥Sensitivity analysis and reassessment of parameters
As can be seen in Table 3, the pig process had to be reassessed
owing to a pass rate of less than 68% of the confidence level
(42%). Therefore, sensitivity analysis was conducted for this
process. The most sensitive parameters were number of pigs
and daily nitrogen load in pig manure. However, these two
parameters were certain type; and thus were not subject to
revision. The most sensitive parameter among all the uncertain
parameters in this process was the ratio of nitrogen gas losses
to the nitrogen content in pig manure. The statistical value of
this parameter was replaced with a value obtained from a literature review (Ruettimann and Menzi, 2001). The pass rate then
increased to 69% and passed the plausibility test. Similar to the
pig process, the statistical value of the parameter represents the
ratio of nitrogen gas losses to the nitrogen in chicken manure
in the poultry process was replaced with a value obtained from
another study (Schaffner, 2007). The pass rate of this process
then increased from 46% to 68% and passed the plausibility test.
(c) ≥Reassessment of model equations
The 0% pass rate for all criteria indicated that the model
equations should be used to reassess the aquaculture process
because the pass rate could not be increased by parameter
revision after reassessing the uncertain parameters in this
process. Besides, the estimated mean budget was very positive (31,204 t N/year) and was much higher than the standard
deviation (4676 t N/year). Therefore, it was assumed that the
total nitrogen output from aquaculture was underestimated.
Of the five outputs from aquaculture, the three relevant to the
environment, runoff (AN13–15 ), leaching (AN13–16 ) and evaporation (AN13–17 ), were reassessed. In this reassessment, the
following flows were considered in the output: wastewater
leaching from the drainage system (AN3–13 ) to aquaculture,
sludge from onsite sanitation systems (AN2–13 ), manure from
pigs and poultry used as fish feed (AN12a–13 , AN12b–13 ) and river
water and rain (AN15–13 , AN17–13 ). Drainage wastewater, river
water and rain, as liquid states, amounted to 4898 ± 903 t/year,
contributing only 15% of the total N input in aquaculture. The
Fig. 3. Results of the plausibility test for drainage process and solid waste collection process after all model revisions. The values between broken lines represent confidence
intervals of three criteria: dashed, solid and bold lines denote Criteria 1, 2 and 3, respectively.
N.T. Do et al. / Resources, Conservation and Recycling 88 (2014) 67–75
nitrogen load from aquaculture to surface water (AN13–15 ) was
calculated on the basis of the method of OSPAR (2000), by
incorporating commercial fish feed (AN6–13 ) and treatment efficiency of the pond (e). Only commercial feed was used for fish at
the OSPAR pilot scale, but fishes farmed in the river basin were
also fed manure. Therefore, AN2–13 , AN12a–13 and AN12b–13 were
required in addition to AN6–13 , and the equations for AN13–15 ,
AN13–16 and AN13–17 would be revised as described in Table 2.
Instead of using treatment efficiency, nitrogen loss through
runoff was quantified on the basis of the law of conservation
of mass. After making revisions as shown in Table 2, the aquaculture process had a 74% pass rate and passed the plausibility
test.
(d) ≥Reassessment of flow regimes
The pass rate was 6% for the vegetable–fruit process; thus,
this process failed the plausibility test. Parameter reassessment was then conducted, but no improvement of the pass
rate was possible by parameter or equation only; thus, the
flow regimes were reconsidered. To include an additional output flow from residues of soybean, peanut, corn, vegetables
and fruit remaining in the field (AN14b–16 ), five corresponding
parameters were obtained from the literature (IFA, 2006). After
revision, the vegetable–fruit process passed the test with an
82% pass rate.
73
respectively. Although aquaculture contributed only 7% of the total
load to atmosphere, it contributed 61% of the total nitrogen load
to surface water. Field crop contributed only 8% of the total load
to surface water, however, it discharged 60% of the total load to
the soil/groundwater environment while aquaculture and livestock
contributed only 5% and 19%, respectively.
The five processes that failed the plausibility test (drainage, solid
waste collection, market, industry and solid waste disposal place)
were examined. Solid wastes or wastewater from the solid waste
collection process was transported to solid waste disposal place
and wastewater from market was transported to drainage. Their
outflows to environments were then assessed in these destination
processes. Industrial solid waste was burnt and then emitted to
the atmosphere, and it contributed to 5% of the total annual N discharged. Industrial wastewater (2758 ± 407 t N/year) was entirely
connected to drainage and contributed to only 4% of the total N
input to drainage annually. The outflows from solid waste disposal
place to the atmosphere or to soil/groundwater were 327 ± 23 or
0.39 ± 0.4 t N/year, respectively. The drainage process was responsible for 26%, 31% and 8% of total N load to the atmosphere, surface
water and soil/groundwater, respectively.
4. Discussion
4.1. Uncertainty analysis
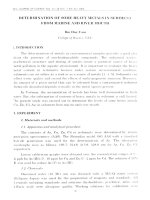
3.3. Effect of uncertainty analysis on outflows to environments
The outflows to environmental processes were determined after
the reassessment of parameters, equations and flow regimes in
MFA. Version 1 was the result prior to reassessment. Versions
2.1, 2.2 and 2.3 resulted from a reassessment of pig and poultry, aquaculture and vegetable–fruit processes, respectively. Fig. 4
demonstrates the variability of nitrogen load to the surrounding
environments in the three versions of the modified model. By
revising parameters in pig and poultry, the nitrogen load to the
atmosphere, surface water and soil/groundwater decreased by 5%,
2% and 2%, respectively, compared to Version 1. Altering the model
equations was the secondary choice used to compensate for the
variability of target results. By revising the equations for aquaculture, in Version 2.2, the nitrogen loads to the atmosphere and
soil/groundwater increased by 17% and 41%, respectively, and the
load to surface water decreased by 58%. In Version 2.3, the nitrogen
loads to the atmosphere and soil/groundwater decreased by 4% and
1%, respectively, and increased by 2% to surface water by revising
the flow regimes for the vegetable–fruit process.
After all revisions were complete, outflows to environments
were quantified again. Field crop and livestock contributed 33%
and 29% of the total nitrogen load to the atmosphere every year,
Fig. 4. Nitrogen load to the environment (t/year) in four model versions. White,
gray and black bars represent nitrogen loads to the atmosphere, surface water and
soil/groundwater, respectively. Version 1 shows results before reassessment; Version 2.1 includes the revised parameters for both pig and poultry processes; Version
2.2 includes the revised equations for aquaculture process; Version 2.3 includes the
revised flow regime for vegetable–fruit process.
(a) ≥Setting criteria
In the case study of the old quarter of Hanoi, the market
process was defined as a ‘platform’ for nitrogen exchange in
the entire MFA system, where inter-boundary flows were not
yet determined (Montangero et al., 2007). Similarly, herein,
the drainage and solid waste collection processes may be considered as ‘platforms’ for internal exchange of nitrogen in the
system. Therefore, it was acceptable for these processes not to
pass the plausibility test because their inputs and outputs were
indirectly estimated, and as a result contained many uncertainties from other processes.
As shown in Table 3, the pass rates of processes for Criterion
2 were smaller than those for Criterion 1 prior to reassessment in most cases, implying that Criterion 2 was stricter than
Criterion 1. In general, Criteria 1 and 2 shared the concept of
considering the impact of flow size on the balance of the nitrogen budget. Therefore, in the cases of solid waste collection,
forest–grassland and solid waste disposal place processes, flow
sizes were small and resulted in poorer pass rates. In contrast,
the pass rate for Criterion 3 was significantly higher than those
of Criteria 1 and 2 for those three processes. The pass rate
for Criterion 3 was smaller than those for Criteria 1 and 2 for
almost all of the processes such as household, onsite sanitation system, drainage, pig, poultry, cattle, aquaculture, paddy
and vegetable–fruit; pass rates for processes such as market
and industry were similar for the three criteria. These results
demonstrated that Criterion 3 could better evaluate model
quality, because the pass rate was not impacted by flow size.
(b) ≥Reassessment of the model
For improving model quality, parameters would initially be
reassessed by applying sensitivity analysis to the process budget. Parameters were classified into two types: certain and
uncertain on the basis of the authors’ knowledge about the
data source and the characteristics of the study site. The certain
parameters, population, number of animals and paddy area,
were mostly collected from governmental offices (GSO, MOC,
MONRE, MARD). The uncertain parameters, including ratio of
wastewater from drainage system to aquaculture and ratio
of nitrogen leaching to soil to the total nitrogen applied in
a paddy, were collected from field observation, interviews or
74
N.T. Do et al. / Resources, Conservation and Recycling 88 (2014) 67–75
other research and websites. Only the most sensitive parameters among uncertain types were revised.
Parameter reassessment was possible for four processes: pig,
poultry, aquaculture and vegetable–fruit. However, only two
processes, pig and poultry, passed the test; further reassessment of model equations would be required for the remaining
two processes. As can be seen in the revision of the aquaculture process in Table 2, equations used to estimate outflows to
environments (air, surface water and soil/groundwater) were
re-evaluated. Nitrogen flows from aquaculture to surrounding
environments were all quantified on the basis of net nitrogen
input and output as solid states, e.g. fish feed and fish production. Liquid states, such as drains, rivers and rainwater, were
not included in this version of the reassessment; however, their
contribution to the total N input in aquaculture was very small,
contributing to only 15% of the total input of aquaculture. Therefore, outflow was slightly underestimated. Table 3 revealed that
the pass rates of the aquaculture and vegetable–fruit processes
prior to reassessment were very small, 0% and 6%, respectively.
This implied that the pass rate could not be improved by the
parameters but that the equation and flow regime would need
to be reassessed.
hidden uncertainties in the MFA system. Sensitivity analysis was
conducted for revising parameters, followed by model structure
reassessment by revising equations or flow regime, if necessary.
It is reasonable to conclude that uncertainty analysis played an
important role in evaluating accuracy of the model structure
and reliability of input data, which were very important in the
cases of data scarcity and uncertainty. Prioritizing reassessment of
sensitive and uncertain parameters, equations and flow regimes is
effective for saving time and expense in developing countries.
Based on the modification of uncertainty analysis, outflows to
environments were calculated by MFA. Agricultural processes were
the most significant nitrogen sources for the atmosphere, surface water and soil/groundwater, probably because of excessive
application of fertilizer or misappropriate treatment of manure.
Drainage process could also have a large impact on outflow to
environment. The results imply practical usefulness when the
model is applied for river basin management, thus the environmental effects, as well as the chemical speciation, should be further
explored in the future. In summary, uncertainty analysis is a
screening system for ensuring quality of MFA modeling. Model
accuracy may be validated in more direct ways, such as by comparison to observation-based data, but this requires additional efforts
for data collection and analysis.
4.2. Effect of uncertainty analysis on outflows to environments
Acknowledgements
Radwan et al. (2004) concluded that model input needed the
greatest attention, followed by model parameters and model structure. In the case study of Molenbeek sub-catchment, Belgium, the
results showed that the percentage of model input contribution
to the total uncertainty was 61% for dissolved oxygen (DO), 56%
for biochemical oxygen demand (BOD), 56% for NH4 –N and 72%
for NO3 –N. Schaffner et al. (2009, 2010a, b) applied adapted MFA
in the Thachin River Basin in Thailand. The results showed that
point and non-point pollution sources from the entire basin were
responsible for approximately 80% of the underestimation caused
by gaps and inaccuracies in input data. In this study, the effects
of uncertainty analysis on outflows to environments were clearly
shown in Fig. 4. Version 1 was the result prior to reassessment. Versions 2.1, 2.2 and 2.3 resulted from a reassessment of parameters,
model equations and flow regimes, respectively. However, in contrast to the conclusions of Radwan et al. (2004) or Schaffner et al.
(2009, 2010a,b), Fig. 4 demonstrates that equation reassessment
affected the variability of the results the most and that parameter
or flow-regime reassessment was less effective in the case study
of the DNRB. Modified uncertainty analysis was the first screening
for model quality, and was useful to identify the problems of both
parameter and model structure in the MFA system.
Outflows to environments from the five processes that failed
the plausibility test were quantified. Solid wastes or wastewater
from the solid waste collection or market was transported to the
solid waste disposal place and to drainage, respectively. Their outflows were then assessed in these destination processes. Impacts
of industry and solid waste disposal place to surrounding environments were small. However, the drainage process was the only
process among the five that made a major contribution to the nitrogen load to surrounding environments. Platform process could have
a large impact if it has direct outflows to environments despite of
the higher uncertainty.
5. Conclusions and recommendations
This paper proposed a modified uncertainty analysis procedure
in MFA and its importance for assessing the obtained results.
Among three different criterion sets, the third criterion with
a standard deviation could be applied to effectively identify
We gratefully acknowledge Dr. Ishidaira Hiroshi for helpful
advice about uncertainty analysis. We are grateful to Dr. Kazama
Futaba for basic information on nitrogen cycles in field crops. We
also acknowledge Dr. Sakamoto Yasushi and Dr. Shindo Junko for
their assessments of the research methodology. We acknowledge
local authorities in the Chuong My district, Ha Noi, Cao Phong District, Hoa Binh Province, Kim Bang district, Ha Nam Province, and Vu
Ban district, Nam Dinh Province for their cooperation in collecting
data and interviewing local residents. The study presented here was
supported by the Global COE Program ‘Evolution of Research and
Education on Integrated River Basin Management in Asian Region’
from the Ministry of Education, Culture, Sport, Science and Technology of Japan.
Appendix A. Supplementary data
Supplementary data associated with this article can be found,
in the online version, at />2014.04.006.
References
Antikainen R. Substance flow analysis in Finland – four case studies on N and P flows.
Monographs of the boreal environmental research. Finland: Finnish Environment Institute; 2007.
Beck MB. Water quality modeling: a review of the analysis of uncertainty. Water
Resour Res 1987;23(8):1393–442.
Björklund AE. Survey of approaches to improve reliability in LCA. Int J Life Cycle
Assess 2002;7(2):64–72.
Brunner PH, Baccini P. Regional material management and environmental protection. Waste Manage Res 1992;10:203–12.
Brunner PH, Rechberger H. Practical handbook of material flow analysis. Advance
methods in resource and waste management. US: Lewis Publishers; 2004.
Buzas K. Nutrient balances of the Danube basin: the role of uncertainties. Water Sci
Technol 1999;40(10):51–8.
DARDs. Guidance of chemical fertilizers utilization. Departments of Agriculture and
Rural Development (DARDs) in Chuong My district, Ha Noi capital and Vu Ban
district, Nam Dinh province; 2010 (in Vietnamese).
Do-Thu N, Morel A, Nguyen-Viet H, Pham-Duc P, Nishida K, Kootattep T. Assessing
nutrient fluxes in a Vietnamese rural area despite limited and highly uncertain
data. Res Conserv Recycl 2011;55(9–10):849–56.
GSO. Statistical year book of Ha Noi, Ha Nam, Nam Dinh, Ninh Binh, Hoa
Binh province. Vietnam General Statistical Office; 2008–2010 .
gov.vn/
N.T. Do et al. / Resources, Conservation and Recycling 88 (2014) 67–75
Hanh PTM, Suthipong S, Kim KW, Dang TB, Nguyen QH. Anthropogenic influence
on surface water quality of the Nhue and Day sub-river systems in Vietnam.
Environ Geochem Health 2009;32(3):227–36.
Hekkert MP, Joosten LAJ, Worell E. Analysis of the paper and wood flow in the
Netherlands. Res Conserv Recycl 2000;30(1):29–48.
Huijbregts M. Application of uncertainty and variability in LCA. Part I: a general
framework for the analysis of uncertainty and variability in life cycle assessment.
Int J Life Cycle Assess 1998;3(5):273–80.
International Fertilizer Industry Association (IFA). World fertilizer use manual; 2006
/>Lassen C, Hansen E. Paradigm for substance flow analysis. Guide for SFAs carried out
for the Danish EPA. Environmental project no. 577, Danish EPA; 2000.
MARD. Guidelines of fertilizers application for rice. Vietnam Ministry of Agriculture
and Rural Development; 2008 />MOC. Monitoring, planning and managing solid wastes in provinces of Day-Nhue
River Basin toward year 2020. Vietnam Ministry of Construction;2009.
MONRE. State of environment in Vietnam, 2006. Vietnam Ministry of Natural
Resources and Environment; 2006.
Montangero A. (PhD thesis) Material flow analysis for environmental sanitation
planning in developing countries: an approach to assess material flows with
limited data availability (PhD thesis). Leopold – Franzens – University Innsbruck;
2006.
Montangero A, Cau LN, Viet-Anh N, Tuan VD, Nga PT, Belevi H. Optimizing water
and phosphorus management in the urban environmental sanitation system of
Hanoi, Vietnam. Sci Total Environ 2007;384(1–3):55–66.
Montangero A, Belevi H. An approach to optimise nutrient management in
environmental sanitation systems despite limited data. J Environ Manage
2008;88:1538–51.
Oenema O, Hans K, Wim V. Approach and uncertainties in nutrient budgets:
implications of nutrient management and environmental policies? Eur J Agron
2003;20(1–2):3–16.
OSPAR. Development of HARP guidelines: harmonised quantification and reporting
procedures for nutrients. The Oslo and Paris Commissions’ Action Plan (OSPAR);
2000.
Radwan M, Willems P, Berlamont J. Sensitivity and uncertainty analysis for river
quality modeling. J Hydroinform 2004;6:83–99.
75
Reichert P, Omlin M. On the usefulness of over-parameterized ecological models.
Ecol Modell 1997;95(1997):289–99.
Schaffner M. (PhD thesis) Applying a material flow analysis model to assess river
water pollution and mitigation potentials: a case-study in the Thachin River
Basin, Central Thailand (PhD thesis). University of Bern; 2007.
Schaffner M, Bader HP, Scheidegger R. Modeling the contribution of point sources
and non-point sources to Thachin River water pollution. Sci Total Environ 2009;
407(17):4902–15.
Schaffner M, Bader HP, Scheidegger R. Modeling the contribution of pig farming
to pollution of the Thachin River. Clean Technol Environ Policy 2010a;12(4):
407–25.
Schaffner M, Bader HP, Scheidegger R. Modeling non-point source pollution from rice
farming in the Thachin River Basin. Environ Dev Sustain 2010b;13(2):403–22.
Steen B. On uncertainty and sensitivity of LCA-based priority setting. J Clean Prod
1997;5(4):255–62.
Trinh AD, Georges V, Marie PB, Nicolas P, Vu DL, Le LA. Experimental investigation and modelling approach of the impact of urban wastewater on a tropical
river; a case study of the Nhue River, Hanoi, Viet Nam. J Hydrol 2007;334:
347–58.
Trinh AD, Marie PB, Georges V, Chau VM, Nicolas P, Loi VD, et al. Biochemical
modeling of the Nhue River (Hanoi Vietnam) Practical identifiably analysis and
parameters estimation. Ecol Model 2006;193:182–204.
Trinh AD, Meysman F, Rochelle-Newall E, Bonnet MP. Quantification of
sediment–water interactions in a polluted tropical river through biogeochemical modeling. Global Biogeochem Cycles 2012a;26(3)., />1029/2010GB003963.
Trinh AD, Vu DL, Ta TT. Partition of heavy metals in a tropical river system impacted by municipal waste? Environ Monit Assess 2012b;185(2):
1907–25.
Walker RV, Beck MB. Understanding the metabolism of urban–rural ecosystems. A
multi-sectoral systems analysis. Uran Ecosyst 2012;15:809–484.
Weisz H, Schandl H, Fischer-Kowalski M. OMEN – an operating matrix for material
interrelations between the economy and nature. How to make material balances
consistent. In: Ecologizing societal metabolism. Designing scenarios for sustainable materials management. CML report 148. Leiden: Leiden University, Centre
of Environmental Science; 1998.