DSpace at VNU: Assessing Customer Satisfaction and Service Quality A Vietnamese Context
Bạn đang xem bản rút gọn của tài liệu. Xem và tải ngay bản đầy đủ của tài liệu tại đây (255.17 KB, 16 trang )
VNU Journal of Science: Economics and Business, Vol. 30, No. 2 (2014) 39-54
Assessing Customer Satisfaction and Service Quality
A Vietnamese Context
Phạm Thị Liên*, Nguyễn Thị Ngọc Anh ác
VNU University of Economics and Business,
144 Xuân Thủy Str., Cầu Giấy Dist., Hanoi, Vietnam
Received 22 June 2014
Revised 28 June 2014; Accepted 11 July 2014
Abstract: Service quality and its relationship with customer satisfaction has received considerable
academic and business attention in recent years. But the nature of the relationship between these
two constructs is not well-explained in the literature. This study used the SERVPERF model as
proposed by Cronin & Taylor (1992) to assess perceived service quality in a Vietnamese
organization, and then studied the relationship between organization’s service quality and
customer satisfaction. Based on the results of a customer survey, the study identified five
components - TA-EM (tangible-empathy factor), RESPONSIVENESS (the willingness or
readiness of employees to help customers and provide services), RELIABILITY, ASSURANCE
and IMAGE - which explain customer perception of service quality. The relationship between
these service quality components and customer satisfaction is also investigated through regression
analysis. It is found that these five components of service quality have a positive relationship with
customer satisfaction in which TA-EM has the most significant impact on customer satisfaction
level. The results showed that 64 percent of the variance in customer satisfaction can be explained
by these five variables. In addition, based on these findings, the study also gives some suggestions
for Vietnamese organizations to further improve service quality and customer satisfaction level.
Keywords: Service quality, customer satisfaction, SERVPERF model.
1. Introduction *
enhance customer care, bringing in revenue
estimated at 21,000 billion VND - a growth of
15 percent. On the other hand, the non-life
insurance sector overcame difficulties and
challenges, with a revenue estimated at 23,600
billion VND - an increase of 8 [1].
In Vietnam in 2013, the life insurance
market was not competitive. There were
pressures due to the population’s idle money
deposited in banks, securities investment, and a
decrease in real estate value. At the same time
people saw risks when the financial crisis
occurred in Europe. The Life Insurance sector
seized the opportunity to develop products and
This study examines services at the Bao
Viet Life (BV), using the SERVPERF model
[2] to assess the perceived service quality of the
BV Life Corporation, and then researches the
relationship between service quality and
customer satisfaction. The research uses
_______
*
Corresponding author. Tel.: 84-983820460
E-mail:
39
40
P.T. Liên, N.T.N. Anh / VNU Journal of Science: Economics and Business, Vol. 30, No. 2 (2014) 39-54
quantitative methodology and the strategy of
the inquiry is through survey. The research was
carried out at branches of BV Life at 6 cities in
Vietnam. Data collected from this survey was
analyzed by SPSS 16.0 in order to find out
customers’ assessments of BV Life’s service
quality, and the relationship between this
assessment result and customer satisfaction.
This paper is divided into 7 main parts.
Besides this introduction, Section 2 provides a
literature review for the study. The research
methodology is described in Section 3. Section
4 presents the research analysis and results,
which are followed by findings and discussion
in Section 5. After presenting the limitations
of the study and suggestions for further
research in Section 6, the paper provides a
conclusion in Section 7.
2. Literature
framework
review
and
conceptual
2.1. Service quality and customer satisfaction
a. Service quality
Services are one of the two key components
of economics - the other being goods - and they
are consumed at the point of sale. Philip Kotler
defined a service as a product that consists of
any activity, benefit or satisfaction that one
party can offer to another for sale. Services are
essentially intangible and do not result in the
ownership of anything [3].
The American Society for Quality gave the
definition of quality as “the totality of features
and characteristics of a product or service that
bears on its ability to satisfy stated or implied
needs” [4].
Service quality was defined by Kotler et al.,
2005 as the ability of a service to perform its
functions including the overall durability,
reliability, precision, ease of operation and
repair, and other valued attributes.
Measuring quality in the service sector is
more difficult than measuring quality in the
manufacturing
sector
because
quality
evaluations are not made solely on the outcome
of a service; they also involve evaluations of the
process of service delivery. One of many
service quality research models in use in the
world nowadays is the SERVPERF scale
proposed by Cronin and Taylor (1992). This
scale is based on the SERVQUAL scale [5]
which assesses service quality through the gaps
between customer “expectations” - (E) and
“perceptions” - (P). However, SERVQUAL has
been criticized for its confusion, and
SERVPERF was proposed by Cronin and
Taylor (1992) in which “expectation” - (E)
component of SERVQUAL was discarded and
replaced by “performance” [2]. The (P)
component alone is used. Cronin and Taylor
provided empirical evidence across four
industries: namely, banks, pest control, dry
cleaning, and fast food to corroborate the
superiority of their “performance - only”
instrument [6]. The scale measures performance
with five service quality components termed
Tangible,
Reliability,
Responsiveness,
Assurance, and Empathy [5]:
- Tangible: physical evidences of the
service such as appearance of physical
facilities, equipment, personnel, etc
- Reliability: ability to perform the
promised service dependably and accurately
- Responsiveness: willingness of employees
to help customers and provide services
- Assurance: knowledge and courtesy of
employees and their ability to convey trust and
confidence
- Empathy: is individualized care and
attention that the firm provides to its customers
P.T. Liên, N.T.N. Anh / VNU Journal of Science: Economics and Business, Vol. 30, No. 2 (2014) 39-54
b. Customer satisfaction
The definition of customer satisfaction has
been widely debated as organizations
increasingly attempt to measure it. Customer
satisfaction can be experienced in a variety of
situations and connected to both goods and
services. It is a highly personal assessment that
is greatly affected by customer expectations [7].
Philip Kotler defined customer satisfaction as
the extent to which a product’s perceived
performance matches a buyer’s expectations. If
the product performance falls short of
expectations, the buyer is dissatisfied. If
performance matches or exceeds expectations, the
buyer is satisfied or delighted [3].
Customer satisfaction is an important
theoretical as well as practical issue for marketers
and consumer researchers. Customer satisfaction
can be considered as the essence of success in
today’s highly competitive world of business [8].
c. Relationship between service quality and
customer satisfaction
Parasuraman stated that there is a distinction
between service quality and customer satisfaction:
perceived service quality is a global judgment or
attitude relating to the superiority of the service,
whereas customer satisfaction is related to a
specific transaction [5].
However, many researchers have stressed
the positive relationship between service
quality and customer satisfaction [9]. Brady
and Robertson (2001) conducted research
about fast food restaurants in America and
Latin America [10]. The results indicated that
there was a certain relationship between
service quality and customer satisfaction. In
addition, Ruyter et al., (1997) tested the health
care service and attempted to determine the
relationship between service quality and
customer satisfaction [11]. The results
suggested that service quality should be treated
41
as an antecedent of customer satisfaction.
From these researches, it can be concluded that
service quality and customer satisfaction have
a positive relationship in which service quality
is an antecedent as well as an important factor
impacting on customer satisfaction.
2.2. Research model and hypothesis
a. Research model
SERVPERF is one of the popular models
measuring service quality in the world. It was
used in research such as “SERVPERF analysis
in retail banking” by Vanniarajan et al. (2007)
[8]; “SERVPERF Analysis in Banking
Services” by M.Muzaffar Zahoor; “Measuring
information science system service quality with
SERVQUAL: Users’ perceptions of relative
importance of the five SERVPERF dimensions”
by Hollis Landrum et al. (2009) [12].
This study will use the SERVPERF scale to
measure perceived performance of an insurance
service. Six components of service quality are
Tangible,
Reliability,
Responsiveness,
Assurance, Empathy and Image:
- Tangible: the appearance of BV Life
Corporation’s staff, physical facilities at
branches, materials provided for customers
- Reliability: ability to perform services
accurately and on time right at the first time
- Responsiveness: willingness to provide
services and help customers
- Assurance: the trust in the service, trust in
employees’ professional skills as well as
serving attitude
- Empathy: attention and care to each
individual customer
- Image: success, reputation, brand and
social responsibility of the Corporation
- The SERVPERF score which represents
the perceived performance of components of
P.T. Liên, N.T.N. Anh / VNU Journal of Science: Economics and Business, Vol. 30, No. 2 (2014) 39-54
42
service quality can be expressed with the
following equation [6]:
ij
Where: SQ = perceived service quality of
individual “i”
k = number of attributes/items
P = perception of individual “i” to
performance of service on item “j”
One of the drivers of satisfaction that falls
in
the
general
service
quality
conceptualization is the Technical and image
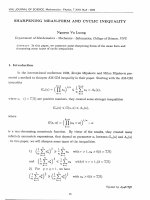
quality. Christian Gro¨nroos developed a
service quality model that has three
components of service quality, namely:
technical quality, functional quality, and
image (see Figure 1). He maintains that the
customer
evaluations
of
perceived
performance of service against his/her
perceived service quality result in a measure
of service quality. Image, which could be
referred to as reputational quality, is very
important to service firms and this can be
expected to build up mainly by the technical
and functional quality of service including the
other factors (tradition, ideology, word of
mouth, pricing and public relations). Frank
Kwadwo Duodu Theresa Amankwah in their
thesis - “An Analysis and Assessment of
Customer Satisfaction with Service Quality in
Insurance Industry in Ghana” also added the
Image factor to check the effective to
customer satisfaction.
a
Figure 1: Gron’nross Model.
Source: Gron’nross, 1984.
This model confirms the relationship
between Image factor and service quality. In
this thesis, the Image will be added to check
this relationship in the BV Life case. This
relationship is modeled as follows:
Figure 2: Research model.
Source: Author’s research.
b. Hypotheses
There are several hypotheses for this
research model as follows:
- H1: The Tangible component and
customer satisfaction have a positive
relationship. This means the higher/lower the
customer evaluates the tangible factor, the
higher/lower the level of customer satisfaction.
- H2: The Reliability component and
customer satisfaction have a positive
relationship. This means the higher/lower the
customer evaluates the reliability factor, the
higher/lower the level of customer satisfaction.
P.T. Liên, N.T.N. Anh / VNU Journal of Science: Economics and Business, Vol. 30, No. 2 (2014) 39-54
- H3: The Responsiveness component and
customer satisfaction have a positive relationship.
This means the higher/lower the customer
evaluates the responsiveness factor, the
higher/lower the level of customer satisfaction.
- H4: The Assurance component and
customer satisfaction have a positive
relationship. This means the higher/lower the
customer evaluates the assurance factor, the
higher/lower the level of customer satisfaction.
- H5: The Empathy component and
customer satisfaction have a positive
relationship. This means the higher/lower the
customer evaluates the empathy factor, the
higher/lower the level of customer satisfaction.
- H6: The Image component and customer
satisfaction have a positive relationship. This
means the higher/lower the customer
evaluates the image factor, the higher/lower
the level of customer satisfaction.
3. Research methodology
The research process follows these stages:
● Designing the questionnaire
The questionnaire was designed in
Vietnamese, and divided into two main parts:
- Part I: asking customers about their basic
information.
- Part II: collecting customer perception of the
quality of service and their satisfaction level.
In the questionnaire, Part II included 31
variables in total. There were 27 variables
43
used to assess customer perception of quality
of the BV Life service, 4 variables used to
measure customer satisfaction based on the
performance of the BV Life Corporation. This
measurement is based on a 5-point rating
scale which corresponds to 1 = strongly
disagree, 2 = somewhat disagree, 3 = neither
agree nor disagree, 4 = somewhat agree, 5 =
strongly agree.
● Sampling and collecting data
The method used to collect data was the
conducting of surveys of customers of BV Life
Corporation in 6 cities: Hanoi, Da Nang, Nghe
An, Nha Trang, Hai Phong and Ho Chi Minh
City. Questionnaires were provided to customers
and one staff interview per customer. It took each
customer about 10 to 15 minutes to take part in
the interview. The survey process was carried out
from April 5-24, 2014.
● Analysing data
At first, data was collected and screened to
identify missing samples. After rejecting all
invalid samples, the data was encoded in SPSS
16.0 as in Table 1. After being encoded, the
data was analyzed by SPSS 16.0 through the
following process:
a. Reliability analysis by Cronbach’s alpha
Cronbach’s alpha is a common measure of
the internal consistency (reliability) of a test or
scale. Internal consistency describes the extent
to which all the items in a test measure the
same concept or construct and hence it is
connected to the inner-relatedness of the items
within the test [13].
44
P.T. Liên, N.T.N. Anh / VNU Journal of Science: Economics and Business, Vol. 30, No. 2 (2014) 39-54
Table 1: Encoded data
TANGIBLE (TA)
EMPATHY (EM)
RELIABILITY
(RE)
ASSURANCE
(AS)
RESPONSIVENESS
(RES)
IMAGE (IM)
CUSTOMER
SATISFACTION
(E)
Code
TA1
TA2
TA3
TA4
TA5
EM1
EM2
EM3
EM4
EM5
EM6
RE1
RE2
RE3
Explain
Has product features that are clear and understandable
BV’ s branches are elegant and friendly with large waiting areas
BV has all products/services which I am looking for
Available brochures, leaflets, posters…with detail information related
to products/services/promotion
Staff with professional image, consistent wearing of uniform
Attractive insurance benefit
Offer competitive charges
Has attractive promotional programs
Processes applications quickly and efficiently
Having convenient branch operating hours
Listen to your comments
Is trustworthy and honest
Speak clearly in a language you can understand
Has a good knowledge of financial products, able to answer all your
questions exactly
RE4
Prompt follow up from agents upon client query
AS1
Knowledge, competence of customer service staff whom you dealt
with
Offers flexible products that meet your changing needs
Has attractive promotional programs
Friendliness and helpfulness
Ease of getting through to call center
Ease of contacting the agent for insurance needs
Proactive on seeking customer needs
Handles medical information for underwriting with speed and
sensitivity
How successful is your insurance company?
What is the reputation of your insurance company?
What is the brand image of BV?
How socially responsible is BV?
How would you rate the overall performance, products and services of
BV Life?
Would you continue to use the products and services of BV
Life company again?
Would you recommend the products and services of BAO VIET Life
to business partners/ associates or acquaintances?
Given what you know about other insurance companying service
providers, how would you rate the competitive advantage, by dealing
with BV compared to other providers?
AS2
AS3
AS4
RES1
RES2
RES3
RES4
IM1
IM2
IM3
IM4
E1
E2
E3
E4
eSource: Author’s research.
The value of alpha (α) may be between
negative infinity and 1. However, only positive
values of alpha have meaning. In general, alpha
coefficient ranges in value from 0 to 1, and the
increase of this value means that the correlations
between the items increase [14]. In this study,
scales which have Cronbach’s alpha coefficient
greater than or equal to 0.6 will be accepted.
P.T. Liên, N.T.N. Anh / VNU Journal of Science: Economics and Business, Vol. 30, No. 2 (2014) 39-54
Besides assessing the reliability of scales,
Cronbach’s alpha analysis also helps to check
whether any item is not consistent with the rest
of the scale through item-total correlations.
Variables which have greater than 0.3 item-total
correlations will be accepted; the others which
have smaller than 0.3 item-total correlations will
be eliminated from analysis data.
b. Exploratory factor analysis
Exploratory factor analysis is a powerful
statistical technique which is used for data
reduction and summarization. The sampling
adequacy of factor analysis is based on the
Kaiser-Meyer-Olkin (KMO) Measure. In the
case that the KMO has a value between 0.5 and
1.0, and Sig. is smaller than 0.5, the factor
analysis is accepted. In the case that the KMO’s
value is smaller than 0.5, or Sig. is greater than
0.5, the factor analysis may not be accepted.
By performing exploratory factor analysis,
an investigator can decide the number of factors
to extract in the model. The Kaiser creation
states that the investigator should use a number
of factors equal to the number of the eigen
values of the correlation matrix that are greater
than one [15].
An important part in exploratory factor
analysis is interpreting factor matrixes. This
research will use Varimax rotation process to
produce multiple group factors. Factor loadings
which indicate correlations between the
variables and the factors are required to have
values greater than 0.5. In this case, a factor can
be interpreted in terms of the variables that have
a high load on it.
c. Regression analysis
Regression analysis is a modelling
technique for analysing the relationship
between dependent variables (customer
satisfaction) and independent variables
(tangibility,
reliability,
responsiveness,
assurance, empathy and image). Then, based on
the regression function, we can assess the
45
impact of each independent variables on
dependent variable as well as predict the change
in dependent variables when there is any
change in independent variables.
At first, it is necessary to test assumptions
for regression analysis. The principal
assumption is that there is a linearity in the
relationship
between
dependent
and
independent
variables.
This
research
investigates the model with more than one
independent variables, the correlation among
independent variables (multi-collinearity)
should be checked through a Variance
inflation factor (VIF). Regression model
accept variables which have a VIF smaller
than 10. In addition, it is assumed that the
error terms ε are independent, there are
normally distributed random variables with
mean value of 0, and there are constant
variances. As long as these assumptions are
not seriously violated, a regression model will
be established. R-square (coefficient of
determination) will provide a goodness-of-fit
measure. With a higher R-square value, the
model is a higher fit for analysis.
4. Research analysis and results
4.1. Data description
From the 400 questionnaires provided to
customers, 380 responses were collected. After
inputting data and screening questionnaires,
there were 369 valid samples and 11 missing
samples. In the 369 samples, the number of
females was much greater than the number of
males. There were 67 percent females and 33
percent males, respectively. The participants
ranged from 25 to 55 years old and were
divided into 3 groups of equal percentage. In
addition, the income of participants was at a
high level. 78 percent of the participants had an
income greater than 5 million.
P.T. Liên, N.T.N. Anh / VNU Journal of Science: Economics and Business, Vol. 30, No. 2 (2014) 39-54
46
4.2. Reliability analysis
Table 2: Reliability analysis results
Scale Mean if Item
Deleted
Scale Variance if Item
Deleted
Corrected Item-Total
Correlation
Cronbach's Alpha if
Item Deleted
Tangible: Cronbach's alpha= .834
TA1
12.4761
6.4366
0.6234
0.8032
TA2
12.7127
6.3635
0.7021
0.7819
TA3
12.6704
6.5267
0.6118
0.8063
TA4
12.6817
6.3136
0.6604
0.7926
TA5
12.5577
6.5976
0.5735
0.8172
EM1
15.7131
10.3134
0.6422
0.8098
EM2
15.6506
10.0456
0.6251
0.8125
EM3
15.6875
10.4605
0.5832
0.8206
EM4
15.8040
9.6680
0.6893
0.7992
EM5
15.7330
9.9912
0.6217
0.8133
EM6
15.8864
10.4429
0.5444
0.8285
RE1
9.5855
4.6304
0.5892
0.8099
RE2
9.5055
4.1633
0.7182
0.7520
RE3
9.4909
4.2800
0.6745
0.7724
RE4
9.6764
4.2708
0.6339
0.7916
AS1
11.4309
3.8437
0.5055
0.6795
AS2
11.4282
3.7944
0.5217
0.6703
AS3
11.4743
3.7120
0.5181
0.6723
AS4
11.4634
3.6406
0.5385
0.6602
RES1
8.9241
6.3220
0.6305
0.8633
RES2
8.7393
6.1007
0.7248
0.8255
RES3
8.8482
5.8974
0.7317
0.8224
RES4
8.8251
5.8865
0.7812
0.8025
IM1
11.1491
3.1326
0.4254
0.6232
IM2
11.3171
3.3584
0.3947
0.6405
IM3
11.1057
3.2089
0.4984
0.5743
IM4
11.1518
3.1454
0.4937
0.5756
Empathy: Cronbach's alpha= .840
Reliability: Cronbach's alpha= .827
Assurance: Cronbach's alpha= .731
Responsiveness: Cronbach's alpha= .866
Image: Cronbach's alpha= .670
Customer satisfaction: Cronbach's alpha= .857
E1
11.1902
7.168
.713
E2
10.8179
6.051
.734
.805
E3
10.7228
6.244
.703
.819
E4
11.0054
7.035
.676
.829
Source: Author’s calculation.
.818
P.T. Liên, N.T.N. Anh / VNU Journal of Science: Economics and Business, Vol. 30, No. 2 (2014) 39-54
Table 2 shows that the seven scales are
reliable with Cronchbach’s Alpha value
greater than 0.6. All of the variables have
item-total correlations greater than 0.3, and so
will be accepted.
In conclusion, through reliability analysis, no
item is rejected. The initial scale has 27 variables
and the customer satisfaction has 4 variables.
4.3. Exploratory factor analysis
a. Exploratory factor analysis for service
quality scale
Exploratory factor analysis results for the
service quality scale found that initial six
components were reduced to five components
extracted with eigen values greater than 1. The
first components, namely TA-EM are a
combination of Tangible and Empathy
components. The other four components are
RELIABILITY,
RESPONSIVENESS,
ASSURANCE and IMAGE. All factor loadings
are greater than 0.5. Only one item has an
acceptable factor loading. The service quality
scale including 27 observed variables, divided
into
5
components
namely
TA-EM,
RELIABILITY,
ASSURANCE,
RESPONSIVENESS, and IMAGE.
Besides, exploratory factor analysis is
adequate with the KMO value being 0.919 and
the Sig. value .000. In addition, with a
Cumulative percentage of Variance of 59.36
percent, these four components explain 59.36
percent of service quality variance.
In
conclusion,
after
making
an
exploratory factor analysis, the service
quality scale includes 27 observed variables,
divided into 5 components, namely, TA-EM,
RELIABILITY,
ASSURANCE,
RESPONSIVENESS,
and
IMAGE.
Table 3: Reliability and factor analysis for service quality scale
KMO and Bartlett's Test
Kaiser-Meyer-Olkin Measure of Sampling Adequacy.
Bartlett's Test of Sphericity
Approx. Chi-Square
Df
Sig.
.919
3.334E3
351
.000
Rotated Component Matrixa
EM3
EM1
EM4
TA3
TA1
TA5
EM5
EM6
EM2
TA4
TA2
RES4
RES3
RES2
RES1
47
Component
1
2
.703
.697
.694
.680
.641
.603
.596
.572
.567
.523
.521
.821
.818
.741
.701
3
4
5
P.T. Liên, N.T.N. Anh / VNU Journal of Science: Economics and Business, Vol. 30, No. 2 (2014) 39-54
48
RE1
RE2
RE3
RE4
AS1
AS3
AS2
AS4
IM1
IM4
IM2
IM3
Eigenvalues
.728
.715
.682
.664
9.5000
2.7610
1.5340
1.1610
.670
.661
.649
.597
1.0710
Cumulative % of Variance
19.01
31.05
42.30
50.96
59.36
.738
.666
.662
.604
d
Source: Author’s calculation.
b. Exploratory factor analysis for customer
satisfaction scale
Customer satisfaction scale includes two
items. In KMO and Bartlett's Test, the KMO
value measuring the sampling adequacy equals
0.820 with Sig. .000. These numbers confirm the
validity of data for exploratory factor analysis.
The analysis extracts 1 component which has
eigen values of 2.821 (greater than 1). Four
customer satisfaction items define this
component with factor loadings greater than 0.5.
The cumulative variance is 70.518 percent,
which means that this component explains
70.518 percent of customer satisfaction variance.
Table 4: Exploratory factor analysis of customer satisfaction scale
KMO and Bartlett's Test
Kaiser-Meyer-Olkin Measure of
Sampling Adequacy.
Bartlett's
Approx. ChiTest of
Square
Sphericity
Df
0.82
653.857
6
Sig.
0
Component Matrixa
Component
1
E2
0.857
E1
E3
E4
0.845
0.835
0.821
2.821
Eigenvalues
Cumulative % of Variance
Source: Author’s calculations.
70.518
P.T. Liên, N.T.N. Anh / VNU Journal of Science: Economics and Business, Vol. 30, No. 2 (2014) 39-54
49
ESour
In short, after making exploratory factor
analysis, the customer satisfaction scale
includes 4 observed variables, extracted to 1
component - SATISFACTION.
c. Research model - Version 2
After making an exploratory factor analysis,
the two scales TANGIBLE and EMPATHY
together define the TA-EM component.
Therefore, the original research model is
adjusted to become Research Model – Version
2 as in Figure 3.
Hypothesis H2, H3, H4, H5, H6 remains
unchanged.
Hypothesis H7 is added for the TA-EM
component: the TA-EM component and
customer satisfaction have a positive
relationship. This means the higher or lower the
customer evaluates the TA-EM factor, the higher
or lower the level of customer satisfaction.
Figure 3: Research model - Version 2.
Source: Author’s research.
4.3. Regression analysis
a. Regression analysis
At first, the average scores of five
dependent variables and independent variables
(TA-EM, RELIABILITY, ASSUARANCE,
RESPONSIVENESS, and IMAGE) for 369
participants we calculated. Then, it was
necessary to test whether the data satisfies
assumptions for regression analysis.
Table 5: Regression analysis summary
Adjusted
R Square R Square
Model
R
1
.805
.649
.637
Std. Error
of the
Estimate
.39638
Source: Author’s calculations.
In Table 5, the adjusted R-square value
accounts for .637. This value indicates that nearly
64 percent of the variance in customer satisfaction
can be explained by five variables, namely TAEM,
RELIABILITY,
ASSURANCE,
RESPONSIVENESS, and IMAGE.
The
Pearson
Correlation
between
SATISFACTION and the other five
components - TA-EM, RELIABILITY,
ASSURANCE, RESPONSIVENESS, and
IMAGE - present positive values. That means
there is a positive linear relationship between
dependent and independent variables. Besides,
the correlation among the five components is
also quite strong with Pearson values greater
than 0.3, which may lead to a multi-collinearity
situation. However, the VIF values of five
components are very small (much smaller than
10). Thus, there will not be a multi-collinearity
situation, and the regression model accepts
these variables.
50
P.T. Liên, N.T.N. Anh / VNU Journal of Science: Economics and Business, Vol. 30, No. 2 (2014) 39-54
Table 6: Coefficients
f
Model
1
(Constant)
TA.EM
RE
RES
AS
IM
Unstandardized
Coefficients
B
0.137
0.295
0.207
0.242
0.232
0.056
Std. Error
0.117
0.027
0.036
0.034
0.036
0.021
Standardized
Coefficients
Beta
0.330
0.180
0.226
0.203
0.075
T
1.169
10.846
5.776
7.048
6.518
2.611
Sig.
0.243
0.000
0.009
0.000
0.014
0.039
Source: Author’s calculations.
In short, it can be seen that
assumptions for the regression model are not
seriously violated; therefore, the regression
model will be established.
With coefficients presented in Table 6,
regression function is as follows:
SATISFACTION = 0.330 TA-EM + 0.180
REABILITY + 0.226 RESPONSIVENESS +
0.203 ASSURANCE + 0.075 IMAGE
b. Research model and hypothesis tested result
From data selected from customers of BV
Life, this research constructed a regression
model in which five components of service
quality
(TA-EM,
RELIABILITY,
ASSURANCE, RESPONSIVENESS, and
EMPATHY) have a statistically positive
relationship
with
customer
satisfaction
(SATISFACTION). All hypotheses are
supported by this result:
Table 7: Hypotheses tested results
Hypotheses
Result
H7: The TA-EM component and customer satisfaction have a positive relationship.
This means the higher/lower customers evaluate the TA-EM factor, the
higher/lower the level of customer satisfaction.
H3: The RELIABILITY component and customer satisfaction have a positive
relationship. This means the higher/lower customers evaluate the RELIABILITY
factor, the higher/lower the level of customer satisfaction.
H4: The RESPONSIVENESS component and customer satisfaction have a
positive relationship. This means the higher/lower customers evaluate the
RESPONSIVENESS factor, the higher/lower the level of customer satisfaction.
H5: The RESPONSIVENESS component and customer satisfaction have a
positive relationship. This means the higher/lower customers evaluate the
RESPONSIVENESS factor, the higher/lower the level of customer satisfaction.
H6: The IMAGE component and customer satisfaction have a positive
relationship. This means the higher/lower customers evaluate the IMAGE factor,
the higher/lower the level of customer satisfaction.
Supported
Supported
Supported
Supported
Supported
r
Source:
Author’s research.
5. Findings and discussion
5.1. Assessment of perceived service quality at
BV Life Corporation
Perceived performance of service quality can
be assessed through the SERVPERF scores. The
SERVPERF scores on TA-EM, RELIABILITY,
P.T. Liên, N.T.N. Anh / VNU Journal of Science: Economics and Business, Vol. 30, No. 2 (2014) 39-54
ASSURANCE,
RESPONSIVENESS,
and
IMAGE are calculated by the average score of
service quality components with a higher
perceived performance implying higher service
51
quality. Assessment will base on this convention:
score from 4 to 5: very high level, score from 3 to
4: fairly high level, score from 2 to 3: average
level, score under 2: below average level.
Table 8: Perception on service quality at BV Life Corporation
TA.EM
RE
RES
AS
IM
N
Minimum Maximum Mean
369
369
369
369
369
1.00
1.00
1.00
1.75
2.00
4.82
5.00
5.00
5.00
5.00
3.8164
3.0882
3.3882
3.1756
3.0270
Source: Author’s calculations.
As Table 8 shows, perceived scores for
three components of service quality in the BV
Life Corporation ranges from 3.0270 to 3.8164.
Among the five components, TA-EM gets the
highest score 3.8164 which is nearly reach very
high assessment level. It is followed by
RESPONSIVENESS, ASSURANCE, then
RELIABILITY and IMAGE.
In short, it can be concluded that customers
assessed BV Life’s service quality at a fairly
high level.
5.2. Impact of service quality factors on
customer satisfaction at BV Life
The service quality factors at BV Life
Corporation are classified into TA-EM,
RELIABILITY,
ASSURANCE,
RESPONSIVENESS, and IMAGE. They are
also service quality components which
determine customer satisfaction level.
The regression function which illustrates
the relationship between these three factors and
customer satisfaction is as follows:
SATISFACTION = 0.330 TA-EM + 0.180
RELIABILITY + 0.226 RESPONSINESS +
0.203 ASSURANCE + 0.075 IMAGE
All hypotheses for these components are
supported. From the equation, the positive
coefficients show that five factors have a
positive relationship with customer satisfaction.
The factor which has the most significant
influence on overall customer satisfaction is
TA-EM with a standardized coefficient of
0.330. This number reveals that unit increases
(decreases) in tangible-empathy will lead to an
increase (decrease) in overall customer
satisfaction by 0.330 units. That also means if
the BV Life Corporation increases its tangible
and empathy ability in serving customers by 1
unit, they may increase the customer
satisfaction level by 0.330 units.
The second important factor in determining
customer
satisfaction
is
the
RESPONSIVENESS component with a
standardized coefficient of 0.226. This means a
unit increase (decrease) in willingness to help
customers and to provide prompt service may
increase (decrease) the overall customer
satisfaction level by 0.226 units.
The third factor which has impacts on
customer satisfaction is ASSURANCE with a
standardized coefficient value, which is quite
high, of 0.203. It shows the importance of
knowledge and courtesy of employees and their
ability to convey trust and confidence. If the
corporation can increase this ability by 1 unit, it
will contribute to an increase in overall
customer satisfaction of 0.203 units.
52
P.T. Liên, N.T.N. Anh / VNU Journal of Science: Economics and Business, Vol. 30, No. 2 (2014) 39-54
The next factor is RELIABILITY which
does not have high standardized coefficient
(0.180). The corporation tries to perform the
promised service in a dependable way and to
build customer trust. If this ability increases
(decreases) 1 unit, it leads to a customer
satisfaction increase (decrease) of 0.180 units.
shortening time and simplying the processes of
business transactions; (4) implementpreferential
customer policies to maintain the loyalty of its
customers; (5) diversify the list of available
services to meet the various needs of customers;
(6) adjust service fees to attain competitive
prices compared with rivals.
The last factor, which has the smallest
impact on customer satisfaction level, is
IMAGE, with a standardized coefficient value
of 0.075. This value says that the image
component, which is the willingness to help
customers and provide prompt services,
influences customer satisfaction.
The
research
result
showed
that
RESPONSIVENESS has a high significant
influence on customer satisfaction. Therefore,
in order to enhance the customer satisfaction
level, BV Life should firstly pay attention to
improve its RESPONSIVENESS ability by: (1)
having an attracting-talents policies, and recruit
the right people to the right positions; (2) after
recruiting qualified employees, the corporation
needs to train them; (3) establishing suitable
compensation policies for employees; (4)
continuously improve service processes to
create comfortable conditions for both
customers and staff; (5) improving customer
service centres.
The adjusted R-square value of 0.64
indicates that these three service quality
components can explain 64 percent of the
variance in customer satisfaction. The
remaining 36 percent can be explained by other
factors, such as brand image, advertising
activities, social responsibility, etc.
It is clear that three service quality
components together determine the customer
satisfaction level in BV Life. Although the level
of each factor’s impact is different, they are all
important factors which are in need of attention
and further improvement
5.3. Suggestions to improve service quality and
customer satisfaction at BV Life
As analysed and discussed above, the
quality of the Tangible- Empathy component is
evaluated as the one with the highest impact.
Therefore, to wholly improve service quality
and gain customer satisfaction, there are some
other suggestions to increase the quality of
Tangible-Empathy: (1) invest in the physical
facilities of the branches; (2) with each different
customer, the corporation should deeply
understand their specific needs and help them to
choose suitable services; (3) focus on
The Image component has the lowest impact
on customer satisfaction with the standardized
coefficient nearly 0. However, the image of any
company is very important in long-term
development. Improving the image will increase
the success of the brand, social responsiveness,
etc. BV Life should build its image follow the
BV Holding strategy; here are some solutions for
both the corporation and holding: (1) for BV
Holding, brand development objects are
dynamic, professional and consistent with the
holding strategies to build the core values
including: quality, friendliness, a cooperative
spirit, dynamism and responsibility; (2) for the
BV Life Corporation: synchronize towards a
modern and friendly image at the branches and
at the point of sale; improve their professional
advisors; enhance and improve the quality of
communication activities and advertising of the
BV Life image. Continue and enhance the
P.T. Liên, N.T.N. Anh / VNU Journal of Science: Economics and Business, Vol. 30, No. 2 (2014) 39-54
productivity of social activities like: “Mang Tết
ñến vùng cao”, support to typhoon victims. BV
Life should maintain collaboration with the
Children Protection Fund to bring benefits for
disadvantaged children.
In order to improve the customer satisfaction
level, BV Life has to find short-term and longterm solutions. According to the result of this
paper, I suggest some solutions based on
improving these five components: tangibleempathy, reliability, assurance, responsiveness
and image. However, BV Life should have
solutions for other factors, for example:
technical, marketing plan, advertising, etc. For
the sustainable future, BV has to develop a
comprehensive policy strategy. Thus, the
corporation can increase and maximize customer
satisfaction and then get the customer loyalty.
6. Limitations and suggestions for further
research
Firstly, with the help of BV staff, the
survey was conducted in six big cities of
Vietnam, this gave the database a general
overview. However, the number of responses
from each city are different so it is quite hard to
make comparisons. Furthermore, the study only
considered individual customers and ignore
business and group customers. This leads to a
limitation of study to make a deep analysis.
These limitations provide new directions for
future research.
Secondly, the research used common
methods such as: Cronbach’s anpha, EFA
analysis and regression analysis. However, in
order to achieve better results future research
should use more modern methods like SEM.
Thirdly, the relationship between the
quality of BV Life service and customer
satisfaction is relative to each other. Therefore,
the relationship may change frequently and its
53
changes cannot be predicted. Therefore, this
research only explains the current relationship.
More researches are required to show the trend
of this relationship.
7. Conclusions
This research examined BV Life insurance
service to investigate the components of its
quality and describe the relationship between
BV Life service quality’s components and
overall customer satisfaction level. This
research was conducted using a quantitative
method. The theoretical model with 27
observed items divided service quality into 5
components and customer satisfaction into 4
components. With 369 valid responses,
reliability analysis, exploratory factor analysis
and regression analysis, have all been
conducted. The theoretical model of 5
component
includes
Tangible-Empathy,
Reliability, Assurance, Responsiveness and
Image all influence the components of customer
satisfaction. The regression analysis describes
the positive relationship between the quality of
BV Life service and customer satisfaction as
the following function:
CUSTOMER SATISFACTION= 0.330
TA-EM + 0.180 RELIABILITY + 0.226 +
RESPONSIVENESS + 0.203 ASSURANCE +
0.075 IMAGE
This result confirms the importance of service
quality in maintaining customer satisfaction.
References
[1]
[2]
Vietnam Insurance Association, “10 prominent
events of Vietnam Insurance Sector in 2013”,
2013.
Cronin, J. J., and Taylor, S. A., “Measuring
Service Quality: A Re-examination and
Extension”, Journal of Marketing, (1992) 55.
54
[3]
[4]
[5]
[6]
[7]
[8]
[9]
P.T. Liên, N.T.N. Anh / VNU Journal of Science: Economics and Business, Vol. 30, No. 2 (2014) 39-54
Kotler Philip, Wong Veronica, Saunders John,
Armstrong Gary, Principles of Marketing (4th
European edition), Prentice Hall, 2005, pp. 539,
546, 625.
Jay
Heize,
Barry
Render,
Operation
Management Flexible Version (9th edition),
Prentice Hall, 2009, pp. 156, 168, 185-186.
Parasuraman, Valarie A. Zeithaml, & Leonard
L. Berry, “SERVQUAL: A Multiple-Item Scale
for Measuring Consumer Perceptions of Service
Quality, Journal of Retailing, Vol. 64, No. 1
(1988), pp. 12-40.
Sanjay K Jain and Garima Gupta, “Measuring
Service Quality: SERVQUAL vs. SERVPERF
Scales”, Vikalpa, Vol. 29 2004, pp. 25-35.
Center for the Study of Social Policy,
“Customer Satisfaction: Improving Quality and
Access to Services and Supports in Vulnerable
Neighborhoods”, 2007, pp. 6.
Vanniarajan, Anbazhagan, B., (“SERVPERF
Analysis in Retail Banking”, International
Marketing Conference on Marketing & Society,
2007, pp. 726-734.
Emari, H., Iranzadeh, S., and Bakhshayesh, S.,
“Determining the Dimensions of Service
Quality in Banking Industry: Examining the
Cronroos’s Model in Iran”, Journal of
Compilation, 2010, pp. 3.
[10] Brady, M. K., and Robertson, C. J., “Searching
for a consensus on the antecedent role of service
quality and satisfaction: an exploratory crossnational study”, Journal of Business Research,
2001, Vol. 51 (1), pp. 53–60.
[11] Ruyter, K., Bloemer, J., and Pascal, P.,
“Merging Service Quality and Service
Satisfaction: An Empirical Test of an
Integrative Model”, Journal of Service
Marketing, Vol. 16 (4) (1997), pp. 363-379.
[12] Hollis Landrum et al., “Measuring Information
Science System Service Quality with
SERVQUAL: Users’ Perceptions of Relative
Importance
of
the
Five
SERVPERF
Dimensions”,
Information
Science:
the
International Journal of an Emerging Transdiscipline, Vol. 12 (2009), pp. 18-34.
[13] Amit
Choudhury,
“Cronbach’s
alpha”,
Experiment-resources.com,
retrieved
29/04/2012,
available
at:
/>[14] Tavakol Mohsen, Dennick Reg, “Making Sense
of Cronbach’s Alpha”, International Journal of
Medical Education, 2011, pp. 53-55.
[15] DeCoster, J., “Overview of Factor Analysis”,
retrieved 29/04/2012, downloaded from
.