Information technology resources and business perfomance an Australian context
Bạn đang xem bản rút gọn của tài liệu. Xem và tải ngay bản đầy đủ của tài liệu tại đây (202.56 KB, 20 trang )
Asia Pacific Management Review 14(4) (2009) 407-426
www.apmr.management.ncku.edu.tw
Information Technology Resources and Business
Performance: An Australian Context
Thi Lien Phama,*, Ernest Jordanb
a
College of Economics, Vietnam National University, Vietnam
Macquarie Graduate School of Management, Macquarie University, Australia
b
Accepted 27 April 2009
Abstract
Information Technology (IT) resources have been suggested to contribute to business
performance in the literature, yet the contribution of different resources is not well-explained.
This study investigates the relationship between information technology resources and
companies’ business performance with the presence of the information technology use
intensity in industries. The relationship is studied not only at aggregate level but also at detail
level which gives an answer to the question of which resource has the most effect on
performance. The results of Australian company survey are used in this paper. It is found that
IT human resource and IT infrastructure affect business performance while the effect of IT
partnership is not significant. This study is expected to help companies’ managements to have
a clearer view of how to enhance the benefits of IT resources on companies’ performance by
understanding and focusing on the more important resources.
Keywords: IT resources, IT capability, business performance, organizational performance, IT
human resources
1. Introduction1
The business value of information technology has been debated for many years. “While
some authors have attributed large productivity improvements and substantial consumer
benefits to IT, others report that IT has not had any bottom line impact on business
profitability” (Hitt and Brynjolfsson, 1996). Carr (2003) argued that IT is ubiquitous,
increasingly inexpensive and accessible to all organisations, thus, it cannot provide
differential advantage to any company because scarcity, not ubiquity, is the basis for a
sustained competitive advantage. He compared IT to infrastructural technology, like railroads
and telegraphs, which is far more valuable when shared than when used in isolation. Its
benefits are accessible to all and cannot create competitive for any individual firm (Carr,
2003). However, Ross et al. (1996) argue that although firms buy the same software packages,
hire similar contractors, outsource to the same major vendors, some of them generate
significant business value from IT while others do not. The difference is in their ability to
build and leverage unique IT management assets which can generate sustainable competitive
advantage for a firm. Mata et al. (1995) show that IT itself cannot deliver any sustainable
advantage, but the management of IT can.
Recently, some researchers have discussed that managing IT is a capability that can create
uniqueness and provide organisations a competitive advantage (Bharadwaj, 2000; Santhanam
*
Corresponding author. E-mail:
407
T. L. Pham, E. Jordan / Asia Pacific Management Review 14(4) (2009) 407-426
and Hartono, 2003; Bhatt and Grover, 2005). In their research, Ravinchandran and
Lertwongsatien (2005) found a positive effect of information systems resources on firm
performance indirectly through the role of capabilities. It is argued that resource-based theory
can provide the appropriate theoretical lens to examine how companies’ internal factors can
make the difference and be a source of competitive advantage (Barney, 1991; Mata et al.,
1995; Ross et al., 1996). In the literature, IT resources have been suggested to contribute to
business performance, yet the contribution of different resources is not well-explained. This
research draws on resources-based theory to examine the effect of IT resources on business
performance directly in Australian context. The relationship is studied not only at aggregate
level but also at detail level which gives an answer to the question of which resource has the
most effect on performance.
Apart from this introduction section, Section 2 provides literature review and conceptual
framework for the study. Research methodology is given in Section 3. Section 4 provides data
analysis which is followed by a discussion part in Section 5. After giving limitations of the
study and suggesting further research in Section 6, a conclusion of the paper is given in
Section 7.
2. Literature review and conceptual framework
2.1 IT resources and organizational performance
2.1.1 Organizational performance
Defining and measuring performance have been the interests of researchers for centuries.
There is, however, a lack of agreement as to what constitutes performance in organisation
performance literature. It can be seen in three perspectives: (a) the goal approach - assuming
that organisations pursue identifiable goals, thus performance is assessed in terms of goal
attainment; (b) the systems resource approach - stressing the relationship between the
organisation and its environment. Performance in this perspective is measured in terms of the
organisation’s ability to secure scarce and valued resources; and (c) the process approach
which defines performance in terms of the behaviour of organisation participants (Ford and
Schellenberg, 1982). But generally, the concept of organisational performance is based on the
idea that an organisation is the voluntary association of productive assets such as human,
physical and capital resources, for the purpose of achieving a shared purpose. Because
resource providers will only commit themselves to the organisation so long as they are
satisfied with the value they receive in return, value creation, as defined by resource providers,
is the essential overall performance criterion for any organisation (Alchian and Demsetz, 1972;
Jensen and Meckling, 1976; Barney, 2002; Carton and Hofer, 2006).
Organisational performance is a multidimensional construct which permits value to be
created on different dimensions (Steers, 1975; Cameron, 1986; Murphyet al., 1996). It is
possible to conceive of multiple measures of the value created (Carton and Hofer, 2006).
Companies may pursue different objectives and there is probably no single measure that fully
captures firm performance (Venkatraman and Ramanujam, 1986; Voss and Voss, 2000).
Interpretation of performance depends on the observer’s perspective. Carton and Hofer (2006)
argued that value is in the eye of the beholder. So, each group of organisational stakeholders
will have a different view of organisational performance which depends on their purpose for
associating with the organisation. Therefore, to select a perspective of performance that
conforms to the phenomenon of interest, a researcher should select a perspective that
coincides with the purpose of the research. There seems to be no consensus regarding the
measures of organisational performance. Organisational performance studies have
inconsistent results because of the different characteristics of the sample used, the variance in
408
T. L. Pham, E. Jordan / Asia Pacific Management Review 14(4) (2009) 407-426
measurements employed and the lack of consensus on the purpose of measuring performance.
Performance has been conceptualised in different ways for different researchers. It can be
measured objectively based on historical data (Bharadwaj, 2000; Sanders and Premus, 2005)
or measured subjectively based on perception of respondents on organisational performance
in relation to their expectations, goals or in comparison with performance of their company’s
competitors (Ravinchandran and Lertwongsatien, 2005). This might be due to the many
varied views of what are expected outcomes of organisational activities and because
performance has often been characterised by the purposes of the research being performed
(Carton and Hofer, 2006).
In general, the overall organisational performance can be measured by financial
performance, operational performance, and stakeholder performance (a measure of how well
stakeholders are treated by an organisation) (Carton and Hofer, 2006; Venkatraman and
Ramanujam, 1986). But it appears that most strategy studies have restricted their focus to the
first two dimensions which represent business performance (Venkatraman and Ramanujam,
1986). This study uses organisational performance and business performance interchangeably.
2.1.2 IT resources
Resource-based view has been widely discussed in the literature. It views the organization
as a collection of resources and capabilities. In examining the link between company
resources and sustain competitive advantage, Barney (1991) had two general assumptions
about companies. Firstly, resources are heterogeneously distributed across competing
companies. Secondly, resources are imperfectly mobile. The differences in organizations’
performance are driven primarily by their unique resources and capabilities. Resource-based
perspective has been studied in IT since the mid-1990s with much of the IT research
attempted to identify and define either a single IT resource or sets of IT resources (Wade and
Hulland, 2004). This view has been studied in IT as IT resources and IT capabilities (Mata et
al., 1995; Ross et al., 1996; Bharadwaj, 2000; Ravinchandran and Lertwongsatien, 2005).
Concerning the contribution of IT resources to companies’ sustain competitive advantage, it is
found that managerial IT skills are the resource that lead to sustain competitive advantage
(Mata et al., 1995). Capabilities represent a firm’s capacity to deploy resources using
organizational processes to affect a desired end. They are often developed in functional areas
or by combining physical, human and technological resources at the corporate level (Amit and
Schoemaker, 1993). IT capability was first defined by Ross et al. (1996) as “the ability to
control IT-related costs, deliver systems when needed and effect business objectives through
IT implementations”. They argue that highly competent IT staff, a strong partnering
relationship between business and IT management and a reusable technology base are the
three key IT assets/resources that bring IT capabilities. In turn, IT capability will enhance an
organization’s competitiveness. With the focus on which IT capabilities are core to the
business’s future capacity to use IT successfully, not on whether IT is core or non-core in an
organization, Feeny and Willcocks (1998) identify the nine core capabilities that an
organization must maintain. They suggest that this core IT capability model should be seen as
a blueprint for sustaining an organization’s ability to exploit IT. Those core capabilities are:
IS/IT leadership, Business system thinking, Relationship building, Architecture planning,
Making technology work, Informed buying, Contract facilitation, Contract monitoring, and
Vendor development.
Later, Bharadwaj (2000), extending the traditional notion of organizational capabilities to
an organization’s IT function, defined IT capability as the ability to mobilize and deploy ITbased resources in combination or copresence with other resources and capabilities. Those ITbased resources are IT infrastructure; IT human resources (comprising technical and
managerial IT skills); intangible IT-enabled resources (such as knowledge assets, customer
409
T. L. Pham, E. Jordan / Asia Pacific Management Review 14(4) (2009) 407-426
orientation and synergy- the sharing of resources and capabilities across organizational
divisions). Peppard and Ward (2004) mention three interrelated attributes of IT capabilities: a
fusion of business knowledge with IT knowledge; a flexible and reusable IT platform; and an
effective use process (itself with two aspects: using the technology and working with
information).
From the literature reviews, there are three commonly discussed IT resources: IT
infrastructure (Ross et al., 1996; Bharadwaj, 2000; Peppard and Ward, 2004; Bhatt and
Grover, 2005; Ravinchandran and Lertwongsatien, 2005; Mithas et al., 2007), IT human
resources (Mata et al., 1995; Ross et al., 1996; Bharadwaj, 2000; Peppard and Ward, 2004;
Bhatt and Grover, 2005; Ravinchandran and Lertwongsatien, 2005) and IT partnership (Ross
et al., 1996; Feeny and Willcocks, 1998; Peppard and Ward, 2004; Bhatt and Grover, 2005;
Ravinchandran and Lertwongsatien, 2005). Those three main resources will be used for
analyzing IT resources in this study.
2.1.3 IT resources and its relationship with organisational performance
There has been little empirical work in IT capability and IT resources. Using different
ways of operationalising the IT resources and capability construct and different methods,
researchers found a positive relationship between IT capability/resources and the firm’s
business performance. An initial and significant contribution by Bharadwaj (2000) analysed
the relationship by using the rankings of IT leaders as its indicator of IT capability. It is found
that firms with high IT capability tend to outperform a control sample of firms on a variety of
profit and cost-based performance measures. Santhanam and Hartono (2003) also used the
rankings of IT leaders as its indicator of IT capability but with different benchmark firms
from Bharadwaj and found a positive relationship between IT capability and firm’s
performance. In particular Sanders and Premus (2005) used a survey of 245 large
manufacturing companies and four scale items to measure IT capability relative to industry
standards, key competitors, key customers and the level of information networks used with
key suppliers. An alternative approach by Ravinchandran and Lertwongsatien (2005) used
resource-based theory and data collected from 129 firms in United States to examine how
information systems resources and capabilities affect firm performance. They proposed a
model that interrelates IS resources, IT capabilities, IT support for core competencies, and
firm performance. The results suggested that firm performance is explained by the extent to
which IT is used to support firm’s core competencies and that an organisation’s ability to use
IT to support its core competencies is dependent on IS functional capabilities, which, in turn
depend on the nature of IS resources.
Recently, in research on the relationship between types of information technology
capabilities and competitive advantage, Bhatt and Grover (2005) operationalised the IT
capability construct with three dimensions: IT infrastructure, IT business experience and
relationship infrastructure. By studying the primary data from over 200 CIOs of corporations,
they found that each of these dimensions except IT infrastructure has a positive effect on the
competitive advantage of the firm. IT capability is also shown to be positively related to
organizational effectiveness in other research (Zhang et al., 2004).
Although some previous IT research has examine the contributions of IT resources and
capabilities to company’s performance, most of these research has not used detail
measurement model for IT resources/capabilities constructs. There are two notable research
Bhatt and Grover (2005) and Ravinchandran and Lertwongsatien (2005), using detail
measurement model for IT resource/capability construct to analyse its effects on business
performance and competitive advantage. The former research analyses the effect of three IT
capabilities on company’s competitive advantage directly while the latter analyses the
association between IT resources (using the same three main resources/capabilities with
410
T. L. Pham, E. Jordan / Asia Pacific Management Review 14(4) (2009) 407-426
former study) and business performance indirectly. Three broad categories of resources
identified in the IT literature were used in the Ravinchandran and Lertwongsatien (2005)
model. They are IT human capital, IT infrastructure flexibility, and IT relationship quality. Of
which, IT human capital includes two indicators (business and technical skills, and specificity
- firm specific knowledge about the organisation like culture and business routines of IT
personnel) which were researched in a narrower aspect of either one of the two indicators in
previous studies. IT relationship quality includes relationships between internal and external
partners with IT people which is also a broader coverage in comparison with previous studies.
This study uses Ravinchandran and Lertwongsatien (2005) constructs for its model because
those constructs are broader, measuring detail perspectives of IT resources than those used in
Bhatt and Grover (2005) study.
This study is different from earlier studies in some aspects. Firstly, it analyses the
association between IT resources and performance with broaden aspects of constructs (using
the three broad categories of resources used in Ravinchandran and Lertwongsatien (2005)
study) and analyses the association directly (not analyses the association indirectly as
Ravinchandran and Lertwongsatien (2005) did). Secondly, it studies the association at a detail
level (at each IT resource level), not only at aggregate level (at IT resources in general level).
Thus, the result provides a clear idea on which IT resource contributes the most to business
performance which helps companies focus on the more important resources. Different culture
and research context might have different effect on an association between variables and the
research model. This study was conducted in the context of Australian business which is the
third difference from previous studies in the field.
2.2 Conceptual framework and research questions
Drawing from the viewpoint of the resources-based theory that company resources are the
main driver of company performance, in addition with the supportive literature of previous IT
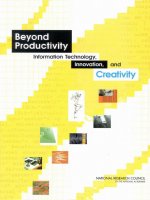
research as mentioned in previous part, we propose a conceptual framework that interrelates
IT resources and business performance with the presence of the intensity of IT use in
industries. Of which three main categories of IT resources are: IT human resource, IT
infrastructure and IT partnership which affect business performance directly. Operating
performance (profitability, productivity and financial performance) and market-based
performance (success in entering new market and bring new products and services to the
market of the company) are considered in measuring business performance in this study.
The extent of IT use across industries could reflect the variation of the potential payoff
from using IT between industries. This study uses across-industry survey data; thus the effect
of intensity of IT use in the industry is considered in the research model. The intensity of IT
use not only affects companies’ business performance but also has inter-relationships with IT
resources itself. The intensity of IT use among company’s competitors and customers in the
industry might put a pressure on the company to invest more in IT resources or to have more
IT used in the company. In turn, a good performance company with good IT human resources,
effective IT infrastructure and having a good relationship with partners can be considered as
an encouraging source for other companies in the industry to reassess their IT resources and to
follow; thus the intensity of IT use in the industry might be increased. The research model is
presented in Figure 1. This section will develop the relationships between constructs in the
research model and clarify research hypotheses.
411
T. L. Pham, E. Jordan / Asia Pacific Management Review 14(4) (2009) 407-426
IT infrastructure
IT human resource
Org.
performance
Market-based
performance
Operational
performance
IT partnership
IT intensity
Figure 1. Conceptual framework for this study.
IT infrastructure has been viewed as the foundation of IT components – hardware,
software and networks, and recently conceptualised to include shared services such as data,
information and standardised applications (Weill, 1993, cited in Mithas et al. 2007). It has
been recognised as a key IT resource in IT literature (Ross et al., 1996; Bharadwaj, 2000;
Santhanam and Hartono, 2003). Although IT infrastructure components can be seen as
commodities, it is reasonable to hypothesise that if IT infrastructure meets business needs, it
enhances operational performance. Even though some studies have shown that IT
infrastructure is not related to the competitive advantage of firms (Bhatt and Grover, 2005),
there is evidence in the empirical study of 129 firms in the United States that IT infrastructure
has an indirect effect on organisational performance (Ravinchandran and Lertwongsatien,
2005). IT resources, including both technology and human resource, create business value for
a firm, where business value is defined as the organisational performance impacts of
information technology (Melville et al., 2004). Recently, Mithas et al. (2007) found that there
is an indirectly positive relationship between IT infrastructure capability and companies’
performance. So, we propose that there is a positive effect of IT infrastructure on performance.
H1: There is a positive relationship between IT infrastructure and organisational
performance.
The IT human resource includes IT technical and managerial skills and IT business and
company knowledge. IT skills and business and company knowledge evolve over time
through the accumulation of experience and learning. Companies with strong IT human
resources are able to:
(a) Integrate the IT and business planning processes more effectively;
(b) Develop reliable and cost effective applications that support the business needs of
the company faster than competitors;
(c) Anticipate future business needs of the company and innovate valuable new product
features before competitors (Bharadwaj, 2000).
The positive contribution of the IT human resource to organisational performance has
been supported by various studies in the literature (Bharadwaj, 2000; Melville et al, 2004;
Bhatt and Grover, 2005; Ravinchandran and Lertwongsatien, 2005). It leads to the hypothesis
that IT human resources have a positive effect on business performance.
H2: There is a positive relationship between IT human resource and organisational
performance.
412
T. L. Pham, E. Jordan / Asia Pacific Management Review 14(4) (2009) 407-426
Creating a good relationship between IT and business groups might take several years. A
continuous interaction and communication between IT groups and other functional groups is
required to get IT projects delivered quickly to meet business demands. In addition, having
good relationships with external partners enables IT services to be provided smoothly to the
company. It is evidence that IT partnership has indirect effects on organisational performance
(Ravinchandran and Lertwongsatien, 2005). Thus, it is hypothesised that IT partnership has
positive effects on business performance.
H3: There is a positive relationship between IT partnership and organisational
performance.
3. Research methodology
3.1 Data collection
Data for testing the research model was collected through a mail survey in Australia.
Australian companies are collected from Who’s Who (2006) database using cluster sampling
and purposive sampling method. Only companies with 50 plus employees were chosen for the
survey with the assumption that most of the companies which have IT personnel incharged
are at least medium size companies, say, more than 50 employees. With this limited types of
companies, from Dun and Bradstreet company database, about 1,500 companies are in the
survey sample.
A questionnaire was prepared based on the literature and pre-existing questions if
available. After Ethics approval from the researchers’ University, questionnaires were sent to
potential respondents by mail. Potential respondents are IT personnel incharged such as CIOs,
IT managers, Information system officers, etc. They are the most informed people in
companies concerning information relating to this study. They were able to either answer the
questionnaire by returning it in a reply-paid envelope or to answer online through the webbased questionnaire. After three weeks, reminder letters were sent out for non respondents.
A total of 140 responses was collected through both online and mail replies. Some 150
questionnaires were returned to the sender; excluding these from the mailout gave a response
rate of 10 percent. This response rate was regarded as acceptable.
3.2 Respondents characteristics
Only 17 percent of respondents’ organisations are in public sector, the rest (83 percent)
are in the private sector. This reflects the business trend that more organisations are now in
the private sector. Most of the respondents are working in the IT function (83.6 percent) and
are in middle-management or executives positions (93 percent). This was expected because
the survey questionnaires were sent directly to IT managers and executive directors of
organisations for forwarding to suitable persons in the organisation. A large part of
respondents (86.4 percent) have at least 2 years working experience with their organisations.
About 64 percent of them have a bachelor and higher education. With such positions, working
experience in organisations and sound education levels, these respondents are believed to
have a sufficient understanding and knowledge to give appropriate and accurate answers
about their organisations. They are believed to be a good sample for this research.
3.3 Measurement of constructs
Information in the questionnaire was collected based on the respondents’ assessment of
their company situation on 7 point scales except for some demographic information questions.
We chose a 7-point scale rather than a 4- or 5-point scale because it is easier to detect smaller
differences with 7 point scales than with others. This research used questions that had been
used previously in other research of Ravinchandran and Lertwongsatien (2005) with some
413
T. L. Pham, E. Jordan / Asia Pacific Management Review 14(4) (2009) 407-426
small modifications in preparing questionnaire. Those modifications related to changing items
from reversed coded to normal coded and changing words for consistency throughout the
study and for being reader-friendly questions (after asking a small group of IT professional
and non-IT people). Detail questions are provided in the appendix of the paper.
- The IT human resource construct has two subconstructs which are IT personnel skills
measured by four items and IT company knowledge measured by six items.
- IT partnership includes two dimensions: internal partnership between IT and
business people measured by 5 observed variables and external partnership between
IT people and external partners (vendors and IT service providers) measured by 3
observed variables.
- IT infrastructure comprises two factors: Network and platform sophistication with 5
items and Data and core applications sophistication with 3 items.
- Company performance was measured by respondents’assesment of the company’s
performance in compared with company’s competitors on two dimensions:
Operating performance (profitability, productivity and financial performance)
measured by four items and market-based performance (success in entering new
market and bring new products and services to the market of the company) measured
by three items.
- The extent to which suppliers, competitors and company’s business partners in an
industry use IT will be used with three-item scale to measure the intensity of IT use
in an industry.
Although the constructs and scale items are taken from previous studies, these
questionnaires are used in the context of Australian companies. Thus, it is reasonable to retest
all measurement models of each construct which is discussed in the next section.
4. Data analysis
The research model was tested using AMOS 7.0. After data preparation, measurement
models for all constructs were tested and then structural model was tested.
4.1 Data preparation
After collecting data, all mailed responses are keyed in with assigned codes. All online
responses are automatically summarised in a data file precoded for each question in the
questionnaires. These two data files were combined and screened for data accuracy. The
percentages of missing data for each variable and question were examined. The highest
missing percentage (9.3 percent) is lower than the maximum acceptable value of 10 percent
for missing values treatment recommended by Malhotra et al. (2004). Those data sets were
retained subject to missing data treatment. All 140 questionnaires were retained for analysis
later.
All missing data were treated in SPSS by maximum likelihood method. The Full
Information Maximum Likelihood (FIML) estimation of missing values is a maximum
likelihood imputation method that can be implemented in computer programs likes AMOS,
LISREL, and SPSS. It is recommended as the best method of treating missing data because it
produces the least bias in the missing values (Chou and Bentler, 1995; Arbuckle, 1999; Hair
et al., 2006).
4.2 Measurement models
The measurement model for each of the construct of IT resources, IT use intensity and
business performance was tested in the following section. The testing method used was the
414
T. L. Pham, E. Jordan / Asia Pacific Management Review 14(4) (2009) 407-426
same for all constructs. Only one test for one construct, namely IT human resource is
discussed here as an example. Other constructs were tested in the same way.
From previous studies (Bollen, 1989; Marsh et al., 2004; Holmes-Smithet et al., 2005;
Sharma et al., 2005; Hair et al., 2006; Malhotra et al., 2006), a table of acceptable criteria for
evaluating measurement and structural models are developed as shown in Table 1.
Table 1. Summary of criteria for evaluating measurement and structural models.
Criteria
Chi-square
Normed Chi-square
Root mean square error of
approximation
Goodness of fit index
Comparative fit index
Cronbach coefficient alpha
Standardized regression
weights
Critical ratio (cr)
Variable reliability
Abbreviation
χ2
Acceptable level/value criteria
p > 0.05 (at α = 0.05 level) good
p > 0.1 (at α = 0.1) is acceptable
1 < χ2/df < 3
RMSEA < 0.01
(df, p)
χ2/df
RMSEA
GFI
CFI
α
Around 0.9
Around 0.9
α > 0.70 good, > 0.6 satisfactory
Good: > 0.7; acceptable: > 0.5
Cr >1.96
Good: > 0.5; moderate > 0.3 < 0.5
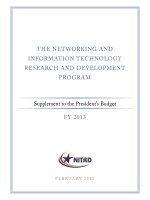
IT human resource comprises two factors: firm specific knowledge of IT personnel and IT
personnel skills. These two factors were tested separately.
HU1
1
e16
1
HU2
1
e17
HUS1
HU3
HU4
1
1
e18
e19
Figure 2. One factor congeneric model of IT personnel skills (HUS1).
IT personnel skills model included four items as shown in Figure 2. The results of the
confirmatory factor analysis of the one factor congeneric measurement model are summarised
in Table 2. From Table 2 we can see that the Cronbach alpha for IT personnel skills one factor
congeneric model is high (0.849), indicating that the variables are a good measure of IT
personnel skills. The standardised regression weight and variable reliability for each variable
is greater than 0.7 and 0.5. That means this model is a good measurement model for IT
415
T. L. Pham, E. Jordan / Asia Pacific Management Review 14(4) (2009) 407-426
personnel skills with the evidence of convergent validity. In addition, all goodness of fit
indices RMSEA, GFI, CFI and the p value are within the acceptable levels of criteria,
showing that the model fitted the data well.
Table 2. Standardised and fit estimates of the IT personnel skills model.
Standardized regression weights
HU1
HU2
HU3
HU4
<--<--<--<---
HUS1
HUS1
HUS1
HUS1
Estimate
0.805
0.735
0.794
0.725
C.R.
P
8.594
***
9.248
***
8.474
***
Recommended
value
α > 0.70
Reliability- Cronbach alpha
Chi-square
Degree of freedom (df)
P > 0.05
(at α = 0.05 level)
P
Root mean square error of approximation
(RMSEA)
Goodness of fit index (GFI)
Comparative fit index (CFI)
RMSEA < 0.1
~ 0.9
~ 0.9
Variable
reliability
0.648
0.540
0.630
0.526
results
0.849
5.378
2
0.068
0.110
0.981
0.985
Sources: (a). Summarised from maximum likelihood estimation with AMOS 7.0.
(b). Recommended values adapted from Kline (1998); Holmes-Smith et al.(2005);
Hair et al. (2006), Schumacker and Lomax(2004).
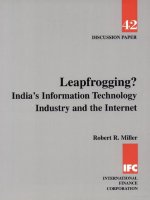
IT personnel knowledge model initially included six items. The model with all six items
did not fit the data well. The model modification procedure suggested by Holmes-Smith et al.
(2005) was applied to improve the model. After considering low factor loading items,
standardised residual covariances matrix, and the significance of the parameters, item HU5
and HU10 were dropped from the model.
HU6
HU7
HUS
1
HU8
HU9
1
1
1
1
e13
e14
e15
e16
Figure 3. One factor congeneric model of IT personnel knowledge (HUS).
The final model was shown in Figure 3 with the results of the confirmatory factor analysis
of the one factor congeneric measurement model summarised in Table 3.
From Table 3 we can see that the Cronbach coefficient alpha for IT personnel knowledge
is high (0.849), indicating that the variables are a good measure of the construct. The
standardised regression weight and variable reliability for each variable was greater than 0.5
and 0.3. That means this model is a good measurement model for IT personnel knowledge
416
T. L. Pham, E. Jordan / Asia Pacific Management Review 14(4) (2009) 407-426
with the evidence of convergent validity. In addition, all goodness of fit indices RMSEA, GFI,
CFI and the p value are within the acceptable levels of criteria, showing that the model fitted
the data well.
Table 3. Standardised and fit estimates of the IT personnel knowledge model.
Standardized regression weights
HU7
HU6
HU8
HU9
<--<--<--<---
HUS
HUS
HUS
HUS
Estimate
C.R.
P
0.872
0.666
0.808
0.734
10.473
7.989
***
***
Reliability- Cronbach alpha
Chi-square
Degree of freedom (df)
8.959
***
Recommended
value
α >0.70
P > 0.05 (α =
0.05)
P
Root mean square error of approximation
(RMSEA)
Goodness of fit index (GFI)
Comparative fit index (CFI)
RMSEA < 0.1
~ 0.9
~ 0.9
Variable
reliability
0.761
0.443
0.654
0.538
Results
0.849
4.589
2
0.101
0.097
0.983
0.989
Sources: (a). Summarised from maximum likelihood estimation with AMOS 7.0.
(b). Recommended values adapted from Kline (1998); Holmes-Smith et al.
(2005); Hair et al. (2006) Schumacker and Lomax (2004).
The measurement model of IT human resource was checked by putting these two
subfactors together. The initial model did not fit well with the data. The model modification
procedure suggested by Holmes-Smith et al. (2005) was applied to improve the model.
Standardised Residual Covariances matrix was checked. There were high covariances
between HU6 and HU3, HU6 and HU4. After checking significant paths and modification
indices, item HU6 was dropped from the model. The final model and related results were
shown in Figure 4 and Table 4.
1
HU1
e16
1
1
HU2
e17
HUS1
1
HU3
1
HU4
HU7
1
e18
e19
e12
1
HU8
HUS
HU9
1
1
e13
e14
Figure 4. Measurement model of IT human resource.
417
T. L. Pham, E. Jordan / Asia Pacific Management Review 14(4) (2009) 407-426
Table 4 shows that the Cronbach coefficient alpha for IT human resource construct is high
(0.836), indicating that the variables are good measures of the construct.
Table 4. Standardised and fit estimates of the IT human resource model.
Standardized regression weights
HU1
HU2
HU3
HU4
HU9
HU8
HU7
<--<--<--<--<--<--<---
HUS1
HUS1
HUS1
HUS1
HUS
HUS
HUS
Estimate
C.R.
0.806
0.727
0.797
0.728
0.751
0.834
0.839
8.595
9.426
8.601
9.139
9.876
P
Variable reliability
***
***
***
***
***
0.650
0.529
0.635
0.530
0.564
0.695
0.704
Recommended
value
α > 0.70
Reliability- Cronbach alpha
Chi-square
Degree of freedom (df)
results
0.836
17.743
13
p > 0.05
(at α = 0.05 level)
P
Root mean square error of approximation
(RMSEA)
Goodness of fit index (GFI)
Comparative fit index (CFI)
0.168
0.051
RMSEA < 0.1
~ 0.9
~ 0.9
0.968
0.989
Sources: (a). Ummarised from maximum likelihood estimation with AMOS 7.0.
(b). Recommended values adapted from Kline (1998); Holmes-Smith et al.(2005); Hair et al.(2006),
Schumacker and Lomax (2004).
The standardised regression weight and variable reliability for each variable was greater
than 0.7 and 0.5. That means this model is a good measurement model for IT human resource
construct with the evidence of convergent validity. In addition, all goodness of fit indices
RMSEA, GFI, CFI and the p value are within the acceptable levels of criteria, showing that
the model fitted the data well.
For others constructs, the testing processes are the same. As shown in Table 5, all final
constructs have very high Cronbach alphas, higher than 0.74 with factor loadings higher than
0.5, indicating that the constructs are measured well by the data and the scales have adequate
reliability.
Table 5. Cronbach alpha of constructs.
Composite variable
Name of construct
Cronbach alpha
HUMAN
IT human resources
0.836
INFRA
IT infrastructure
0.810
PARTNER
IT partnership
0.828
MARKET
Market-based performance
0.782
OPERAT
Operational performance
0.742
INTEN
IT use intensity
0.808
418
T. L. Pham, E. Jordan / Asia Pacific Management Review 14(4) (2009) 407-426
4.3 Structural model
After all measurement models are tested, composite variables for IT human resource, IT
partnership, IT infrastructure, IT use intensity, Market-based performance and Operating
performance are calculated based on Factor score weight matrices in AMOS output. These
variables are to be tested for discriminant validity. Because correlations between theoretically
similar measures should be high, the correlations coefficients are used to test the discriminant
validity of these composite variables. A large correlation coefficient (above 0.80 or 0.90)
suggests a lack of discriminant validity of the construct (Holmes-Smith et al., 2004). Table 6
shows correlation coefficients between independent composite variables used in this study.
All coefficient correlations are below 0.56, indicating the evidence of discriminant validity for
these constructs.
Table 6. Correlations test for variables.
IT USE
IT USE
1
OPERAT
MARKET
HUMAN
INFRA
PARTNER
INTEN
0.236**
0.273**
0.551**
0.528**
0.369**
0.443**
OPERAT
0.236**
1
0.318**
0.195*
0.240**
0.134
0.136
MARKET
0.273**
0.318**
1
0.289**
0.252**
0.121
0.255**
HUMAN
0.551**
0.195*
0.289**
1
0.460**
0.568**
0.243**
INFRA
0.528**
0.240**
0.252**
0.460**
1
0.361**
0.292**
PARTNER
0.369**
0.134
0.121
0.568**
0.361**
1
0.161
INTEN
0.443**
0.136
0.255**
0.243**
Notes: (a). ** Correlation is significant at the 0.01 level (2-tailed).
(b). * Correlation is significant at the 0.05 level (2-tailed).
0.292**
0.161
1
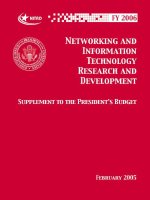
These composite variables are put together to test the structural model as shown in Figure
5 with statistical results in Table 7.
Table 7. Fit indices of IT resources and performance model.
Goodness of fit indices
CMIN
DF
P
GFI
RMSEA
CFI
Acceptable level
p>0.05 (at α = 0.05 level)
~ 0.9
RMSEA <0.1
~ 0.9
Results
1.609
3
0.657
0.996
0.000
1.000
Sources: (a). Summarised from maximum likelihood estimation with AMOS 7.0.
(b). Recommended values adapted from Kline (1998); Holmes-Smith et al.(2005); Hair et al.
(2006) Schumacker and Lomax (2004).
In Table 7, a very high value of p (0.657), high value of GFI (0.996) and CFI (1.000)
indicate that this research model fits well with the data. Figure 5 shows the path coefficients
and the R2 value of the structure model. The R-square value of 0.29 means 29 percent of the
variance in organisational performance is significantly explained by the model with IT human
resource, IT infrastructure, IT partnership and IT intensity. A model without the presence of
IT intensity was also tested which gave the R2 value of 0.26. Thus, the addition of the IT
intensity variable to the whole model accounted for a small increase of 3 percent (product of
419
T. L. Pham, E. Jordan / Asia Pacific Management Review 14(4) (2009) 407-426
29 percent -26 percent) in R2 value of business performance. In the main model, the
association between IT intensity and business performance is also significant at 0.05 levels (p
= 0.042).
Intensity
e3
.24
Humanresource
.29
.16
.23
.46
.57
.44
performance
.22
Infrastructure
.19
.29
.32
MKT1
e1
.47
.68
OPT1
e2
-.10
.36
Partnership
Figure 5. IT resources and business performance model.
Checking the significant paths of the model in Figure 5, the associations between IT
Human resources with organisational performance are significant at 0.05 levels (p = 0.02).
That means Hypothesis H2 is supported by the data. The association path between IT
infrastructure and business performance is not significant at 0.05 levels (p = 0.077); but it is
significant at 0.1 levels. That means there is a relationship between IT infrastructure and
business performance, and Hypothesis H1 is supported by the data. Hypothesis H3 – the
relationship between IT partnership and business performance – is not supported by the data,
this path is not statistically significant at 0.05 levels (p = 0.45). Table 8 summarises the results
for all hypothesised relationships in the model. From the paths in Figure 5, it is shown that IT
human resource has the most effect on organisational performance. IT infrastructure is the
second IT resource having effect on while IT partnership has no significant contribution to
business performance.
Table 8. Summarised test results for research hypotheses.
No.
1
2
3
Hypotheses
Tested results
H1: There is a positive relationship between IT
Infrastructure and Organisational performance.
H2: There is a positive relationship between IT
human resource and Organisational performance.
H3: There is a positive relationship between IT
partnership and Organisational performance.
420
Supported
Supported
Not supported
T. L. Pham, E. Jordan / Asia Pacific Management Review 14(4) (2009) 407-426
5. Discussion
Drew from the resource-based perspective, this study empirically examined how IT
resources affect business performance. We argued and found that variation in companies’
business performance is explained by the combination of the three main categories of IT
resources (IT human resources, IT infrastructure and IT partnership) with the presence of IT
use intensity in industries. Of which two of the three hypotheses are supported by the data. It
is argued that the three main categories of IT resources are tightly related and are the
foundations of IT capability which helps companies achieve long-term competitiveness (Ross
et al., 1996). However, a lack of significant between IT partnership and business performance
found in our study suggests that IT partnership might not directly contribute to make the
differentiation of companies’ performance. We found that IT human resources and IT
infrastructure have contributions to business performance.
IT infrastructure has a contribution to business performance but the relation is not strong
(p = 0.07). This results is consistent with the common view in the field that the development
of a high quality IT infrastructure is ambiguous, follows a path-dependent development and
provides first mover advantage to the company (Bhatt and Grover, 2005). It is different from
results of Bhatt and Grover research (2005) which closely aligned with the notable argument
of Carr (2003) that ubiquity of IT infrastructures is accessible to all and not a source of
differentiation. The rational for this result could be that studies were conducted in different
context in terms of economic development and culture. In the present time and in Australian
context, IT infrastructure might be still not a commodity that all companies can afford and
access to. IT infrastructure may be still heterogeneous, not convergent and the knowledge of
how to deploy it effectively might be different among companies. That might lead to the case
that IT infrastructure still has an important role in making companies’ performance
differentiation.
IT human resources include two factors: IT personnel skills (comprised business,
technology, managerial and interpersonal skills) and company specific knowledge of IT
people. The development of these skills evolves over time through accumulation of
experience and learning and requires organisational efforts. Thus, companies with high
competent IT people may be able to create performance differentiation. This study found that
the positive relationship between IT human resource and business performance is the
strongest relation compared with those of other IT resources. Given the scarcity of
companies’ resources, companies need to set a right priority for their investment and effort.
That means although IT resources are all important, companies need to focus on the more
important ones which are suggested in this research firstly IT human resources, then IT
infrastructure.
The “not significant” relation between IT partnership and Performance might suggest that
companies need to concentrate on improving their IT human resource and IT infrastructure
rather than IT partnership in finding the performance improvement. As long as IT personnel
have good technical skills, a good business knowledge and a good knowledge of company
procedures, in addition to the needed IT infrastructure, they can work and provide needed IT
services to improve business performance.
Although this study uses Ravinchandran and Lertwongsatien (2005)’s constructs for its
model, it is different from earlier studies in some aspects. The first one is that it analyses the
association between IT resources and performance directly with broaden perspectives and
detail measurement of constructs. The second one is that it studies the association at a detail
level, and provides a clear idea on which IT resource contributes the most to business
performance which helps companies focus on the more important resources. This study was
421
T. L. Pham, E. Jordan / Asia Pacific Management Review 14(4) (2009) 407-426
conducted in the context of Australian business which is the third difference from previous
studies in the field.
6. Limitations and further research
One limitation of this study is that questionnaire was answered by only one respondent in
each company. Although the data reflects the opinion of one person, it represents the
perceptions of IT personnel in charged who is the most informed in a company relating to
information technology knowledge in the company. This way of selecting respondent is
consistent with what is recommended by Huber and Power (Huber and Power, 1985) that
when one respondent per unit is solicited, it should be the most informed respondent.
However, it would be better for future studies to consider research designs that allow data
collection from multiple respondents within a company.
Other limitation of the study is that we use the same respondent for getting both
independent and dependent variables. This leads to a common method bias issue. Although,
statistically it does not seem to be a major issue (Bhatt and Grover, 2005), future studies
should consider to use multiple methods of measurement to alleviate any potential bias.
This study only deals with the association of IT resources as well as each of its three
component resources and organisational performance. It would be further extended at least in
two directions. Firstly, factors relating to external environment such as industry categories,
competitive environment in industries, etc. would be considered to add to the model for future
research. Secondly, more studies on factors contributing to improvement of IT resources
would be of great help for companies’ management in practice.
7. Conclusion
This study refines the constructs and the measures of IT capability/IT resources in
Ravinchandran and Lertwongsatien (2005) in the context of Australian businesses. The model
of IT resources impacting business performance directly is proposed in this study. Answering
the question of which IT resources or which IT capability component has the most effect on
performance is really important to help managements to focus their company resources on the
right priorities. From a practical aspect, this study is expected to help managements of
companies to have a clearer view of how to enhance the benefits of IT capability on
companies’ performance by understanding and focusing the company’s resources on the
important components. The results of this study show that human resource is the most
important resource which has the strongest effects on organisational performance. Thus,
companies those want to improve their performance need to concentrate on improving their IT
human resource as the first priority and then IT infrastructure as the second priority rather
than IT partnership.
Acknowledgements
We are grateful to two blind reviewers and participants of the 13th Asia Pacific
Management Conference where an earlier version of the paper was presented for useful
comments and suggestions that significantly improved this version of the paper.
This research was funded by Vietnamese Government and Macquarie Graduate School of
Management, Macquarie University, Australia.
422
T. L. Pham, E. Jordan / Asia Pacific Management Review 14(4) (2009) 407-426
References
Alchian, A., Demsetz, H. (1972) Production, information costs, and economic organization.
American Economic Review, 62(5), 777-795.
Amit, R., Schoemaker, P.J.H. (1993) Strategic assets and organisational rent. Strategic
Management Journal, 14(1), 33-46.
Arbuckle, J.L. (1999) AMOS 4.0 User's Guide. SmallWaters Corporation, Chicago.
Barney, J. (1991) Firm resources and sustained competitive advantage. Journal of
Management, 17(1), 99-120.
Barney, J. (2002) Gaining and Sustaining Competitive Advantage. Pearson Education, Upper
Saddle River, N.J.
Bharadwaj, A.S. (2000) A resource-based perspective on information technology capability
and firm performance: An empirical investigation. MIS Quarterly, 24(1), 169-196.
Bhatt, G.D., Grover, V. (2005) Types of information technology capabilities and their role in
competitive advantage: An empirical study. Journal of Management Information Systems,
22(2), 253-277.
Bollen, K.A. (1989) Structural Equations with Latent Variables. John Wiley & Sons Inc.,
New York.
Cameron, K. (1986) Effectiveness as paradox: Consensus and conflict in conceptions of
organizational effectiveness. Management Science, 32(5), 539-553.
Carr, N.G. (2003) IT doesn't matter. Harvard Business Review, 81(5), 41-49.
Carton, R.B., Hofer, C.W. (2006) Measuring Organizational Performance: Metrics for
Entrepreneurship and Strategic Management Research. Edward Elgar, Cheltenham, UK.
Chou, C.P., Bentler, P.M. (1995) Estimates and tests in structural equation modeling. In
Hoyle, R.H. (Ed.) Structural Equation Modeling. Sage Pulications, Thousand Oaks. pp.3759.
Feeny, D.F., Willcocks, L.P. (1998) Core IS capabilities for exploiting information
technology. Sloan Management Review, 39(3), 9-21.
Ford, J.D., Schellenberg, D.A. (1982) Conceptual issues of linkage in the assessment of
organizational performance. Academy of Management Review, 7(1), 49-58.
Hair, J.F., Black, W.C., Babin, B.J., Anderson, R.E., Tatham, R.L. (2006) Multivariate Data
Analysis. Pearson Prentice Hall, Upper Saddle River, N.J.
Hitt, L.M., Brynjolfsson, E. (1996) Productivity, business profitability, and consumer surplus:
Three different measures of information technology value. MIS Quarterly, June, 121-142.
Holmes-Smith, P., Coote, L., Cunningham, E. (2004) Structural equation modeling: From the
fundamentals to advanced topics. School Research, Evaluation and Measurement Services,
Melbourne.
Holmes-Smith, P., Coote, L., Cunningham, E. (2005) Structural equation modeling: From the
fundamentals to advanced topics. School Research, Evaluation and Measurement Services,
Melbourne,
Huber, G.P., Power, D.J. (1985) Retrospective reports of strategic-level managers: Guidelines
for increasing accuracy. Strategic Management Journal, 6(2), 171-180.
Jensen, M., Meckling, D. (1976) Theory of the firm: Managerial behavior, agency costs, and
ownership structure. Journal of Financial Economics, 3(4), 305-360.
Kline, R.B. (1998) Principles and Practice of Structural Equation Modeling. The Guilford
Press, New York.
Malhotra, N.K., Hall, J., Shaw, M., Oppenheim, P.P. (2004) Essentials of Marketing Research:
An Applied Orientation. Pearson Prentice Hall, NSW Australia.
Malhotra, N.K., Hall, J., Shaw, M., Oppenheim, P.P. (2006) Marketing Research: An Applied
Orientation. Pearson Prentice Hall, NSW Australia.
423
T. L. Pham, E. Jordan / Asia Pacific Management Review 14(4) (2009) 407-426
Marsh, H.W., Hau, K.T., Wen, Z. (2004) In search of golden rules: Comment on hypothesistesting approaches to setting cutoff values for fit indexes and dangers in overgeneralizing.
Hu, Bentlers (1999) Findings. Structural Equation Modeling, 11(3), 320-341.
Mata, F.J., Fuerst, W.L., Barney, J.B. (1995) Information technology and sustained
competitive advantage: A resource-based analysis. MIS Quarterly, 19(4), 487-505.
Melville, N., Kraemer, K., Gurbaxani, V. (2004) Review: Information technology and
organisational performance: An integrative model of IT business value. MIS Quarterly,
28(2), 283-322.
Mithas, S., Ramasubbu, N., Krishnan, M.S., Sambamurthy, V. (2007) Information technology
infrastructure capability and firm performance: An empirical analysis. Ross School of
Business, University of Michigan. Available at SSRN: />Murphy, G.B., Trailer, J.W., Hill, R.C. (1996) Measuring performance in entrepreneurship
research. Journal of Business Research, 36(1), 15-23.
Peppard, J., Ward, J. (2004) Beyond strategic information systems: Towards an IS capability.
The Journal of Strategic Information Systems, 13(2), 167-194.
Ravinchandran, T., Lertwongsatien, C. (2005) Effect of information systems resources and
capabilities on firm performance: A resource-based perspective. Journal of Management
Information Systems, 21(4), 237-276.
Ross, J.W., Beath, C.M., Goodhue, D.L. (1996) Develop long-term competitiveness through
IT assets. Sloan Management Review, 38(1), 31-42.
Sanders, N.R., Premus, R. (2005) Modelling the relationship between firm IT capability,
collaboration, and performance. Journal of Business Logistics, 26(1), 1-23.
Santhanam, R., Hartono, A. (2003) Issues in linking information technology capability to firm
performance. MIS Quarterly, 27(1), 125-153.
Schumacker, R.E., Lomax, R.G. (2004) A Beginner's Guide to Structural Equation Modeling.
Lawrence Erlbaum Associates Publishers, N.J.
Sharma, S., Mukherjee, S., Kumar, A., Dillon, W. R. (2005) A simulation study to investigate
the use of cutoff values for assessing model fit in covariance structure models. Journal of
Business Research, Special Section: Cross-functional cases in management education,
58(7), 935-943.
Steers, R.M. (1975) Problems in the measurement of organizational effectiveness.
Administrative Science Quarterly, 20(4), 546-557.
Venkatraman, N., Ramanujam, V. (1986) Measurement of business performance in strategy
research: A comparison of approaches. Academy of Management Review, 11(4), 801-814.
Voss, G.B., Voss, Z.G. (2000) Strategic orientation and firm performance in an artistic
environment. Journal of Marketing, 64(1), 67-83.
Wade, M., Hulland, J. (2004) Review: The resource-based view and information systems
research: Review, extension, and suggestions for future research . MIS Quarterly, 28(1),
107-142.
Weill, P. (1993) The role and value of information technology infrastructure: Some empirical
observations. In Banker, R.D., Kauffman, R.J., Mahmood, M.A. (Eds.) Strategic
Information Technology Management Perspectives on Organizational Growth and
Competitive Advantage. Idea Group Publishing, Harrisburg, PA. pp. 547-572
Zhang, M., McCullough, J., Wei, R.Y. (2004) Effects of organisational structure and
information technology capability on organisational effectiveness in emerging markets.
Journal of the Academy of Business and Economics, Jan, 1-23.
424
T. L. Pham, E. Jordan / Asia Pacific Management Review 14(4) (2009) 407-426
Appendix: Related constructs questions used in the questionnaire:
1. IT use intensity.
Statements
Strongly
disagree
1
2
3
4
2. IT is used extensively by our suppliers and
business partners.
1
2
3
3. IT is a critical means to interact with customers in
our industry.
1
2
3
1. IT is used extensively by our competitors.
5
Strongly
agree
6
7
N/A
0
4
5
6
7
0
4
5
6
7
0
2. Organisation’s performance compared to competitors. Please circle a position on the scale
that best fits your opinion.
Statements
1. We have entered new markets very quickly.
2. We have brought new products and services to the
market faster than our competitors.
3. The success rates of our new products and services
have been very high.
4. Our productivity has exceeded that of our
competitors.
5. Our profit has exceeded that of our competitors.
6. Our financial performance has been outstanding.
7. Our financial performance has exceeded that of our
competitors.
Strongly
disagree
1
2
1
2
5
5
Strongly
agree
6
7
6
7
3
3
4
4
1
2
3
1
2
1
1
1
2
2
2
N/A
0
0
4
5
6
7
0
3
4
5
6
7
0
3
3
3
4
4
4
5
5
5
6
6
6
7
7
7
0
0
0
3. Information technology resources.
a. IT human resources. Please circle a position on the scale that best fits your opinion.
Statements
1. Our IT staff has very good technical knowledge;
they are one of the best technical groups an IT
department could have.
2. Our IT staff has the ability to quickly learn and
apply new technologies as they become available.
3. Our IT staff has the skills and knowledge to manage
IT projects in the current business environment.
4. Our IT staff has the ability to work closely with
customers and maintain productive user or client
relationship.
5. Our IT staff has excellent business knowledge; they
have a deep understanding of the business priorities
and goals of our organisation.
6. Our IT staff understands our organisation’s
technologies and business processes very well.
7. Our IT staff understands our organisation’s
procedures and policies very well.
8. Our IT staff is aware of the core beliefs and values
of our organisation.
9. Our IT staff knows who are responsible for
important task in this organisation.
425
Strongly
disagree
1
2
5
Strongly
agree
6
7
3
4
1
2
3
1
2
1
N/A
0
4
5
6
7
0
3
4
5
6
7
0
2
3
4
5
6
7
0
1
2
3
4
5
6
7
0
1
2
3
4
5
6
7
0
1
2
3
4
5
6
7
0
1
2
3
4
5
6
7
0
1
2
3
4
5
6
7
0
T. L. Pham, E. Jordan / Asia Pacific Management Review 14(4) (2009) 407-426
Statements
10. Our IT staff is conversant with the routines and
methods used in the IT department.
Strongly
disagree
1
2
3
4
5
Strongly
agree
6
7
N/A
0
b. IT infrastructure. Please circle a position on the scale that best fits your opinion.
Statements
1. The technology infrastructure needed to
electronically link our business units is present and
in place today.
2. The technology infrastructure needed to
electronically link our firm with external business
partners (i.e., key customer, suppliers, alliances) is
present and in place today.
3. The technology infrastructure needed for current
business operations is present and in place today.
4. The capacity of our network infrastructure
adequately meets our current business needs.
5. The speed of our network infrastructure adequately
meets our current business needs.
6. Corporate data is currently sharable across business
units and organisational boundaries.
7. Our application systems are very modular; most
program modules can be easily reused in other
business applications.
8. We have standardised the various components of
our technology infrastructure (i.e., hardware,
network, and database).
Strongly
disagree
1
2
5
Strongly
agree
6
7
3
4
1
2
3
1
2
1
N/A
0
4
5
6
7
0
3
4
5
6
7
0
2
3
4
5
6
7
0
1
2
3
4
5
6
7
0
1
2
3
4
5
6
7
0
1
2
3
4
5
6
7
0
1
2
3
4
5
6
7
0
c. IT partnership. Please circle a position on the scale that best fits your opinion.
Statements
1. Critical information and knowledge that affect IT
projects are shared freely between our business
units and IT department.
2. Our IT department and business units understand
the working environment of each other very well.
3. There is high degree of trust between our IT
department and business units.
4. The goals and plans for IT projects are jointly
developed by both the IT department and business
units.
5. Conflicts between IT department and business units
are rare and few in our organisation.
6. We seldom have conflicts with our IT vendors and
service providers.
7. We can rely on our IT vendors and service
providers to respond to our IT needs in a timely
and effective manner.
8. We have long-term partnerships with our key IT
vendors and service providers.
426
Strongly
disagree
1
2
5
Strongly
agree
6
7
3
4
1
2
3
1
2
1
N/A
0
4
5
6
7
0
3
4
5
6
7
0
2
3
4
5
6
7
0
1
2
3
4
5
6
7
0
1
2
3
4
5
6
7
0
1
2
3
4
5
6
7
0
1
2
3
4
5
6
7
0