DSpace at VNU: Extraction of oil from Moringa oleifera kernels using supercritical carbon dioxide with ethanol for pretreatment: Optimization of the extraction process
Bạn đang xem bản rút gọn của tài liệu. Xem và tải ngay bản đầy đủ của tài liệu tại đây (798 KB, 7 trang )
Chemical Engineering and Processing 50 (2011) 1207–1213
Contents lists available at ScienceDirect
Chemical Engineering and Processing:
Process Intensification
journal homepage: www.elsevier.com/locate/cep
Extraction of oil from Moringa oleifera kernels using supercritical carbon dioxide
with ethanol for pretreatment: Optimization of the extraction process
Hoang N. Nguyen a,∗ , Pag-asa D. Gaspillo a , Julius B. Maridable a , Roberto M. Malaluan b ,
Hirofumi Hinode c , Chris Salim c , Ha K.P. Huynh d
a
Department of Chemical Engineering, College of Engineering, De La Salle University, 2401 Taft Avenue, 1004 Manila, Philippines
Department of Chemical Engineering Technology, School of Engineering Technology, Iligan Institute of Technology, Mindanao State University, Andres Bonifacio Avenue, Tibanga,
9200 Iligan City, Philippines
c
Department of International Development Engineering, Graduate School of Science and Engineering, Tokyo Institute of Technology, 2-12-1-I4-1, Ookayama, Meguro-ku, Tokyo
152-8550, Japan
d
Department of Inorganic Chemistry, Faculty of Chemical Engineering, Ho Chi Minh City University of Technology, 268 Ly Thuong Kiet Street, District 10, Ho Chi Minh City, Viet Nam
b
a r t i c l e
i n f o
Article history:
Received 26 March 2011
Received in revised form 4 July 2011
Accepted 9 August 2011
Available online 27 August 2011
Keywords:
Moringa oleifera seed oil
Supercritical carbon dioxide
Optimization
Ethanol for pretreatment
Response surface methodology
a b s t r a c t
The study involved the extraction of oil from Moringa oleifera (MO) kernels using supercritical fluid
extraction (SFE) technique. The arrays of operating parameters are extraction condition, loading configuration, and SC-CO2 with ethanol addition for substrate pretreatment. It identifies a combination of
operating parameters that provide a higher yield. The experiments were conducted in the pressure range
of 15–30 MPa, 35–60 ◦ C temperature interval, average particle size of 0.16–1.12 mm and CO2 flow rate
of 0.5 m3 /h. Adding 10% EtOH for substrate pretreatment, increased 10% in the yield. No significant difference in yield and fatty acid content between the oil from SC-CO2 -EtOH and Soxhlet extraction with
n-hexane was detected. Loading the seeds in multiple-staged trays increased to as much as 26.89% in the
yield against randomly packed configuration. Response surface methodology, predicted an optimal oil
yield of 37.84% at a pressure of 28.97 MPa, 44.30 ◦ C temperature, and particle size of 0.54 mm. A crossover
pressure point of Ben oil was found within the range 22.5–30 MPa.
© 2011 Elsevier B.V. All rights reserved.
1. Introduction
Moringa oleifera which has its origin in India is locally wellknown in the Philippines as Malunggay and is also popular in
other countries in Asia, Africa, South America, the Caribbean and
Oceania [1,2]. The food derived from the plant is high in nutritional value [3,4]. In more recent years, other uses of the plant
cited medicinal applications and environmental applications [5–9].
M. oleifera seed oil, also known as Ben oil, has been reported to
contain very high oleic oil (70% oleic acid) and smells a pleasant peanut-like fragrance [10,11]. Oleic acid, a mono-unsaturated
fatty acid, has strong oxidative stability when compared to polyunsaturated fatty acids essential for longer storage and at high
temperature frying process. Ben oil is more stable than canola oil,
soybean oil, and palm olein when used in frying [12]. Blending Ben
oil with sunflower oil and soybean oil enhances the oxidative stability of the mixture [13]. Furthermore, ingesting mono-unsaturated
fatty acid reduces the risk of developing coronary heart disease
∗ Corresponding author. Tel.: +63 2 5240563; fax: +63 2 5240563.
E-mail address: (H.N. Nguyen).
0255-2701/$ – see front matter © 2011 Elsevier B.V. All rights reserved.
doi:10.1016/j.cep.2011.08.006
as opposed to saturated and trans fatty acids [12,13]. Extraction
of oil from M. oleifera seeds by cold pressing, aqueous enzymatic
methods, or the traditional extraction process with the use of conventional solvent such as n-hexane, petroleum ether was already
studied [10,14]. However, non-solvent methods such as cold press
method or enzyme extraction were reported to produce low oil
yield. While extraction using n-hexane or light petroleum ether
propels high yield, the possible thermal degradation of the light
components in the oil and the incomplete elimination of the toxic
solvents are some of the drawbacks of the traditional extraction
process. Using supercritical carbon dioxide (SC-CO2 ) for extraction
overcomes the disadvantages of the traditional solvent extraction.
SC-CO2 is a likely substitute to organic solvents because it is nontoxic, has flexible properties, and easy to separate from extracted oil
by depressurization. In addition, its density, solubility, diffusivity,
and viscosity can be varied widely with the change in pressure and
temperature [15–18]. Successes in using SC-SO2 to extract oil from
the seeds of sunflower, palm, hazel, jojoba, rape and peach were
reported [19–24]. However, no literature has been published yet
regarding the extraction of Ben oil using SC-CO2 and supercritical
carbon dioxide with ethanol addition for substrate pretreatment
(SC-CO2 -EtOH). In this paper, the M. oleifera seed oil extraction was
1208
H.N. Nguyen et al. / Chemical Engineering and Processing 50 (2011) 1207–1213
investigated using SC-CO2 and SC-CO2 -EtOH. The study also examined the influence of modifying the loading of raw materials into
the extraction vessel vis-à-vis the yield of the product. The yield
was compared in a multi-layered (similar to multiple stages packed
bed) packing arrangement of the ground kernels to that of randomly
charged (similar to random packed bed) configuration. The extraction yield and the fatty acid component of Ben oil extracted using
SC-CO2 , SC-CO2 -EtOH and n-hexane were compared. Optimization
of the process parameters was also included in the study.
2. Materials and methods
2.1. Material and sample preparation
Air dried M. oleifera seeds were sourced from Ilocos Norte
and Ilocos Sur situated in the Northern part of the Philippine
archipelago. The seeds were decoated and the good quality kernels that were not moldy or breached were selected. MO kernels
were ground a few hours before extraction to minimize the effect
of oxidation of the oil. The ground kernels contained 8.7% moisture in weight. The ground kernels were sieved to average particle
sizes of 0.16 mm, 0.32 mm, 0.64 mm and 1.12 mm. Commercial CO2
supplied by SUGECO (a local company). Analytical grade ethanol
(99.9% v/v, EtOH), standard chemical for fatty acid analysis such
as fatty acid methyl ester of myristic acid (C14:0 ), palmitic acid
(C16:0 ), palmitoleic acid (C16:1 ), stearic acid (C18:0 ), oleic acid (C18:1 ),
linoleic acid (C18:2 ), linolenic acid (C18:3 ), arachidic acid (C20:0 ),
cis-11-eicosenoic acid (C20:1 ), behenic acid (C22:0 ), tetracosanoic
acid (C24:0 ) and other chemicals such as n-hexane (GC analytical grade), methyl acetate (99.5%), acetic acid (99.7%), dehydrated
diethyl ether (99.5%), sodium methoxide (0.5 M) in dry methanol,
solid sodium were all supplied by Sigma–Aldrich, Inc. and Wako
Pure Chemical Industries, Ltd., Japan.
2.2. Supercritical extraction methods
The extraction using SC-CO2 was carried out in a pilot plant
(fabricated in Akico, Japan) at the Department of Chemical Engineering Technology, Mindanao State University – Iligan Institute of
Technology, Iligan City, Philippines. Seventy grams of the ground
kernels was loaded into a 500 mL-extractor by two methods. The
first method was randomly packed where the ground kernels were
dumped into the extractor forming a layer. The other method was
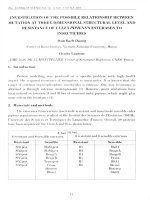
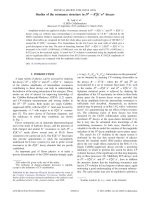
loading the ground kernels arranged in multi-layers as illustrated
in Fig. 1a. The number of layers and the thickness of each layer were
varied as presented in the first two columns in Table 3. The distance
between layers was 10 mm. The schematic illustration of the pilot
plant is shown in Fig. 1b. The CO2 was first liquified before passing to
a high pressure pump (with maximum capacity of 35 MPa). The CO2
liquid was then heated until it reached supercritical state. In this
work, the pressure and temperature of the SC-CO2 were varied from
15 to 30 MPa and from 35 to 60 ◦ C, respectively. The supercritical
CO2 flowed through the extractor and the SC-CO2 – oil solution from
the extractor passed through the expansion valve where the oil was
separated from CO2 . The oil was collected in a vessel while the CO2 ,
passed through a rotameter at a fixed rate of 0.5 m3 /h (equivalent
to 0.45 kg/h) before being released to the atmosphere. In the SCCO2 -EtOH process, the EtOH was added directly to the extractor
together with the ground kernels. The substrate were soaked with
EtOH in the actual processing environment for about 45 min before
extraction commenced which was conducted until no significant
change in oil yield was observed to nearly 7 h of continuous run
[25]. In this study, the percentage of EtOH is expressed as the initial weight of EtOH versus that of 500 mL CO2 at the processing
condition.
2.3. Solvent extraction
Soxhlet extraction using n-hexane was conducted following
the methods of analysis by the Association of Official Analytical
Chemists (AOAC) [26]. About 5 g of MO ground kernels was packed
in filter paper before loading in the Soxhlet extractor. Extraction
time was 8 h. The oil was obtained by evaporating the solvent at
100 ◦ C until a constant weight was attained. The oil yield is a ratio
of the weight of the oil with that of the MO kernel.
2.4. GC analysis
The analysis of fatty acid components of MO oil was conducted at
Department of International Development Engineering, Graduate
School of Science and Engineering, Tokyo Institute of Technology,
Tokyo, Japan. The oil was converted to fatty acid methyl esters using
the method of Christie [27]. Up to 2 mg of oil was dissolved by mixing 0.5 mL sodium-dried diethyl ether, 20 L methyl acetate and
40 L sodium methoxide. After 5 min, the reaction was stopped by
adding 2 L acetic acid. Nitrogen was used to evaporate the solvent and 1 mL hexane was then added. The solid precipitate was
separated from the solution by using centrifuge Hitachi CRG Series
R20A2 at 4000 r/min for 5 min. The solution was injected into the
capillary column SP-2560 (100 m × 0.25 mm ID, 0.25 m film) of
Fig. 1. (a) The packing arrangement in the extractor unit. (b) Flow scheme of the CO2 supercritical fluid extraction pilot plant (F: flow meter; H1: freezer; H2: heater; H3:
heat exchanger; PI: pressure indicator; ST: stirrer; TI: temperature indicator; V1, V2, V3: gas valve).
H.N. Nguyen et al. / Chemical Engineering and Processing 50 (2011) 1207–1213
Table 1
Coded levels and real values of independent variables.
Factor
Symbols coded
Temperature (◦ C)
Pressure (MPa)
Particle size (mm)
X1
X2
X3
Levels
−1
0
1
35.00
15.00
0.16
47.50
22.50
0.64
60.00
30.00
1.12
the Gas Chromatograph GC-17A Shimadzu with helium as carrier
gas. Operating temperature program for column was set at 140 ◦ C
for 5 min then increased to 240 ◦ C at 4 ◦ C/min and withheld for
15 min.
2.5. Experiment design for optimization of operating condition
Response surface methodology was employed to optimize the
extraction process using SC-CO2 with EtOH addition for substrate
pretreatment. The main parameters considered are pressure, temperature, particle size, EtOH concentration, solvent flow rate and
extraction time. EtOH concentration was fixed at 10% w/w as a
consequence of the discussion in Section 3.2. The CO2 flow rate
was fixed at 0.5 m3 /h because of the limitation of the apparatus
which worked unstable at the flow rate higher than 0.5 m3 /h. Consequently, extraction time was fixed at 7 h in which no significant
change in oil yield was observed. In this study, the optimization of the extraction process was based from three parameters:
pressure, temperature and particle size. In Table 1, X1 , X2 and X3
represent three independent variables: temperature, pressure and
average particle size of MO ground kernels, respectively. Temperature was varied from 35 ◦ C to 60 ◦ C. Pressure range was from 15 MPa
to 30 MPa while the average particle size was from 0.16 mm to
1.12 mm. The estimated range of the three factors was divided into
three levels. Coded level 0 is the midpoint of each factor range.
Coded levels −1 and 1 correspond to the lowest value and the highest value of the experimental parameter, respectively. A central
composite design method was used to design the experiment.
Table 2 shows all the twenty experiments which included eight
factorial points, four axial points and one center point. Factorial
points have all possible combinations of the +1 and −1 levels of the
three factors. The axial points have all of the factors set to 0 except
one factor, which has the value +/− Alpha. Alpha, the axial distance,
has a coded value 1 for Face Centered type. Center point has all
Table 2
Central composite design for experiment and results of oil yield.
Runs
Coded variables
X1
1
2
3
4
5
6
7
8
9
10
11
12
13
14
15
16
17
18
19
20
−1
−1
1
0
−1
0
0
−1
0
1
0
0
0
1
1
1
0
0
−1
0
1209
levels set to coded level 0. The center point was repeated six times
to estimate experimental error while other points were duplicated.
All experiments were conducted at CO2 flow rate of 0.5 m3 /h with
10% by weight EtOH and used multi-layer packed bed with 4 layers.
3. Results and discussion
3.1. Effect of the number of layers and the thickness of material
layers on oil yield
Table 3 shows the oil yield of SC-CO2 -EtOH using random
packing and multiple layers packing arrangement. The results for
random packing method as presented are equivalent to a layer
with 100 mm thickness. The remainder belongs to multiple layers packed bed. All runs were triplicated at a pressure of 30 MPa,
temperature of 47.5 ◦ C, with average particle size of 0.32 mm. A
10% by weight EtOH was added for substrate pretreatment. Significant increase in oil yield was observed with a maximum of 26.89%,
when multiple-layered packing method was employed. This result
agrees with those of Rubio-Rodriguez et al. [28] on SFE of omega-3
rich oil in hake by-products. However, their study did not include
the effect of neither thickness of sample layer nor number of layers
on extraction yield.
Table 3 shows that decreasing the thickness of the sample layer
but increasing the number of layers of the packed bed enhanced
the extraction yield. The multi-layer packed bed has prevented the
formation of preferential channels thus allowing the SC-CO2 to be
distributed uniformly in the extractor. It allowed the solvent to
penetrate covering wide surface areas of the ground kernels thus
promoting better extraction of the oil [28]. The gaps between layers
are akin to the liquid re-distributors in multiple-staged packed bed
absorption column purposely employed to constantly wet the surface of the packings. It was noted, however, that when the amount
of the ground kernels was increased as exhibited by its increasing
thickness in a layer, the extraction of oil slowed down as exhibited
by the corresponding reduction in oil yield [29]. The reverse is true
when the thickness of the kernels in the tray layer was reduced.
It can be concluded that the thinner the thickness of the kernels
in a layer at multiple stages, the less resistance of mass transfer,
thus increasing the yield. However, the operating efficiency of the
extractor system for multiple stages as a whole was low obviously
because of the gaps in between layers. In a configuration of ten layers, the operating efficiency exhibited is only 66.7% far from the
acceptable value of 75%.
3.2. Effect of ethanol ratio on oil yield
Oil yield
X2
−1
1
1
1
−1
0
0
0
0
0
0
−1
0
−1
−1
1
0
0
1
0
X3
−1
−1
1
0
1
0
0
0
0
0
0
0
−1
−1
1
−1
1
0
1
0
22.41
36.13
34.55
37.82
21.64
33.13
32.78
34.62
32.92
27.71
32.65
16.93
32.58
8.23
6.71
35.20
31.90
32.59
35.67
33.09
Co-solvent EtOH in SC-CO2 enhanced extraction yield was
reported by several authors. Casas et al. [30] and Lee et al. [31],
have stated that ethanol have swollen the cellular structure thus
facilitating the SC-CO2 penetration. Others such as Guclu-Ustundag
Table 3
Oil yield of SFE using random packing and multiple stages packed bed (extraction
conditions were at pressure of 30 MPa, temperature of 47.5 ◦ C, average particle size
of 0.32 mm, CO2 flow rate of 0.5 m3 /h and 10% by weight EtOH).
Number
of layers
10
5
4
2
1
Thickness
of a layer
(mm)
Oil yield
(% wt.)
10
20
25
50
100
40.01
38.01
37.25
34.49
29.24
±
±
±
±
±
0.71
0.57
0.72
0.78
0.97
Recoverya
(%)
Working
efficiency of
extractor (%)
100.0
95.0
93.1
86.2
73.1
66.7
71.4
83.3
90.9
100.0
a
The recovery is the ratio of oil yield which is extracted in each experiment in
comparison with the highest oil yield (40.01%).
1210
H.N. Nguyen et al. / Chemical Engineering and Processing 50 (2011) 1207–1213
Table 4
Oil yield with varying initial EtOH ratio (extraction conditions were at pressure of
22.5 MPa, temperature of 47.5 ◦ C, average particle size of 1.12 mm, CO2 flow rate of
0.5 m3 /h).
With co-solvent
0% EtOH
10% EtOH
15% EtOH
Oil yield
28.71 ± 0.67
31.90 ± 0.51
31.74 ± 0.82
Table 5
Analysis of variance of three polynomial models.
Type of model
F
Pa
Lack of fit-Pa
Linear model
Quadratic model
Cubic model
19.02
1298.87
2.29
<0.0001
<0.0001
0.1747
<0.0001
0.3273
0.9833
a
P < 0.01 highly significant; 0.01 ≤ P < 0.05 significant; P ≥ 0.05 insignificant.
and Temelli [32], reported that the phenomenon was due to the
increase in local density of the solvent when EtOH was added. In
this work, substrate pretreatment method using initial 10% and 15%
by weight EtOH was added directly to the extractor, blended with
SC-CO2 and a control test of just SC-CO2 for the same operating conditions (pressure of 22.5 MPa, temperature of 47.5 ◦ C, CO2 flow rate
of 0.5 m3 /h and average particle size of 1.12 mm) were performed
in triplicate. The ground kernels were arranged into four layers at
25 mm thickness on each layer. The results are shown in Table 4. The
addition of 10% by weight EtOH in SC-CO2 has increased the extraction yield of up to 10%. This could be possibility due to the swelling
of the cellular structure of the ground kernels which facilitated the
SC–CO2 penetration to the oil rich area of the cell. In addition, at
CO2 flow rate of 0.5 m3 /h (or 0.45 kg/h), the amount of EtOH in the
extractor was nearly exhausted within the first 30 min of the run.
Therefore, the hypothesis by which the addition of EtOH enhanced
extraction yield due to the increase in local density of the solvent
was minor in this case. It was observed however, that extraction
yield has not changed significantly when EtOH ratio was raised
from 10% to 15%. Therefore, the 10% by weight EtOH is sufficient
to effect increase in the oil yield.
Y = 32.86 − 3.81 X1 + 10.35 X2 − 0.41 X3 + 3.38 X1 X2 − 0.12X1 X3
3.3. Statistical analysis of regression models
Y = 32.86 − 3.81 X1 + 10.35 X2 − 0.41 X3 + 3.38 X1 X2 − 1.69X12
Three polynomial models were employed to explain the MO oil
yield response versus the variation of three independent variables
namely, temperature, pressure, and average particle size. The models were linear model (Eq. (1)), quadratic model (Eq. (2)) and cubic
model (Eq. (3)).
Y = ˇ0 +
ˇi Xi
Y = ˇ0 +
ˇi Xi +
ˇii Xi2 +
ˇij Xi Xj
Y = ˇ0 +
ˇi Xi +
ˇii Xi2 +
ˇij Xi Xj +
+
(1)
(2)
ˇiii Xi3
ˇiij Xi2 Xj
(3)
where the experimental response is coded as Y. ˇ0 , ˇi , ˇii , ˇij , ˇiii , ˇiij
correspond to constants and regression co-efficients of the models
while Xi , Xj represent the independent variables.
Based on experimental results in Table 2, all constants and
regression co-efficients were computed with the aid of DesignExpert software version 7.0.1 and evaluated by analysis of variance
(ANOVA). Table 5 shows the ANOVA results of the three polynomial
models. P value for a term is the probability of getting a Fisher ratio
(F) that evaluates if a term has an effect on the response. F is the test
for comparing the variance associated with the model with residual
variance. If the P value for a term is smaller than 0.01, the term is
highly significant. If it is in the range from 0.01 to 0.05, the term is
significant and it becomes insignificant if P is higher than 0.05. The
quadratic model was highly significant (P < 0.01) and has a good fit
(P = 0.3275) at confidence level of 95%. The cubic model meanwhile
was not significant (P > 0.05) while the linear model showed significant lack of fit (P < 0.01). Therefore, the quadratic model was chosen
as the regression model for oil yield responding to the variation of
process parameters, temperature, pressure and particle size. The
regression model is
+ 0.15X2 X3 − 1.69X12 − 5.48X22 − 0.62X32
(4)
Table 6 exhibits all the coefficients of the quadratic model. All
the coefficients of the independent variables in first order and second order were highly significant (P < 0.01) while in the interaction
between variables, the co-efficients were insignificant except that
of X1 X2 . This means that interactions between temperature and
particle size, pressure and particle size contributed very little to
the response. The regression model is finally reduced to:
− 5.48X22 − 0.62X32
(5)
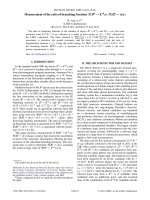
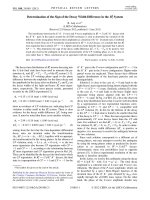
Fig. 2 indicates that the predicted values were very close to the
actual values. Indeed, the satisfactory co-efficient of determination,
R2 , was 0.9996. Moreover, the adjusted-R2 of 0.9992 means the
model responded very well up to 99.92% of the total variations. All
these show that the quadratic model is acceptable. It is the model
that would be used to predict the optimum condition of SC-CO2 EtOH extraction for maximum oil yield. The predicted optimum
point was at a temperature of 44.30 ◦ C, pressure of 28.97 MPa and
average particle size of 0.54 mm with oil yield of 37.85%.
3.4. Response surface
The response surface plot in three dimensions exhibits the relationships between the response variable and two independent
variables when other variables remain constants. With the aid of
Design-Expert software version 7.0.1, the surface response of yield
to the variation of temperature, pressure and average particle size
of material is shown in Figs. 3–5.
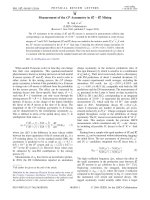
All the second order term of the three variables influenced in the
response significantly, as presented in Eq. (5). The variation of pressure is covariant with the density changes and likely with solubility.
Therefore an increase in pressure up to 28.97 MPa improved the
oil yield as shown in Fig. 3. However, increasing the pressure further reduced the oil yield because of the decrease in mass transfer
Table 6
Co-efficients of quadratic regression model.
Coded variables
X1
X2
X3
X1 X2
X1 X3
X2 X3
X12
X22
X32
Co-efficient values
Pa
−3.81
<0.0001
10.35
<0.0001
−0.41
0.0005
3.38
<0.0001
−0.12
0.2177
0.15
0.1297
−1.69
<0.0001
−5.48
<0.0001
−0.62
0.0023
a
P < 0.01 highly significant; 0.01 ≤ P < 0.05 significant; P ≥ 0.05 insignificant.
H.N. Nguyen et al. / Chemical Engineering and Processing 50 (2011) 1207–1213
1211
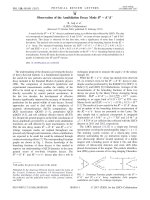
Fig. 4. Response surface of oil yield to the variation of particle size and temperature
at pressure of 29.39 MPa, CO2 flow rate of 0.5 m3 /h and 10% by weigh EtOH.
Fig. 2. Plot of predicted oil yield of the regression quadratic model related with
experimental values.
coefficients due to solvent viscosity increased, consequently,
reduced the diffusivity [33].
Table 2 shows that, at a pressure of 22.5 MPa and below,
together with increasing temperature, the amount of the extract
was decreasing. When the pressure was about 30 MPa, the oil yield
was initially co-variant with the temperature obtaining the highest oil yield at 44.3 ◦ C. By increasing the temperature further, it
becomes contra-variant thus decreasing the oil yield, as illustrated
in Figs. 3 and 4. This phenomenon with temperature influenced
the solvating capacity of the solvent in two opposite ways. One
way is the natural tendency of a fluid to develop low density at
elevated temperature thus reducing concentration of solute that
will be dissolved. Increasing the temperature further will enhance
the volatilities of the oil [16,34]. The response in the variation of
temperature and pressure observed at 30 MPa in this study is similar to the results of Liu et al. [34] on Passiflora seed oil which is
high in C18 fatty acid content. Also, the phenomenon illustrates
that within the range of 22.5–30 MPa is a special point. Within
the special point, the solubility behavior of Ben oil changes from
contra-variant to co-variant with increasing temperature. This special point of pressure is a crossover pressure point or interaction
point of the isotherms [19,35]. This result agreed with the interaction point of the isotherms observed by Stahl and Quirin [35].
In their study, the interaction point of the isotherms of solubility
of soybean, rich in C18 fatty acid content, was below 30 MPa. In the
other hand, Kiriamiti et al. [19] reported that the crossover pressure
point of high oleic sunflower oil was higher than 25 MPa.
The second order term of average particle size of material
effected on the response, as presented in Eq. (5) and Figs. 4 and 5.
Evidently, reducing the particle size promoted a better solid–fluid
contact brought about by large surface areas of the solid materials.
Grinding also helped break the cellulosic membrane that facilitated the release of the oil from the internal structures of the
kernels [19]. However, if the average particle size was smaller than
0.54 mm (approximate average of 28–32 mesh), the materials tend
to agglomerate into solid lumps. The exposed area of the individual
particle to the solvent has now narrowed. The materials developed
a bulk resistance limiting the intimate contact of the solvent with
the oil rich interior of the kernels, hence, reducing the yield [36].
Fig. 3. Response surface of oil yield to the variation of pressure and temperature at
average particle size of 1.07 mm, CO2 flow rate of 0.5 m3 /h and 10% by weigh EtOH.
Fig. 5. Response surface of oil yield to the variation of particle size and pressure at
temperature of 44.12 ◦ C, CO2 flow rate of 0.5 m3 /h and 10% by weigh EtOH.
1212
H.N. Nguyen et al. / Chemical Engineering and Processing 50 (2011) 1207–1213
Table 7
Relative ratio compositions of Moringa oleifera seed oil.
Fatty
acid
SC-CO2
extract
SC-CO2 -EtOH
extract
C14:0
C16:0
C16:1
C18:0
C18:1
C18:2
C18:3
C20:0
C20:1
C22:0
C24:0
0.19 ± 0.05
6.53 ± 0.28
1.91 ± 0.10
5.93 ± 0.02
69.70 ± 0.32
0.84 ± 0.00
0.28 ± 0.04
4.15 ± 0.04
2.71 ± 0.24
6.71 ± 0.48
1.00 ± 0.03
0.22 ± 0.01
6.40 ± 0.13
1.76 ± 0.19
5.59 ± 0.02
69.65 ± 0.51
0.82 ± 0.01
0.39 ± 0.04
4.47 ± 0.27
2.94 ± 0.07
6.58 ± 0.06
1.14 ± 0.00
a
Soxhlet extract
This work
0.30
5.66
1.37
5.62
70.23
0.89
0.34
4.38
2.58
7.55
1.03
±
±
±
±
±
±
±
±
±
±
±
0.18
0.34
0.08
0.08
0.31
0.12
0.21
0.05
0.04
0.26
0.04
Reported valuea
0.10 ±
7.80 ±
2.20 ±
7.60 ±
67.90 ±
1.10 ±
0.20 ±
4.00 ±
1.50 ±
6.20 ±
1.30 ±
0.05
1.25
0.06
0.05
0.75
0.10
0.00
0.06
0.06
0.50
Abdulkarim et al. [10].
Similar result was observed by Cao and Ito [37] on oil yield from
grape seed when the particle size was varied. In their study, the
yield has reached a maximum when the particle size was at an average of 20–40 mesh which later showed a decreasing trend when the
particle size was further reduced.
Fig. 3 also showed the dominant influence of the pressure more
than that of temperature. Indeed at low pressure (15 MPa) and
increasing temperature from 35 ◦ C to 60 ◦ C, the highest oil yield was
only 22% while at 30 MPa, the lowest oil yield was higher by 34.55%,
as presented in Table 2. In Figs. 4 and 5, particle size clearly shows
minor effect on the yield contrary to pressure and temperature.
3.5. Comparison of SFE and Soxhlet method
Soxhlet method with n-hexane as solvent to extract oil from
M. oleifera kernels was conducted. The oil yield of Soxhlet method
(37.5%) is lower than that of SFE using SC-CO2 with 10% by weight
EtOH addition for pretreatment (37.8%) as shown in Table 2. MO
seed oils extracted by n-hexane, SC-CO2 and SC-CO2 -EtOH were
analyzed for fatty acids content by GC method. To identify the
fatty acids, the peak retention time of the sample was compared
with those of standards. The results are presented in Table 7. MO
oil is high in total unsaturated fatty acid (about 75.5%). Monounsaturated oleic acid is the main component (about 70%). There
is no significant difference between the oils that were extracted by
n-hexane, SC-CO2 and SC-CO2 -EtOH in terms of fatty acid composition. The findings are similar to the results of the Soxhlet extraction
using light petroleum ether reported by Abdulkarim et al. [10].
Notably, SFE using SC-CO2 with EtOH addition for pretreatment can
be a good alternative to conventional solvent extraction for Ben oil.
4. Conclusions
Green technology SFE using supercritical carbon dioxide was
applied to extract oil from Moringa oleifera kernels. A maximum
increase of 26.89% in oil yield was realized when modified loading method in multi-layered arrangement was used. Adding 10%
by weight of EtOH for substrate pretreatment increased 10% in oil
yield. Moreover, there is no significant difference in yield (P > 0.05)
between SFE using SC-CO2 -EtOH and Soxhlet extraction using
n-hexane. Ben oil extracted by SFE using both SC-CO2 and SC-CO2 EtOH and Soxhlet extraction using n-hexane exhibited similar fatty
acid compositions. Highly evident from the findings is that SC-CO2 EtOH offered a good substitute for toxic organic solvents such as
n-hexane in the traditional extraction process. Furthermore, optimization of the operating conditions of SC-CO2 -EtOH extraction
was developed. The quadratic model exhibited a good response up
to 99.92% of the variation. All the first order and second order terms
of the three variables influenced the response significantly. Also,
there is a pronounced interaction between temperate and pressure
on oil yield. Pressure played a key role on oil yield. Relative to pressure as well as temperature, particle size has minor effect on the
yield. The predicted optimum point was at temperature of 44.30 ◦ C,
pressure of 28.97 MPa and average particle size of 0.54 mm with oil
yield of 37.85%. A crossover pressure point of Ben oil was found
within the range 22.5–30 MPa. The effects of solvent flow rate and
extraction time on MO oil yield is being recommended for further
study.
Acknowledgements
The authors gratefully acknowledge the financial support
received from the ASEAN University Network for South-east Asia
Engineering Education Development Network (AUN/SEED-Net)
program through the Japan International Co-operation Agency
(JICA). Acknowledgement is also extended to Mindanao State
University-Illigan Institute of Technology (MSU-IIT) for the SFE
facility, De la Salle University-Manila for the use of laboratory
instruments/equipment for Soxhlet extraction and Tokyo Institute
of Technology (TIT) for the use for GC analyses of fatty acid composition.
References
[1] M.E. Olson, S. Carlquist, Stem and root anatomical correlations with life form
diversity, ecology, and systematics in Moringa (Moringaceae), Bot. J. Linn. Soc.
135 (2001) 315–348.
[2] S. Iqbal, M.I. Banger, Original Article – effect of season and production location
on antioxidant activity of Moringa oleifera leaves grown in Pakistan, J. Food
Compos. Anal. 19 (2006) 544–551.
[3] N. Richter, P. Siddhuraju, K. Becker, Evaluation of nutritional quality of moringa
(Moringa oleifera Lam.) leaves as an alternative protein source for Nile tilapia
(Oreochromis niloticus L.), Aquaculture 217 (2003) 599–611.
[4] N.K. Amaglo, R.N. Bennett, R.B.L. Curto, E.A.S. Rosa, V.L. Turco, A. Giuffrida, A.L.
Curto, F. Crea, G.M. Timpo, Profiling selected phytochemicals and nutrients in
different tissues of the multipurpose tree Moringa oleifera L., grown in Ghana,
Food Chem. 122 (2010) 1047–1054.
[5] A.P. Guevara, C. Vargas, H. Sakurai, Y. Fujiwara, K. Hashimoto, T. Maoka, M.
Kozuka, Y. Ito, H. Tokuda, H. Nishino, An antitumor promoter from Moringa
oleifera Lam, Mutat. Res. Genet. Toxicol. Environ. Mutagen. 440 (1999) 181–188.
[6] L.V. Costa-Lotufo, M.T.H. Khan, A. Ather, D.V. Wilke, P.C. Jimenez, C.I. Pessoa,
M.E.A. der Moraes, M.O. der Moraes, Studies of the anticancer potential of plants
used in Bangladeshi folk medicine, J. Ethnopharmacol. 99 (2005) 21–30.
[7] S.G. Mahajan, A.A. Mehta, Immunosuppressive activity of ethanolic extract
of seeds of Moringa oleifera Lam. in experimental immune inflammation, J.
Ethnopharmacol. 130 (2010) 183–186.
[8] M. Akhtar, S.M. Hasany, M.I. Bhanger, S. Iqbal, Sorption potential of Moringa
oleifera pods for the removal of organic pollutants from aqueous solutions, J.
Hazard. Mater. 141 (2007) 546–556.
[9] H. Bhuptawat, G.K. Folkard, S. Chaudhari, Innovative physico-chemical treatment of wastewater incorporating Moringa oleifera seed coagulant, J. Hazard.
Mater. 142 (2007) 477–482.
[10] S.M. Abdulkarim, K. Long, O.M. Lai, S.K.S. Muhammad, H.M. Ghazali, Some
physico-chemical properties of Moringa oleifera seed oil extracted using solvent
and aqueous enzymatic methods, Food Chem. 93 (2005) 253–263.
[11] R. Kleiman, D.A. Ashley, J.H. Brown, Short communication – comparison of two
seed oils used in cosmetics, moringa and marula, Ind. Crop. Product. 28 (2008)
361–364.
[12] S.M. Abdulkarim, K. Long, O.M. Lai, S.K.S. Muhammad, H.M. Ghazali, Frying quality and stability of high-oleic Moringa oleifera seed oil in comparison with other
vegetable oils, Food Chem. 105 (2007) 1382–1389.
[13] F. Anwar, A.I. Hussain, S. Iqbal, M.I. Bhanger, Enhancement of the oxidative stability of some vegetable oils by blending with Moringa oleifera oil, Food Chem.
103 (2007) 1181–1191.
[14] S. Lalas, J. Tsaknis, Characterization of Moringa oleifera seed oil variety “Perriyakulam 1”, J. Food Compos. Anal., doi:10.1006/jfca.2001.1042.
[15] M.A. McHugh, V.J. Krukonis, Supercritical Fluid Extraction – Principles and
Practice, 2nd ed., Butterworth-Heinemann, London, 1994.
[16] G. Brunner, Supercritical fluids: technology and application to food processing,
J. Food Eng. 67 (2005) 21–33.
[17] E. Reverchon, I.D. Marco, Review – supercritical fluid extraction and fractionation of natural matter, J. Supercrit. Fluids 38 (2006) 146–166.
[18] M. Herrero, A. Cifuentes, E. Ibanez, Sub- and supercritical fluid extraction
of functional ingredients from different natural sources: plants, food-byproducts, algae and microalgae – a review, Food Chem. 98 (2006) 136–148.
H.N. Nguyen et al. / Chemical Engineering and Processing 50 (2011) 1207–1213
[19] H.K Kiriamiti, E. Rascol, A. Marty, J.S. Condoret, Extraction rates of oil from high
oleic sunflower seeds with supercritical carbon dioxide, Chem. Eng. Process. 41
(2001) 711–718.
[20] O. Boutin, E. Badens, Extraction from oleaginous seeds using supercritical CO2 :
experimental design and products quality, J. Food Eng. 92 (2009) 396–402.
[21] N.A.N. Norulaini, I.S.M. Zaidul, O. Anuar, A.K.M. Omar, Research paper – supercritical enhancement for separation of lauric acid and oleic acid in palm kernel
oil (PKO), Sep. Purif. Technol. 35 (2004) 55–60.
[22] S.G. Ozkal, U. Salgın, M.E. Yener, Supercritical carbon dioxide extraction of
hazelnut oil, J. Food Eng. 69 (2005) 217–223.
[23] U. Salgin, Extraction of jojoba seed oil using supercritical CO2 + ethanol mixture in green and high-tech separation process, J. Supercrit. Fluids 39 (2007)
330–337.
[24] Y. Sanchez-Vicente, A. Cabanas, J.A.R. Renuncio, C. Pando, Supercritical fluid
extraction of peach (Prunus persica) seed oil using carbon dioxide and ethanol,
J. Supercrit. Fluids 49 (2009) 167–173.
[25] R.B. Johnson, H.J. Barnett, Determination of fat content in fish feed by supercritical fluid extraction and subsequent lipid classification of extract by thin
layer chromatography-flame ionization detection, Aquaculture 216 (2003)
263–282.
[26] W. Horowitz, Official Methods of Analysis of the Association of Official Analytical Chemists, 13th ed., AOAC, Washington, DC, 1980.
[27] W.W. Christie, In Advances in Lipid Methodology – Two, 1st ed., The Oily Press,
Dundee, 1993.
[28] N. Rubio-Rodriguez, S.M.D. Diego, S. Beltran, I. Jaime, M.T. Sanz, J. Rovira, Supercritical fluid extraction of the omega-3 rich oil contained in hake (Merluccius
capensis–Merluccius paradoxus) by-products: study of the influence of process
[29]
[30]
[31]
[32]
[33]
[34]
[35]
[36]
[37]
1213
parameters on the extraction yield and oil quality, J. Supercrit. Fluids 47 (2008)
215–226.
J. Yin, A. Wang, W. Wei, Y. Liu, W. Shi, Analysis of the operation conditions for
supercritical fluid extraction of seed oil, Sep. Purif. Technol. 43 (2005) 163–167.
L. Casas, C. Mantell, M. Rodriguez, A. Torres, F.A. Macias, E.M.D.L. Ossa, Effect
of the addition of cosolvent on the supercritical fluid extraction of bioactive
compounds from Helianthus annuus L, J. Supercrit. Fluids 41 (2007) 43–49.
Y. Lee, A.L. Charles, H. Kung, C. Ho, T. Huang, Extraction of nobiletin and
tangeretin from Citrus depressa Hayata by supercritical carbon dioxide with
ethanol as modifier, Ind. Crop. Product. 31 (2010) 59–64.
O. Guclu-Ustundag, F. Temelli, Solubility behavior of ternary systems of lipids,
cosolvents and supercritical carbon dioxide and processing aspects, J. Supercrit.
Fluids 36 (2005) 1–15.
A. Ajchariyapagorn, T. Kumhom, S. Pongamphai, S. Douglas, P.L. Douglas, W.
Teppaitoon, Predicting the extraction yield of nimbin from neem seeds in
supercritical CO2 using group contribution methods, equations of state and
a shrinking core extraction model, J. Supercrit. Fluids 51 (2009) 36–42.
S. Liu, F. Yang, C. Zhang, H. Ji, P. Hong, C. Deng, Optimization of process parameters for supercritical carbon dioxide extraction of Passiflora seed oil by response
surface methodology, J. Supercrit. Fluids 48 (2009) 9–14.
E. Stahl, K.W. Quirin, Dense gas extraction on a laboratory scale: a survey of
some recent results, Fluid Phase Equilib. 10 (1983) 269–278.
S. Sayyar, Z.Z. Abidin, R. Yunus, A. Muhammad, Extraction of oil from jatropha
seeds-optimization and kinetics, Am. J. Appl. Sci. 6 (7) (2009) 1390–1395.
X. Cao, Y. Ito, Supercritical fluid extraction of grape seed oil and subsequent
separation of free fatty acids by high-speed counter-current chromatography,
J. Chromatogr. A 1021 (2003) 117–124.